Research Article | | Peer-Reviewed

Relationship Between Blood Lead Level (BLL) and Haematological Parameters of People Living in and Around a Closed Lead Mine Area in Odisha, India

Received: 31 December 2025     Accepted: 19 January 2026     Published: 17 October 2026
Views:       Downloads:
Abstract

It has been demonstrated that lead, a persistent environmental toxin, negatively impacts the immunological and hematopoietic systems. In this study, populations residing in and around a closed lead mine area in Sargipalli, Sundargarh district, Odisha, India, are examined for the relationship between haematological parameters and blood lead levels (PbB). Blood samples from individuals of all ages and genders were collected from five communities within a five-kilometre radius of the abandoned mine site. In compliance with standard protocols, blood lead concentrations were measured using Atomic Absorption Spectrophotometry (AAS). Haematological parameters examined were haemoglobin concentration, haematocrit (PCV), mean corpuscular haemoglobin (MCH), erythrocyte sedimentation rate (ESR), total red blood cell (RBC) count, total white blood cell (WBC) count, and differential leukocyte count. The majority of haematological variables and PbB levels were shown to be significantly correlated by statistical analysis. While haemoglobin concentration, MCH, and hemocrit dramatically dropped as blood lead concentration grew, total RBC and WBC counts, ESR, and cytotoxicity percentage all increased dose-dependently. Differential leukocyte analysis revealed neutropenia along with monocytosis, basophilia, and eosinophilia, indicating immunological dysregulation. The results show that long-term exposure to ambient lead significantly changes haematological profiles and impairs immune function in exposed populations. Therefore, in communities affected by mining, blood lead levels provide a trustworthy biomarker for evaluating lead-induced haematotoxicity and related health hazards.

Published in American Journal of Science, Engineering and Technology (Volume 11, Issue 4)

This article belongs to the Special Issue Advances in Translational Research, Biotechnology, and Sustainable Bio-Innovations

DOI 10.11648/j.ajset.20261104.19
Page(s) 316-322
Creative Commons

This is an Open Access article, distributed under the terms of the Creative Commons Attribution 4.0 International License (http://creativecommons.org/licenses/by/4.0/), which permits unrestricted use, distribution and reproduction in any medium or format, provided the original work is properly cited.

Copyright

Copyright © The Author(s), 2026. Published by Science Publishing Group

Keywords

Lead, Haematocrit, Blood, Haemoglobin, Eosinophilia, Basophilia, Monocytosis

1. Introduction
The field settings are appropriate for researching the impacts of endemic lead pollution, in accordance with WHO standards on lead toxicity . Additionally, there are several other compelling reasons to investigate lead toxicity in the field: (i) many diseases are linked to environmental quality; (ii) several environmental contaminants have the potential to be immunotoxic; and (iii) many diseases have an immunological component. Concerns over the health state also include screening examinations using traditional haematology and other functional testing. According to the WHO's views on the aforementioned tests and assays in field settings, immunological biomarkers offer enormous promise but have not yet been thoroughly investigated, most likely due to practical limitations of a lack of specificity and predictivity. This parameter is used to assess the state of the defence systems, especially in tier-I testing , since leucocytes are important in both specific and non-specific humoral and cellular immune responses. (2002). Haematocrit is another potential measure, although while it may be thought of as a general sign of stress, it has no known specificity for any immune function. In certain situations, haemoglobin estimation may be carried out. Previous research has shown that lead accumulation and absorption in the blood are dependent on both the duration of exposure and the dose . Because blood is a reliable biomarker of lead toxicosis, it is clear how lead affects haematological parameters.
2. Materials and Methods
2.1. The Study Area
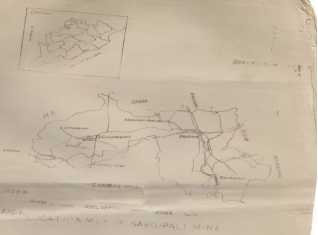
Figure 1. Trace Map of Sargipalli Lead Mine Area.
The present investigation focuses on the levels of lead in blood (PbB) and hair (PbH) in the community surrounding the Sargipali lead mine in Odisha, which was operated by Hindustan Zinc Limited from 1983 to 2003. As shown by the trace map, five villages within a 5-kilometre radius were chosen as case study areas for sampling; the village of Bharatpur is near the mining site, and the other villages are 1 km apart within a 5-kilometre radius; the village of Jhimirmaul is near the tailing dam and the Ichha Nala River, which is the mine's main drainage system.
2.2. Analysis of Blood Samples for Lead
The Australian standard (AS2411-1980) for AAS was adhered to. The heparinised blood samples were stored at 4°C following collection. Three millilitres of well-mixed blood were immediately added to the centrifuge tube for examination. The lead was complexed with 0.5 ml of 2% APDC and thoroughly shaken to extract it into 3 ml of n-butyl acetate. AAS found lead in the organic phase in less than an hour. The computation was finished using a calibration curve and a standard solution. The sample's OD Standard Value (g/gm/ml of tissue) represents the lead content.
2.3. Haematological Method
Sahoo's (1991) techniques for haematological investigations were used.
2.3.1. Blood Collection
Using an injection syringe (Needle No. 19), a subclavian puncture was used to get blood from the volunteers. To reduce the possibility of blood clotting, 10% sodium heparin was used to rinse the syringe and needle.
2.3.2. TC of RBC & WBC
Blood was extracted using a micropipette up to the 0.5 mark from the glass Petri dish that had been previously collected and rinsed with sodium heparin. Hayem's fluid was then drawn up to mark 101 and thoroughly mixed using a continuous spin. The cover slip of the hemocytometer was then ringed and spirit-dried, and one drop of blood was added. Once it had settled, it was taken for counting under a microscope. The smallest squares, one, five, thirteen, twenty-one, and twenty-five, were carefully counted. While the RBCs on the upper and left sides of the square were rejected, those on the lower and right sides should be included in the total. Compute: Blood was extracted from the previously collected glass, and the total number of red blood cells in mm3.
(a) RBC
Sodium heparin is sucked through a micropipette up to the 0.5 mark on a Petri dish ring. Next, Hayem's fluid was sucked up to the 101 mark and rotated steadily to mix it thoroughly. Once the hemocytometer's cover slip had been ringed and dried with spirit, one drop of blood was then placed within. Following the settlement, it was removed for microscopic counting. The first, fifth, thirteenth, twenty-first, and twenty-fifth smallest squares were meticulously counted. While the RBCs on the upper-left side of the square were rejected, those on the lower and right sides should be included in the total. Total number of RBCs in mm3 = number of RBCs in 5 squares x 10,000.
(b) WBC
The equipment used was clean. After the blood was drawn up to mark 0.5, the gentian violet solution was drawn up to mark 11 of the pipette. To make sure the liquids and blood were sufficiently mixed, the pipette was then carefully rotated. The entire WBC was then diluted by maintaining the dilution for five minutes. The liquid was extracted from the pipette in one or two drips. The pipette was then brought extremely close to the edge of the coverslip to adequately saturate the counting chamber. To give the WBC time to settle in the fluid, the slide was left for a while. After that, this slide was put under a microscope so that counting could start. The WBCs were counted using the four squares of the counting chamber on the slide. WBCs situated near the border were not considered. The weak staining pigment and retractile appearance of WBCs were used to identify them. No WBC/mm = number of cells counted × 10 x dilution The number of squares counted (4).
2.3.3. DC of WBC
After applying a drop to the end of a spotless slide, set it on a smooth surface and use your left hand to keep it stable. Hold a second slide or drawing slide at a 45-degree angle directly in front of the blood drop. Draw this slide so that the blood spreads down its edge. A blood film was created on the first slide by pushing the second or drawing slide forward at a 45° angle without applying any pressure. The blood film was then allowed to dry in the open. Leishman's or Wright's stain was applied to the blood film. Distilled water was carefully added to the stain after a minute. The stain and water were thoroughly mixed by sucking the mixture in and out of a pipette. Eventually, the mixture's surface turns into a greenish metallic scum. Allow the diluted stain to work for seven to ten minutes. After draining the stain, distilled water was used to wash the film for ten seconds. The colour of the movie should be rose pink. After drying, the slide was inspected for white blood corpuscles under a microscope. To gain a sense of leucocytes, the stained film was first seen under a low-power microscope. After lightly applying oil to the discoloured film, it was viewed with an oil immersion lens or high-power lens. From top to bottom, count the different types of white blood corpuscles in a longitudinal segment of the film. Determine the percentage by using the tally method to count 100 WBC noting on paper.
2.3.4. Estimation of Hb & Haematocrit
Sahli's haemometer was used to assess the concentration of haemoglobin. This is accomplished by removing the graduated tube from distilled water and replacing it with methylated alcohol. Following drying, 2 cc of N/10 HC1 is added to the dry graduated tube using a dropper. The micropipette was used to transfer the previously obtained heparinized blood into the graduated tube. Distilled water was added dropwise while continuously swirling until the experiment type's color matched the side tubes. The blood dilution mark, or the proportion of haemoglobin in the blood, was then recorded.
Blood is drawn using an anticoagulant, stored in a Wintrobe tube, then centrifuged for 30 minutes at 3000 rpm. The PCV, or hematocrit value, is the volume that the red blood cells occupy when they are packed together.
2.4. Statistical Techniques
The following statistical analysis was performed on all the data collected from the sensitive and control villagers: Pearson’s Correlation Coefficient (r): In accordance with Sanders (1994) and Chainy et al., the r-values between lead accumulation and other parameters of the control groups and sensitive groups were computed with significance .
Table 1. Hematological parameters (Mean <i></i> SEM) and F-values from ANOVA in blood samples of People collected from different villages around 5 KM radius of the Sargipalli Lead mining area.

Distance from Core Mine area in KM

Blood Led Levels (µg/ml)

Hb (gm %)

TC RBC (Million)

TLC (thousands)

ESR (Mm/hr)

PCV (%)

% of Cytotoxicity

Control

10

0.071±0.01

n= 40

11.7±0.12

5.2±0.16

5.7±0.14

8.5±0.10

37.8 ±0.1

8.4 ±0.11

≤1

0.471±0.10

n=80

8.3 ±0.05

7.4±0.03

8.6 ±0.12

29.6 ±0.21

22.1 ±0.2

34.37±0.23

>1 ≤ 2

0.323±0.08

n=90

9.2 ±0.06

6.18 ±0.02

7.3±0.03

26.3 ±0.13

24.8 ±0.1

28.43 ±0.21

>2 ≤ 3

0.296±0.06

n=38

10.1 ±0.03

5.42 ±0.02

6.35 ±0.22

24.3 ±0.14

26.8 ±0.4

22.91±0.41

>3 ≤ 4

0.394±0.08

n=64

9.1 ±0.02

5.7 ±0.02

6.28 ±0.31

25.1 ±0.12

24.21 ±0.2

19.21±0.33

>4 ≤ 5

0.180±0.03

n=95

11.2 ±0.08

5.1 ±0.03

5.7±0.23

11.4 ±0.26

38.2 ±0.3

9.92±0.38

F - values

33.67

67.54

42.13

28.87

28.73

26.96

12.73

Table 2. Correlation Co efficient (r) between Blood lead (PbB)level and Haematological parameters of People in different villages around 5 KM radius of Sargipalli Lead mining area.

Distance from Core Mine area in KM

Hb

TRBC

TLC

ESR

PVC

% of cytotoxicity

Control

0.7

0.4

0.5

0.6

0.8

0.7

≤1

0.8†

0.6┴

0.7†

0.7┴

0.6┴

0.6┴

>1 ≤ 2

0.7┴

0.7┴

0.5┴

0.6†

0.8†

0.8┴

>2 ≤ 3

0.6†

0.8†

0.6┴

0.7┴

0.5┴

0.6†

>3 ≤ 4

0.7┴

0.7┴

0.8†

0.7†

0.5┴

0.7†

>4 ≤ 5

0.8†

0.7

0.7┴

0.6

0.8†

0.6†

Sgnificance level ┴ 0.001, †-0.05
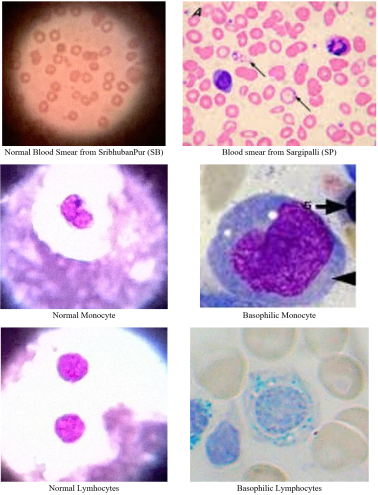
Figure 2. Comparison between the blood smears of Control Village and Mine Site Village.
3. Results
Following analysis, the gm% of haemoglobin decreases while blood parameters such as total RBC, total WBC, and haemocrit increase (Table 1) as blood lead concentrations rise. Bharatpur (BP) villagers have a higher total RBC concentration (7.4 ±0.03 million/mm3) than Sargipalli (SP), which is 6.18±0.02, Jhargaon, which is 5.42±0.02, Jhimirmoul (JM), which is 5.7±0.02, and Sribhubanpur, which is 5.1±0.03. The total WBC concentration also increases dose-dependently, rising from 5.7±0.03 thousands/mm3 to 8.6±0.02 thousands/mm3. The range of the haemoglobin gram percentage (gm%) is 8.3±0.05 to 11.2±0.08 as well. Additionally, the ESR/hr ranges from 11.4 to 29.6. Sribhubanpur (SB) has the largest packed cell volume (PCV), at 38%, while Bharatpur (BP) has the lowest, at 22%.
4. Discussion
As seen in the preceding sections, lead absorption and accumulation depend on exposure duration and dosage. Because blood is a reliable biomarker of lead toxicosis, it is clear how lead affects hematological parameters. Only at high exposure levels can anaemia, the primary clinical manifestation of lead damage on the hematopoietic system, develop . Additionally, the study's outcomes are quite evident. During subacute brief exposure, the haemoglobin gm% does not drop to the point where the state is considered anaemic. Furthermore, cytotoxicity and a rise in the total number of red blood cells and white blood cells are compensatory mechanisms for cell death and breakage during xenobiotic exposure. According to Rout and Naik (2013), this could be the experimental animals' main reaction. The rise in cell count once more demonstrates the cells' immaturity and susceptibility to lytic processes. But when there is a lengthy period of chronic occupational exposure to lead, the haematocrit drops, and the RBC and WBC counts show a failure in the respiratory processes since over 25% of the cells die . Haemoglobin percentage fall in the. Anaemia is defined as a drop of hemoglobin to less than 50% or a haematocrit value of less than 35%. This is due to an increase in plasma volume caused by disrupted water balance or inhibition of "erythropoietin," the hormones for erythropoiesis or decreased erythrocyte survival, which may result in hypertension, as suggested by Howard (2001). The most favorable explanation in this regard is the failure of haemoglobin synthesis because lead inhibits several of its steps, including ferrochelatase, ACA dehydratase, and C Coproporphyrin oxidase, which causes basophilic stippling of red blood cells and sideroblastosis. Lead has also been demonstrated to increase the breakdown of haemoproteins by inducing haemoglobin oxygenase activity, which can negatively impact many cell processes like respiration and energy production. Since leucocytes are the primary component of the vertebrate immune system, the results of the total and differential counts of these cells require particular consideration for discussion. Since leucocytes are the type of cell involved in the body's defence, the white blood cell count is a good indicator of an individual's immunological health. The rise in functions like phagocytosis and anaphylaxis may be connected to the rise in the overall number of WBCs in all the villages near the mine. The D.C. of WBC data indicate that the quantity of neutrophils and lymphocytes decreases in all mine site villages as exposure distance decreases. Eosinophils, basophils, and monocytes, on the other hand, rise. This denotes moderate to severe immunological neutropenia linked to chronic inflammatory processes, aberrant liver disease, or allergic state. Inhibition of myeloperoxidase, lysozymes, lactoferrin, and hydrolases is linked to a decrease in neutrophil count, and this is typically related to inadequate defense against pyogenic bacteria. According to previous research, an increase in eosinophils and basophils increases the release of histamine perforin-like protein and C-reactive protein, which are typical markers of allergy and anaphylaxis . Since lymphocytes are linked to humoral and cell-mediated immune responses, a decline in their quantity could compromise the body's defenses. The exposed monocytes are immature macrophages that make up the mononuclear phagocyte system (MPS), which has two main purposes: it absorbs and eliminates particulate debris through opsonization when it is covered in complement or an antibody. To trigger the scientific immune response, the other role entails the initial identification, processing, and presentation of antigen to the T-lymphocyte. The fact that the number of monocytes has increased multiple times indicates that either these monocytes are incapable of maturing and carrying out their duty, or they are unable to remove the debris from the blood as a result of successive cell death (as the percentage of cytotoxicity increases). The outcomes closely resemble those of mercury exposure .
5. Conclusions
Hematological parameters are greatly impacted by lead exposure, and the effects vary depending on the amount and period of exposure. Chronic occupational exposure causes a detectable drop in hemoglobins percentage, hematocrit, and red blood cell count, indicating anemia and altered respiratory processes, although short-term subacute exposure may not cause anemia right away due to compensatory mechanisms. This is probably because lead interferes with the formation of hemoglobins and increases the breakdown of hemoproteins. Additionally, the immune system is impacted by lead exposure, which results in a rise in total white blood cells but a fall in neutrophils and lymphocytes, especially when exposure sources are closer. This implies a weakened immune system, heightened vulnerability to infections, and possible allergic or inflammatory reactions.
Abbreviations

WHO

World Health Organization

PbB

Blood Lead Level

AAS

Atomic Absorption Spectrophotometry

Hb

Haemoglobin

PCV

Packed Cell Volume

ESR

Erythrocyte Sedimentation Rate

TLC

Total Leukocyte Count

Acknowledgments
The Authors acknowledge the facilities provided by the Authorities of GIETU, Gunupur and Principal F.M. Auto College, Baleshwar and the Ethics Committee of F.M. Auto College, Baleshwar.
Author Contributions
Jeeban Kumar Nanda: Conceptualisation, study design, Investigation, Methodology, Writing – original draft
Swastik Behera: Data curation, Supervision, Writing – review & editing
Prafulla Chandra Rout: Writing – review & editing, Validation, Supervision
Funding
This work is not supported by any external funding.
Data Availability Statement
The data supporting the outcome of this research work have been reported in this manuscript.
Conflicts of Interest
The authors declare no conflicts of interest.
References
[1] Khan HA, Sikdar-Bar M, Kamlesh B, Wani AA, Pervaiz PA. Lead nitrate induced histopathological changes in the gills of the African Clarias batrachus. J Appl Sci Res. 2011; 7(7): 1081-1086.
[2] American Public Health Association (APHA). Standard methods for the examination of water and wastewater. 20th ed. Washington, DC: APHA; 2000. p. 1976.
[3] Chainy GBN, Mishra G, Mohanty PK. Biostatistics: theory and applications. Ludhiana: Kalyani Publishers; 2008. p. 353.
[4] Havera SP, Wood SG, Georgi MM. Blood and tissue parameters in wild mallards redosed with lead shot. Bull Environ Contam Toxicol. 1992; 49(2): 238-245.
[5] Hu H. Poorly controlled hypertension in a painter with chronic lead toxicity. Environ Health Perspect. 2001; 109(1): 95-99.
[6] Khatua AK, Rout PC, Naik BN. Lead contents in collected blood samples around Sargipalli mine area, Sundargarh, Odisha. Asian Resonance. 2015; 4(1): 108-110.
[7] Karnakar N, Saxena R. Effect of lead acetate on erythrocyte morphology in rats. Indian J Exp Biol. 1990; 28: 1084-1085.
[8] Maheswari R, Devapaul A, Muralidharan S, Velmurugan B, Ignacimuthu S. Haematological studies of freshwater fish Clarias batrachus (L.) exposed to mercuric chloride. Int J Integr Biol. 2008; 2(1): 49-54.
[9] Mohanambal R, Purvaneswari S. A study of the acute toxicity of lead nitrate [Pb(NO3)2] on the freshwater fish Catla catla (Hamilton, 1862). Int J Curr Res. 2013; 5(8): 2151-2155.
[10] Rout PC, Naik BN. Immunotoxic studies on Clarias batrachus Linn during experimental plumbism. J Appl Zool Res. 1996; 7(2): 185-186.
[11] Rout PC, Naik BN. Elevation of blood histamine and C-reactive protein during short-term lead (Pb) exposure in Clarias batrachus. J Natcon. 1998; 10(2): 169-173.
[12] Rout PC, Naik BN. Quantitative precipitation tests for anti-avidin in lead-treated Clarias batrachus Linn during experimental plumbism. J Appl Zool Res. 2000; 11(1): 48-53.
[13] Rout PC, Naik BN. Kinetics of lead and bioconcentration factor (BCF) in different tissues of Clarias batrachus during experimental plumbism. Int J Sci Res Publ. 2013; 3(8): 325-340.
[14] Sahoo RC. Studies on growth, feed efficiency and certain blood parameters in the catfish Clarias batrachus Linn fed on diets varying levels of animal proteins [thesis]. Bhubaneswar: OUAT; 1991.
[15] Sanders DH. Statistics: a fresh approach. New York: McGraw-Hill; 1994.
[16] Nehar S, Kumar C, Mishra K, Kumari M. Lead induced alteration in blood profile of air breathing catfish, Clarias batrachus Linn. Bioscan. 2010; 2(Spec issue).
[17] Talwar GP, editor. A handbook of practical immunology. New Delhi: Vikas Publishing House Ltd; 1983.
[18] World Health Organization (WHO). Principles and methods of assessing direct immunotoxicity associated with exposure to chemicals. Environmental Health Criteria 180. Geneva: WHO; 1996.
[19] Zelikoff JT, Karlson E, Li Y, Raymond A, Bealman J, Anderson M. Immunotoxicity biomarkers in fish: development, validation and application for field studies and risk assessment. Hum Ecol Risk Assess. 2002; 8(2): 253-263.
Cite This Article
  • APA Style

    Nanda, J. K., Behera, S., Rout, P. C. (2026). Relationship Between Blood Lead Level (BLL) and Haematological Parameters of People Living in and Around a Closed Lead Mine Area in Odisha, India. American Journal of Science, Engineering and Technology, 11(4), 316-322. https://doi.org/10.11648/j.ajset.20261104.19

    Copy | Download

    ACS Style

    Nanda, J. K.; Behera, S.; Rout, P. C. Relationship Between Blood Lead Level (BLL) and Haematological Parameters of People Living in and Around a Closed Lead Mine Area in Odisha, India. Am. J. Sci. Eng. Technol. 2026, 11(4), 316-322. doi: 10.11648/j.ajset.20261104.19

    Copy | Download

    AMA Style

    Nanda JK, Behera S, Rout PC. Relationship Between Blood Lead Level (BLL) and Haematological Parameters of People Living in and Around a Closed Lead Mine Area in Odisha, India. Am J Sci Eng Technol. 2026;11(4):316-322. doi: 10.11648/j.ajset.20261104.19

    Copy | Download

  • @article{10.11648/j.ajset.20261104.19,
      author = {Jeeban Kumar Nanda and Swastik Behera and Prafulla Chandra Rout},
      title = {Relationship Between Blood Lead Level (BLL) and Haematological Parameters of People Living in and Around a Closed Lead Mine Area in Odisha, India},
      journal = {American Journal of Science, Engineering and Technology},
      volume = {11},
      number = {4},
      pages = {316-322},
      doi = {10.11648/j.ajset.20261104.19},
      url = {https://doi.org/10.11648/j.ajset.20261104.19},
      eprint = {https://article.sciencepublishinggroup.com/pdf/10.11648.j.ajset.20261104.19},
      abstract = {It has been demonstrated that lead, a persistent environmental toxin, negatively impacts the immunological and hematopoietic systems. In this study, populations residing in and around a closed lead mine area in Sargipalli, Sundargarh district, Odisha, India, are examined for the relationship between haematological parameters and blood lead levels (PbB). Blood samples from individuals of all ages and genders were collected from five communities within a five-kilometre radius of the abandoned mine site. In compliance with standard protocols, blood lead concentrations were measured using Atomic Absorption Spectrophotometry (AAS). Haematological parameters examined were haemoglobin concentration, haematocrit (PCV), mean corpuscular haemoglobin (MCH), erythrocyte sedimentation rate (ESR), total red blood cell (RBC) count, total white blood cell (WBC) count, and differential leukocyte count. The majority of haematological variables and PbB levels were shown to be significantly correlated by statistical analysis. While haemoglobin concentration, MCH, and hemocrit dramatically dropped as blood lead concentration grew, total RBC and WBC counts, ESR, and cytotoxicity percentage all increased dose-dependently. Differential leukocyte analysis revealed neutropenia along with monocytosis, basophilia, and eosinophilia, indicating immunological dysregulation. The results show that long-term exposure to ambient lead significantly changes haematological profiles and impairs immune function in exposed populations. Therefore, in communities affected by mining, blood lead levels provide a trustworthy biomarker for evaluating lead-induced haematotoxicity and related health hazards.},
     year = {2026}
    }
    

    Copy | Download

  • TY  - JOUR
    T1  - Relationship Between Blood Lead Level (BLL) and Haematological Parameters of People Living in and Around a Closed Lead Mine Area in Odisha, India
    AU  - Jeeban Kumar Nanda
    AU  - Swastik Behera
    AU  - Prafulla Chandra Rout
    Y1  - 2026/10/17
    PY  - 2026
    N1  - https://doi.org/10.11648/j.ajset.20261104.19
    DO  - 10.11648/j.ajset.20261104.19
    T2  - American Journal of Science, Engineering and Technology
    JF  - American Journal of Science, Engineering and Technology
    JO  - American Journal of Science, Engineering and Technology
    SP  - 316
    EP  - 322
    PB  - Science Publishing Group
    SN  - 2578-8353
    UR  - https://doi.org/10.11648/j.ajset.20261104.19
    AB  - It has been demonstrated that lead, a persistent environmental toxin, negatively impacts the immunological and hematopoietic systems. In this study, populations residing in and around a closed lead mine area in Sargipalli, Sundargarh district, Odisha, India, are examined for the relationship between haematological parameters and blood lead levels (PbB). Blood samples from individuals of all ages and genders were collected from five communities within a five-kilometre radius of the abandoned mine site. In compliance with standard protocols, blood lead concentrations were measured using Atomic Absorption Spectrophotometry (AAS). Haematological parameters examined were haemoglobin concentration, haematocrit (PCV), mean corpuscular haemoglobin (MCH), erythrocyte sedimentation rate (ESR), total red blood cell (RBC) count, total white blood cell (WBC) count, and differential leukocyte count. The majority of haematological variables and PbB levels were shown to be significantly correlated by statistical analysis. While haemoglobin concentration, MCH, and hemocrit dramatically dropped as blood lead concentration grew, total RBC and WBC counts, ESR, and cytotoxicity percentage all increased dose-dependently. Differential leukocyte analysis revealed neutropenia along with monocytosis, basophilia, and eosinophilia, indicating immunological dysregulation. The results show that long-term exposure to ambient lead significantly changes haematological profiles and impairs immune function in exposed populations. Therefore, in communities affected by mining, blood lead levels provide a trustworthy biomarker for evaluating lead-induced haematotoxicity and related health hazards.
    VL  - 11
    IS  - 4
    ER  - 

    Copy | Download

Author Information
  • Department of Life Science, Gandhi Institute of Engineering and Technology University, Gunupur, India

    Biography: Jeeban Kumar Nanda, a passionate educator and research scholar deeply invested in the study of Environmental Biology. I hold a Master of Science degree from Sambalpur University, which laid the foundation for my lifelong interest in the natural sciences. Currently, I am pursuing my PhD at GIET University, Gunupur, where my research focuses on vital environmental concepts and ecological sustainability. Alongside my research, I have the privilege of serving as a Lecture in Zoology at Deogarh College, Deogarh. Teaching is my calling, and I take great pride in sharing my knowledge with my students, encouraging them to think critically about our environment. My ultimate goal is to continuously bridge the gap between active scientific research and impactful classroom education, contributing to both the academic community and the preservation of our natural world.

    Research Fields: Environmental Biology, Natural Sciences, Zoology

  • Department of Life Science, Gandhi Institute of Engineering and Technology University, Gunupur, India

    Biography: Swastik Behera is a distinguished academician and researcher currently serving as an Assistant Professor at GIET University, Odisha. With an extensive background in higher education and research, Dr. Behera earned his Doctorate (Ph.D.) from the prestigious Jawaharlal Nehru University (JNU), New Delhi, an institution renowned for its rigorous academic standards and research excellence.

    Research Fields: Zoology, Environmental Biotechnology, Microbiology

  • Department of Zoology, Fakir Mahon Autonomous College, Baleshwar, India

    Biography: Prafulla Chandra Rout is an esteemed academician, dedicated researcher, and recognised research guide with extensive expertise in the field of Zoology. Currently serving as an Assistant Professor in the Department of Zoology at F.M. Autonomous College in Baleshwar, Odisha, Dr. Rout combines a passion for higher education with a commitment to high-level scientific inquiry. His work bridges the gap between academic biological sciences and national public health initiatives.

    Research Fields: Zoology, Environmental Science