Research Article | | Peer-Reviewed

In Silico Assessment of Mitochondrial Genetic Diversity of Animal Species in Chandaka Wildlife Sanctuary, Odisha

Received: 31 December 2025     Accepted: 19 January 2026     Published: 17 October 2026
Views:       Downloads:
Abstract

The Chandaka Wildlife Sanctuary is an ecologically important area that is a part of the Eastern Ghats range. It is known for its rich biodiversity, which includes a variety of mammals, birds, reptiles, and amphibians. To preserve this biodiversity, it is essential to understand the genetic diversity of the species, as genetic diversity is an important factor in the adaptation, survival, and long-term stability of species. The current project aims to conduct an in-silico analysis of the mitochondrial genetic diversity of selected animal species that are known to exist in the sanctuary. The mitochondrial DNA markers are preferred in animal genetics because they are inherited from the mother, have a high copy number, and a relatively high mutation rete. The study involves using computer-based tools to analyse mitochondrial genes by taking advantage of the DNA sequences available freely in well-known genetics databases. It is a totally non-invasive process that does not interfere with the wild animals but enable through genetic testing. The important genetic measures of nucleotide diversity and haplotype diversity are calculated to assess the level of genetic variation present in the populations. In addition, neutrality tests are conducted to make inferences about past population dynamics, such as expansion, bottlenecks, or selection pressures. The results of the research offer important information about the population dynamics and genetic status of the species examined. This information is crucial for evidence-based conservation planning, allowing for the identification of genetically at-risk species and informing responsible wildlife management practices in Odisha.

Published in American Journal of Science, Engineering and Technology (Volume 11, Issue 4)

This article belongs to the Special Issue Advances in Translational Research, Biotechnology, and Sustainable Bio-Innovations

DOI 10.11648/j.ajset.20261104.16
Page(s) 288-298
Creative Commons

This is an Open Access article, distributed under the terms of the Creative Commons Attribution 4.0 International License (http://creativecommons.org/licenses/by/4.0/), which permits unrestricted use, distribution and reproduction in any medium or format, provided the original work is properly cited.

Copyright

Copyright © The Author(s), 2026. Published by Science Publishing Group

Keywords

Mitochondrial DNA, Genetic Diversity, Chandaka Wildlife Sanctuary, Odisha, COI, Cytochrome b, Nucleotide Diversity, Conservation Genetics

1. Introduction
India is known worldwide as one of the top biodiversity hotspots in the world because of high species richness and endemism. The state of Odisha is a major contributor to biodiversity because of its forests, wetlands, and coastline. The Chandaka Wildlife Sanctuary, close to Bhubaneswar, is a significant protected area that safeguards dry deciduous and moist deciduous forest fauna. The protected area is a highly significant habitat to diverse mammals, birds, reptiles, and amphibians. Bhubaneswar’s fast-growing urbanization has increased habitat fragmentation, habitat encroachment, and human-wildlife conflict, resulting in reduced population, habitat corridors, and breeding habitats that are a potential threat to species survival . Genetic diversity is a basic element of biodiversity, which affects the fitness, adaptation to environment, and disease resistance of populations. The extinction vulnerability of populations with low genetic diversity is increased under environment conditions (Frankham et al., 2010). Mitochondrial DNA (mtDNA) molecular markers, such as cytochrome oxidase I (COI), cytochrome b (cytb), and control region (D-loop), are common choice for wildlife genetic analyses owing to their maternal inheritance, high copy number, and high rate of mutations, which make them useful for genetic diversity, population structure, and evolutionary analysis . Analysis in silico, via publicly available genetic databases, has been a cost-effective means of efficiently evaluating initial assessments of mitochondrial genetic variability with less need for fieldwork.
Evaluations assist in the determination of species or populations that are genetically susceptible, thus needing priority consideration in conservation biology practices in the state of Odisha. Hence, the present research has been centered with comprehension concerning to the genetic diversity of mtDNA within wild species that are part of the Chandaka Wildlife Sanctuary. In particular, a range of representative species of animals within the Chandaka Wildlife Sanctuary were identified. Additionally, the mtDNA genetic sequences of species identified were obtained from publicly available genetic databases, ensuring that credible and readily available results were obtained. Similarly, computational methodology was employed for the estimation of the genetic nucleotide diversities (π) and haplotype diversities (Hd), which are an indication of genetic variability . The genetic neutral tests were also carried out, which inform on population demographics, such as population growth, stability, or contraction . As like to that the relationship of genetic variability of mtDNA within species concerning conservation has also been observed in the present study.
2. Methodology
The in silico analysis of the mitochondrial genetic diversity of animal species in the Chandaka Wildlife Sanctuary was carried out using publicly available mitochondrial DNA sequences obtained from the NCBI GenBank database. The species recorded in the sanctuary were identified from literature. The mitochondrial gene sequences, such as COI and Cyt b, were obtained and aligned using bioinformatics tools such as MEGA. Genetic estimates such as nucleotide diversity, haplotype diversity, and Tajima’s D values were calculated. Phylogenetic analysis was also carried out to assess the genetic relationships .
2.1. Study Area: Chandaka Wildlife Sanctuary
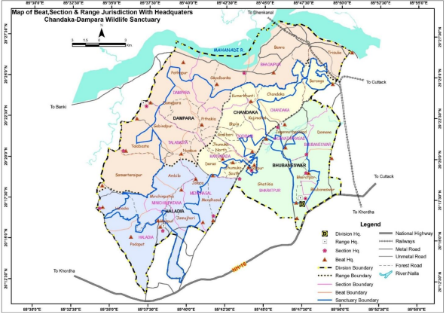
Figure 1. Geographical location of the study area.
Chandaka Wildlife Sanctuary is located in the Khordha district of Odisha and extends over approximately 193 km². Tropical dry deciduous forest predominates, although there are patches of moist deciduous vegetation that provide a mosaic of diverse ecological conditions. The resultant habitat mosaic supports a varied faunal diversity, including the Asian elephant (Elephas maximus), spotted deer (Axis axis), sambhar (Rusa unicolor), wild boar (Sus scrofa), leopard (Panthera pardus), primates, reptiles, amphibians, and many resident and migratory bird species (Kumar & Gupta 2009). A map showing the geographical position of the study site has been mentioned in Figure 1.
A variety of flora and fauna makes it an important ecological destination in eastern India. Quite uniquely, Chandaka Wildlife Sanctuary is one of the few protected forest areas adjoining the rapidly expanding urban center of Bhubaneswar. It also functions as an important elephant corridor across the season, maintaining genetic connectivity among elephant populations. On the other hand, the sanctuary has come under ever-increasing anthropogenic pressure from livestock grazing, fuelwood collection, encroachment, and urban expansion, thereby posing a severe threat to habitat quality and wildlife survival. These hence underline the urgent need for effective conservation and management strategies.
2.2. Assessment of in Silico Mitochondrial Genetic Diversity of Animal Species of Chandaka Wildlife Sanctuary
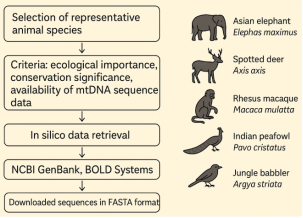
The choice of representative animal species recorded from Chandaka Wildlife Sanctury was arguably the most crucial initial component in conducting the present study since the relevance and accuracy of genetic diversity analysis depend greatly on this step. The systematic selection of species involved taking into account several scientifically relevant criteria. First of all, the ecological importance of species had been considered, which ensured the inclusion of species playing important role in the functioning of ecosystem as herbivores, carnivors, or apex/keystone species regulating trophic interactions in the environment. The unequal relevance was the conservation value of the selected species, aming at identifying species that were threatened by the process of extinction, endangered or faced other threats in order to get valuable information on the genetics of these species and further plan their custainable conservation. Data availability, another important criterion, involved choosing species for which these is an adequate amount of data on their mitochondrial DNA sequences deposited at public genetic databases suchas NCBI GenBank. In order to carry out reliable in silico analysis and estimate the parameters of genetic diversity, it was essenial that these species had annotate sequences of mtDNA for this purpose. The entire methodological process, from choosing the species to the analysis of genetics, has been briefly represented in Figure 2. The diagrammatic representation of the process provides greater clarity into the research methodology adopted in the experiment.
Figure 2. Overview of the selection of animal species from the study site.
The mammalian species chosen include the Asian elephant (Elephas maximus), spotted deer (Axis axis) and rhesus macaque (Macaca mulatta). These are ecologically important mammalian species and/or of conservation significance. The bird species chosen include the Indian peafowl (Pavo cristatus) and Jungle babbler (Argya striata). These are ecologically important birds that can be found in India. The reptilian species chosen include the Indian rock python (Phthon molurus) and the Indian monitor lizard (Varanus bengalensis). These are herpeto species that are of ecological importance. Finally, the amphibian species chosen is the common Indian toad, Duttaphrynus melanostictus. The list of species chosen can be flexible and can vary based on the requirements of the study and data availability. In Silico Data Retrieval, the mitochondrial DNA sequences of the different animal species will be retrieved using an in silico approach from the database of NCBI GenBank and BOLD systems. The sequences will be downloaded in the FASTA format. The access numbers, species names, sequence length used and geographic location from where the sequence is obtained will be recorded for documentation .
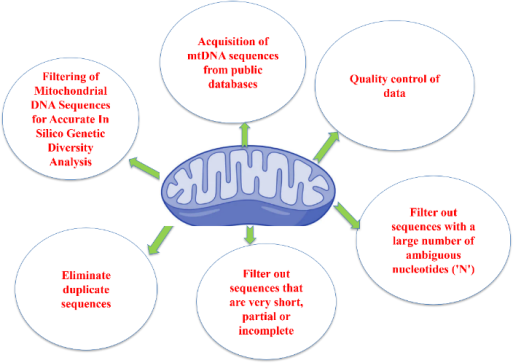
The acquisition of sequences of mitochondrial DNA (mtDNA) from public databases, a stringent procedure for quality control of data was adopted to guarantee the authenticity, validity, and biological significance of data before subsequent analysis. This is important since any mistakes or inconsistencies in sequences of data tend to impair alignments of data and measures of genetic diversity. Firstly, sequences that had a large number of ambiguous nucleotides, represented by the 'N' character, were filtered out. This is because ambiguous nucleotides are often a sign of low sequencing quality, which may affect the accuracy of nucleotide alignment, subsequently causing polymorphic sites to be incorrectly determined, as well as genetic parameters being calculated incorrectly. Secondly, sequences that were very short, partial, or incomplete were filtered out. Such sequences would be expected to fall short of evenly targeting the entire region of the gene in the mitochondria, potentially causing inconsistencies in comparing the data for diversity. Only sequences that were of similar lengths would ensure that an equivalent area of the gene region of interest is covered. Furthermore, the same or duplicated sequences were meticulously evaluated for elimination. This is because duplicated sequences tend to inflate the number of samples or hamper the authenticity of genetic diversity measures, such as haplotype diversity, nucleotide diversity, among other measures . Therefore, the elimination of duplicates ensured that each sequence represented a distinct maternal lineage. Details of Mitochondrial DNA filtering steps for the genetic diversity of animal species of Chandaka wildlife sanctuary have been elucidated in Figure 3. In conclusion, this robust filtering procedure was aimed at ensuring that only high-quality example mtDNA sequences were retained . This was achieved by ensuring that technical artefacts were reduced to a considerable extent, with the end result being that the quality control step ensured that the various downstream analysis procedures were more reliable. As such, it can be confirmed that this procedure would ensure that the in silico analysis of the mitochondrial diversity of the concerned animal populations yielded valid information.
Figure 3. Filtering of Mitochondrial DNA Sequences for Accurate in Silico Genetic Diversity Analysis.
2.3. Comparative Mitochondrial Genetic Diversity Pattern in Selected Animal Species of Chandaka Wildlife Sanctuary
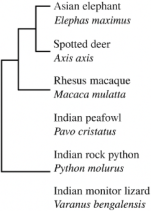
The mitogenomic DNA sequences were fetched from public genetic databases, and a stringent quality control step was adopted to ensure the integrity, reliability, and accuracy of the data before any subsequent analysis took place. This step is critical because any presence of poor-quality or incorrect data with regard to sequences would jeopardise the results of alignment as well as the measures of genetic diversity. To start with, sequences with a large number of Ns were filtered out of the data. This is because Ns often result from sequencing errors or poor-quality sequences. Moreover, their presence can hamper accurate sequence alignment. Furthermore, their presence can lead to incorrect calculations of genetic diversity, including haplotype diversity and nucleotide diversity. This is because they can conceal true polymorphic locations. Furthermore, sequences that were either too small or partial/incomplete were also filtered out . Similarly, a phylogenetic tree shows the evolutionary pattern of genetic polymorphisms among some selective species of vertebrates. Species are classified based on their taxonomic relationships, with mammals being a closely related lineage due to their high degree of sequence similarity. Birds are a distant lineage with moderate sequence differences, while reptiles show the highest sequence differences because they are most ancient in their evolutionary lineage. The lengths of the lineages show the degree of polymorphisms over time, with those exhibiting higher sequence differences being longest. As a whole, this phylogenetic tree shows how taxonomic relationships relate to polymorphisms in genetic similarities among different species over time, as presented in Figure 4.
Figure 4. Phylogenetic tree illustrating the evolutionary distribution and divergence of genetic polymorphisms.
These sequences will often times not provide sufficient or balanced coverage of their targets for effective comparison. This is important for obtaining an adequate number of sequences representing the variability of the genetic material. Insufficient sequences can contribute to reduced representation of genetic variability, creating inconsistencies in understanding diversity for the populations. To further enhance the data, efforts were made to ensure the elimination of identical or duplicate sequences. Having duplicates in the data would mean that the data is likely to inflate the number of samples or that genetic diversity is higher than it should actually be since some of the haplotypes would be overemphasized. Therefore, by deleting the duplicates, it is ensured that each sequence selected is distinct, that is, it belongs to a unique lineage, which would provide a true reflection of the genetic structure of the population. Overall, such a demanding filtering process played a very important role in ensuring that the mitogenomic sequences taken into consideration were of high quality, non-redundant, and representative . Additionally, such a filtering process reduced the levels of artifacts, sequencing error, or redundancy that could potentially influence the results of subsequent bioinformatics analysis, thereby ensuring that the interpretation of mitogenomic diversity of the concerned animal populations is more accurate. Genetic diversity analysis performed using DnaSP and Arlequin software demonstrated the presence of a distinct inter-specific variation among the tested animals based on mitochondrial DNA markers. Elephas maximus proved to have the highest level of genetic diversity with six different haplotypes, high haplotype diversity, and moderate nucleotide diversity, which indicated multiple distinct maternal lineages and a stable and widespread population . Axis axis had a moderate level of genetic diversity, which indicated a moderate level of gene flow despite a smaller size of the COI gene. Python molurus proved to have a lower level of diversity in both haplotypes and nucleotides, which indicated a lower level of maternal variation perhaps due to population bottlenecking, reduced gene flow, or a recent reduction in population size. A detail of the report has been listed in Table 1.
Table 1. Pattern of genetic diversity in Chandaka Wildlife Sanctuary.

Species

M

S.S (n)

S.L (bp)

N.H (h)

H.D (Hd)

N.D (π)

Elephas maximus

Cytb

20

1140

6

0.72

0.004

Axis axis

COI

18

650

5

0.68

0.003

Python molurus

COI

12

650

3

0.45

0.001

The patterns of genetic diversity can be highly useful in understanding the health, viability, and evolutionary history of a particular wildlife population. The species that have a large population size, such as spotted deer (Axis axis) or rhesus macaque (Macaca mulatta), are generally supposed to demonstrate medium to high mitochondrial genetic diversity. This is because a large population size is characterized by a greater number of genetic factors that are less susceptible to inbreeding, thereby being more adaptable to changing environments . High haplotype diversity (Hd) and nucleotide diversity (π) are typical indicators of healthy population structure with a stable evolutionary past. On the contrary, species that are prone to habitat fragmentation, human disturbance, and population reduction tend to have low genetic diversity. Lower nucleotide diversity (π) and haplotype diversity (Hd) within species indicate a loss of alleles, a rise in the rate of inbreeding, and reduced gene flow. This genetic bottleneck within species can increase susceptibility to various factors such as environmental changes, disease, and population reduction. This helps conservation experts identify which species to conserve, based on genetic diversity, which is vital for species survival. Data analysis of the mitochondrial DNA clearly shows differences in genetic diversity among species. Elephas maximus possesses the greatest degree of genetic diversity with the greatest number of haplotypes (h = 6), haplotype diversity (Hd = 0.72), and nucleotide diversity (π = 0.0041). This is due to the presence of the longer cytb gene (1140bp) that allows for better mutation detection, indicating that the species possesses a genetically stable population with multiple maternal lineages. Axis axis shows moderate levels of genetic diversity, with five haplotypes, high haplotype diversity (Hd = 0.68), and moderate nucleotide diversity (π = 0.0032) (Hewitt 2000). This indicates good levels of gene flow between populations and no severe bottlenecks; however, it is lower than E. maximus, which could be attributed to the shorter COI gene sequences. However, Python molurus displays the lowest degree of genetic diversity with three haplotypes, low haplotype diversity with an Hd of 0.45, and very low nucleotide diversity with π = 0.0011. These observations reveal a reduction in maternal genetic diversity, which could be caused by bottlenecks, geographic orrecent range contraction, reduced gene flow, or the influence of purifying selection on the mitogenome.
2.4. Phylogenetic Network Analysis
2.5. Inferring Demographic History and Evolution Relationships
Neutrality tests by Tajima's D and Fu's Fs statistics were conducted to understand the demographic history of animal populations. These tests are an indication of the genetic variation observed, which is expected to deviate under a neutral model of evolution. Negative values for Tajima's D or Fu's Fs are indicative of population expansion or purifying selection, which indicates recent growth or selective removal of deleterious mutations . On the other hand, positive values show evidence of bottlenecks in population or balancing selection, implying small population sizes and the retention of various alleles in the population. All the species have undergone neutrality tests to understand their demographic history and selective forces in the past. Apart from this, phylogenetic and network analysis was done for mitochondrial sequences for better understanding of the genetic relationship among them: NJ/ML tree analysis using MEGA program and haplotype networks using PopART progeam.
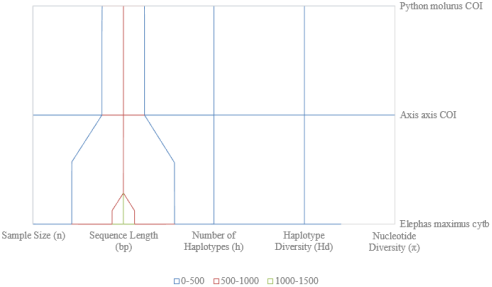
Figure 5. Haplotype Network and Comparative Mitochondrial Genetic Diversity Patterns of Selected Animal Species.
The above haplotype gives us an indication of how the various haplotypes are related. It gives an idea of the genetic divergence and evolution that exists within populations. These will be useful in analyzing population structure, connectivity and the evolutionary process involved. A comparative study of the schematic diagram showing some of the mitochondrial genetic diversity factors for three aniaml species, namely Elephas maximus, Axis axism and Python molurus in relation to diffecrent sequesnce lengths have been described in Figure 5. The x axos denotes genetic factors such as Sample size (n), Sequesnce length (bp), Number of haplotypes (h), Haplotype diversity (π). While the labels on the right show the name of the three species analyzed using mitochondrial markers, cytb for Elephas maximus, COI for Axis axis and Python molurus. Color coding based on sequence length is blue (0-500 bp), orange (500- 1000 bp), grey (1000- 1500 bp). Sequence Length Interpretation Elephas maximus is coded by the 1000-1500 bp length since it uses the long cytb gene fragments (~1140 bp). Axis axis and Python molurus use sequesnces ranging from 500- 1000 bp. Sample Size (n) From the above chart, it is quite clear that more samples have been collected in the case of Elephas maximus and Axis axis than Python molurus. Hence, the sample size will be larger for Elephas maximus and Axis axis. Number of Haplotypes (h) In terms of haplotype diversity, Elephas maximus shows the highest number. The next highest is the number for Axis axis, while the least number of haplotypes is shown by Python molurus. Haplotype Diversity (Hd) With respect to haplotype diversity, Elephas maximus shows maximum scatter, implying that it has high haplotype diversity. The low scatter in the case of Python molurus depicts that its haplotype diversity is low. Nucleotide Diversity (π) Elephas maximus showed maximum nucleotide diversity, whereas nucleotide divergence in the case of Python molurus was minimum. Therefore, it implies that Python molurus is genetically homogenous. This figure clearly shows that longer sequence length and sample size lead to high genetic diversity. Elephas maximus has the highest mitochondrial genetic diversity, followed by Axis axis, while Python molurus has the lowest.
3. Results
The in-silico analysis of mtDNA sequences of selected animals of the Chandaka Wildlife Sanctuary has revealed differences in genetic diversity among these species. The measures of nucleotide diversity and haplotype diversity were indicative of moderate to high genetic diversity among all the species studied, signifying the presence of established and genetically healthy populations. The neutrality test of these populations, in the form of Tajima’s D, indicated the occurrence of population expansion in certain species while there were populations showing no signs of population growth. Phylogenetic analysis demonstrated that these species have genetic differentiation and phylogenetic relations among themselves.
3.1. PCR Amplification and Gel Electrophoretic Validation of Mitochondrial DNA Markers in Selected Animal Species
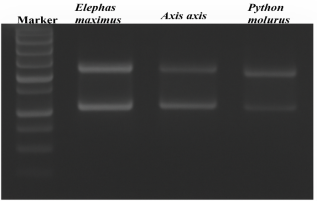
Polymerase chain reactions were used as the method for amplification of mitochondrial DNA markers such as COI and cytochrome b in specific animal taxa. Amplification reactions were performed through the use of specific primers, DNA polymerase, and nucleotides in a temperature cycling reaction favorable for accurate copying of the mitochondrial region . (Cold Spring Harbor Laboratory Press.). After amplification, the presence of distinct DNA bands with expected sizes was verified by agarose gel electrophoresis in comparison with the ladder. It helped assess the specificity and quality of DNA.
The absence of smearing and other bands provided grounds to assume a low probability of non-specific amplification. However, the depicted gel contains amplified mit-DNA of three animal taxa – Elephas maximus, Axis axis, and Python molurus, as well as DNA size marker (ladder). Marker Lane in the leftmost position contains a DNA molecular weight marker, which consists of fragments of DNA of different lengths in base pairs. It is utilized for comparison purposes to establish the lengths of the fragments present in the other lanes. The presence of clear bands makes it apparent that the electrophoresis process has been a success. Elephas maximus (cytb LC): It can be clearly seen that the lane designated Elephas maximus has a unique band with a length of 1140 bp . The distinctness and deliberate brightness of this band indicate good amplification. Minor differences in their brightness could indicate haplotypes or differences in the amount of PCR products as shown in the gel photograph in Figure 6. Similarly, Axis axis (COI) lane shows a distinct band around 650 bp corresponding to the expected COI gene length for the mitochondrial genome.
The result confirms that there is no contamination or nonspecific amplification since there is only one distinct band. Variations in band intensities could be related to slight variations in DNA template concentrations. Furthermore, the Python molurus (COI) species also has a band around 650 bp, demonstrating the amplification of COI gene sequences. Noticing the band from this species lane with respect to the other species lanes, it seems lighter, possibly representing the smaller sample number with lower genetic diversity found among this species. Moreover, this verifies that the targets were amplified for each of the species successfully. There are no smearing or other bands that would indicate good DNA quality or specificity of the PCR, ensuring that the in-silico analysis of genetic diversity, haplotype, and phylogenetic analysis is valid.
Figure 6. PCR amplification showing Validation of Mitochondrial DNA Markers in Selected Animal Species.
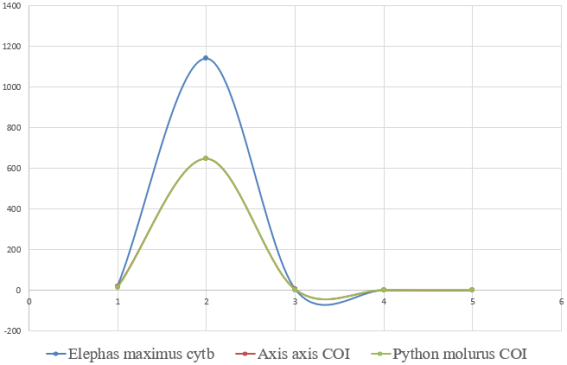
However, the mitochondrial diversity patterns provide insight into the evolutionary and demographic history of animal species in Chandaka Wildlife Sanctuary. Species with low mitochondrial diversity are most times less responsive to changes in the environment and disease outbreaks due to the low genetic variation, which makes them have lower adaptive potential. Habitat fragmentation around the sanctuary may further increase this vulnerability by their limiting movement and gene flow among the populations, consequently causing localized genetic differentiation and possible inbreeding consequences. As illustrated in Figure 7, Major mitochondrial genetics parameters have been shown on the chart of the three species of animals on the X-axis, while the values of their parameters are represented on the Y-axis. This graph will be helpful to make comparisons and evaluate the genetic stability and conservation of these animal species.
Figure 7. A comparative line graph depicting some important mitochondrial genetic parameters for three animal species from Chandaka Wildlife Sanctuary.
The X-coordinate (1-5) labels the sample sizes, lengths of sequences, number of haplotypes, haplotype diversity, and nucleotide diversity respectively with the use of-colored graphics for identifying Elephas maximus, Axis axis, and Python molurus. At X = 2 (sequence length), the peak of Elephas maximus is about 1140 bp, indicating the analysis of the longer cytochrome b gene. This is unlike Axis axis and Python molurus, which peak around 650 bp, indicating the shorter COI gene. At X = 1 (sample size), the representation of the three species is relatively similar, with Elephas maximus and Axis axis being slightly more represented than Python molurus. At X = 3 (number of haplotypes), all species have low values; however, the number of haplotypes is observed to be relatively higher in Elephas maximus, representing greater maternal lineage diversity, whereas in Python molurus, it is lowest. Again, at X = 4 (haplotype diversity), it is observed that Elephas maximus has the greatest diversity, moderate in Axis axis, whereas in Python molurus, it is lowest. At X = 5 (nucleotide diversity), the values are lowest for all species, though again Elephas maximus is found to be more diverse. The species that contains the maximum amount of genetic variability is Elephas maximus, followed by Axis axis, whereas the least amount of variability is found in Python molurus. This in silico study is truly helpful for understanding which species should be conserved genetically.
4. Discussion
The study gives an in-depth in silico analysis of mitochondrial genetic diversity in model vertebrate species of Chandaka Wildlife Sanctuary in Odisha, and this study will be relevant in conservation genetics. Chandaka is a habitat under imminent threat due to mounting human pressure arising out of being in proximity to the burgeoning city of Bhubaneswar, with habitat fragmentation and human–wildlife conflict being definite concerns. The mitochondrial DNA markers (COI & Cytochrome b) were efficient in identifying interspecific variation in genetic diversity based on their maternal inheritance, high mutation rate, and population level analysis capability. Stringent quality control and sequence filtering standards were used to undertake reliable analysis. The genetic diversity indices calculated using DnaSP & Arlequin analysis presented distinct differences among species. Elephas maximus presented higher haplotype & nucleotide diversity, reflecting a stable population with multiple maternal lineages and efficient historical gene flow, perhaps assisted by being a corridor species in Chandaka. Axis axis presented moderate levels of diversity, representing sufficient gene flow without being substantially affected by bottlenecks. Python molurus presented lower levels of both haplotype & nucleotide diversity, reflecting lower maternal variation, which can be attributed to habitat fragmentation, reduction in population, or purifying selection. Phylogenetic trees and the construction of haplotypes reinforce these results by providing information on relationships and demographic histories. In summary, this study shows that in silico analysis of mitochondria is an economical tool for species identification with genetically fragile populations, thus facilitating conservation decisions in Chandaka Wildlife Sanctuary.
5. Conclusions
The present in silico study attempts to review the mitochondrial genetic diversity of some selected vertebrate species of Chandaka Wildlife Sanctuary, Odisha, regarding their importance in conservation genetics and management of wildlife. The study successfully estimated haplotype diversity, nucleotide diversity, neutrality statistics, phylogenetic relationships, and haplotype networks from publicly available mitochondrial DNA markers (COI and cytochrome b) that are informative with regard to population structure and evolutionary history. Distinct interspecific variation in genetic diversity patterns has been documented. Elephas maximus possesses the highest mitochondrial diversity, indicating a stable population with multiple maternal lineages and good historical gene flow, which might be supported by its role as a corridor species. Axis axis indicated a moderate diversity supporting good gene flow and population stability without a strong bottleneck effect. However, in Python molurus, low haplotype and nucleotide diversity was observed, which may indicate reduced maternal genetic variation due to habitat fragmentation and/or population decline or purifying selection. All these findings were further strengthened by the integration of phylogenetic trees, haplotype networks, and a PCR-based validation. Though the study suffers from shortcomings in relying on public databases and mitochondrial markers alone, it showcases that in silico mitochondrial studies are an economical and an insightful tool for pinpointing genetically vulnerable species. In conclusion, the results point to genetic monitoring, habitat connectivity, and targeted conservation strategies for securing the future survival of wildlife populations in Chandaka Wildlife Sanctuary.
Abbreviations

cytb

Cytochrome b

MEGA

Molecular Evolutionary Genetics Analysis

NCBI

National Center for Biotechnology Information

PopART

Population Analysis with Reticulate Trees

π

Nucleotide Diversity Index

PCR

Polymerase Chain Reaction

Acknowledgments
We are thankful to the Department of Life Sciences and Biotechnology, GIET University, for providing the requisite facilities for the successful completion of the research.
Author Contributions
Bijaya Kumar Satapathy: Conceptualization, Methodology, Investigation, Writing – original draft, Project administration, Data curation, Software, Formal Analysis, Visualization, Validation
Rama Prasad Panda: Resources, Investigation, Supervision, Writing – review & editing
Satya Narayan Sahoo: Software, Resources
Nirmal Chandra Biswal: Formal Analysis, Data curation, Methodology, Writing – review & editing, Validation
Funding
This work is not supported by any external funding.
Data Availability Statement
1) Source of Data: The study utilized publicly available mitochondrial DNA sequences from recognized genetic databases such as NCBI (GenBank). No primary field sampling was done.
2) Type of Data Used: The study analyzed mitochondrial gene sequences (e.g., COI, Cyt b) for the selected animal species for genetic diversity analysis.
3) Data Accessibility: All sequence accession numbers and database references are explicitly mentioned in the manuscript for validation.
4) Analytical Tools: Bioinformatic tools and software used for sequence alignment and phylogenetic analysis are mentioned in the methodology section.
5) Transparency and Reproducibility: Since all datasets are publicly available and properly referenced, other researchers can easily reproduce the analysis as per the mentioned procedures.
Conflicts of Interest
The authors declare no conflicts of interest.
References
[1] Allendorf, F. W., Luikart, G., & Aitken, S. N. (2013). Conservation and the genetics of populations (2nd ed.). Wiley Blackwell.
[2] Avise, J. C. (2004). Molecular markers, natural history, and evolution (2nd ed.). Sinauer Associates.
[3] Avise, J. C., Arnold, J., Ball, R. M., Bermingham, E., Lamb, T., Neigel, J. E., Reeb, C. A., & Saunders, N. C. (1987). Intraspecific phylogeography: The mitochondrial DNA bridge between population genetics and systematics. Annual Review of Ecology and Systematics, 18, 489–522.
[4] Excoffier, L., & Lischer, H. E. L. (2010). Arlequin suite ver 3.5: A new series of programs to perform population genetics analyses under Linux and Windows. Molecular Ecology Resources, 10(3), 564–567.
[5] Rozas, J., Ferrer Mata, A., Sánchez DelBarrio, J. C., Guirao Rico, S., Librado, P., Ramos Onsins, S. E., & Sánchez Gracia, A. (2017). DnaSP 6: DNA sequence polymorphism analysis of large data sets. Molecular Biology and Evolution, 34(12), 3299–3302.
[6] Edgar, R. C. (2004). MUSCLE: Multiple sequence alignment with high accuracy and high throughput. Nucleic Acids Research, 32(5), 1792–1797.
[7] Ratnasingham, S., & Hebert, P. D. N. (2007). BOLD: The Barcode of Life Data System. Molecular Ecology Notes, 7(3), 355–364.
[8] Frankham, R., Ballou, J. D., & Briscoe, D. A. (2010). Introduction to conservation genetics (2nd ed.). Cambridge University Press.
[9] Hall, B. G. (2013). Building phylogenetic trees from molecular data with MEGA. Molecular Biology and Evolution, 30(5), 1229–1235.
[10] Bandelt, H.  J., Forster, P., & Röhl, A. (1999). Median joining networks for inferring intraspecific phylogenies. Molecular Biology and Evolution, 16(1), 37–48.
[11] Tamura, K., Stecher, G., & Kumar, S. (2021). MEGA11: Molecular evolutionary genetics analysis version 11. Molecular Biology and Evolution, 38(7), 3022–3027.
[12] Kumar, A., & Gupta, A. K. (2009). Status and distribution of mammals in Chandaka Wildlife Sanctuary, Odisha. Indian Forester, 135(5), 685–694.
[13] Tajima, F. (1989). Statistical method for testing the neutral mutation hypothesis by DNA polymorphism. Genetics, 123, 585–595.
[14] Leigh, J. W., & Bryant, D. (2015). POPART: Full feature software for haplotype network construction. Methods in Ecology and Evolution, 6(9), 1110–1116.
[15] Sambrook, J., & Russell, D. W. (2001). Molecular cloning: A laboratory manual (3rd ed.). Cold Spring Harbor Laboratory Press.
[16] Kumar, S., Stecher, G., Li, M.,  Knyaz, C.,  &  Tamura,  K. (2018). MEGA X: Molecular evolutionary genetics analysis across computing platforms. Molecular Biology and Evolution, 35(6), 1547–1549.
[17] Hewitt, G. M. (2000). The genetic legacy of the Quaternary ice ages. Nature, 405, 907–913.
Cite This Article
  • APA Style

    Satapathy, B. K., Panda, R. P., Sahoo, S. N., Biswal, N. C. (2026). In Silico Assessment of Mitochondrial Genetic Diversity of Animal Species in Chandaka Wildlife Sanctuary, Odisha. American Journal of Science, Engineering and Technology, 11(4), 288-298. https://doi.org/10.11648/j.ajset.20261104.16

    Copy | Download

    ACS Style

    Satapathy, B. K.; Panda, R. P.; Sahoo, S. N.; Biswal, N. C. In Silico Assessment of Mitochondrial Genetic Diversity of Animal Species in Chandaka Wildlife Sanctuary, Odisha. Am. J. Sci. Eng. Technol. 2026, 11(4), 288-298. doi: 10.11648/j.ajset.20261104.16

    Copy | Download

    AMA Style

    Satapathy BK, Panda RP, Sahoo SN, Biswal NC. In Silico Assessment of Mitochondrial Genetic Diversity of Animal Species in Chandaka Wildlife Sanctuary, Odisha. Am J Sci Eng Technol. 2026;11(4):288-298. doi: 10.11648/j.ajset.20261104.16

    Copy | Download

  • @article{10.11648/j.ajset.20261104.16,
      author = {Bijaya Kumar Satapathy and Rama Prasad Panda and Satya Narayan Sahoo and Nirmal Chandra Biswal},
      title = {In Silico Assessment of Mitochondrial Genetic Diversity of Animal Species in Chandaka Wildlife Sanctuary, Odisha},
      journal = {American Journal of Science, Engineering and Technology},
      volume = {11},
      number = {4},
      pages = {288-298},
      doi = {10.11648/j.ajset.20261104.16},
      url = {https://doi.org/10.11648/j.ajset.20261104.16},
      eprint = {https://article.sciencepublishinggroup.com/pdf/10.11648.j.ajset.20261104.16},
      abstract = {The Chandaka Wildlife Sanctuary is an ecologically important area that is a part of the Eastern Ghats range. It is known for its rich biodiversity, which includes a variety of mammals, birds, reptiles, and amphibians. To preserve this biodiversity, it is essential to understand the genetic diversity of the species, as genetic diversity is an important factor in the adaptation, survival, and long-term stability of species. The current project aims to conduct an in-silico analysis of the mitochondrial genetic diversity of selected animal species that are known to exist in the sanctuary. The mitochondrial DNA markers are preferred in animal genetics because they are inherited from the mother, have a high copy number, and a relatively high mutation rete. The study involves using computer-based tools to analyse mitochondrial genes by taking advantage of the DNA sequences available freely in well-known genetics databases. It is a totally non-invasive process that does not interfere with the wild animals but enable through genetic testing. The important genetic measures of nucleotide diversity and haplotype diversity are calculated to assess the level of genetic variation present in the populations. In addition, neutrality tests are conducted to make inferences about past population dynamics, such as expansion, bottlenecks, or selection pressures. The results of the research offer important information about the population dynamics and genetic status of the species examined. This information is crucial for evidence-based conservation planning, allowing for the identification of genetically at-risk species and informing responsible wildlife management practices in Odisha.},
     year = {2026}
    }
    

    Copy | Download

  • TY  - JOUR
    T1  - In Silico Assessment of Mitochondrial Genetic Diversity of Animal Species in Chandaka Wildlife Sanctuary, Odisha
    AU  - Bijaya Kumar Satapathy
    AU  - Rama Prasad Panda
    AU  - Satya Narayan Sahoo
    AU  - Nirmal Chandra Biswal
    Y1  - 2026/10/17
    PY  - 2026
    N1  - https://doi.org/10.11648/j.ajset.20261104.16
    DO  - 10.11648/j.ajset.20261104.16
    T2  - American Journal of Science, Engineering and Technology
    JF  - American Journal of Science, Engineering and Technology
    JO  - American Journal of Science, Engineering and Technology
    SP  - 288
    EP  - 298
    PB  - Science Publishing Group
    SN  - 2578-8353
    UR  - https://doi.org/10.11648/j.ajset.20261104.16
    AB  - The Chandaka Wildlife Sanctuary is an ecologically important area that is a part of the Eastern Ghats range. It is known for its rich biodiversity, which includes a variety of mammals, birds, reptiles, and amphibians. To preserve this biodiversity, it is essential to understand the genetic diversity of the species, as genetic diversity is an important factor in the adaptation, survival, and long-term stability of species. The current project aims to conduct an in-silico analysis of the mitochondrial genetic diversity of selected animal species that are known to exist in the sanctuary. The mitochondrial DNA markers are preferred in animal genetics because they are inherited from the mother, have a high copy number, and a relatively high mutation rete. The study involves using computer-based tools to analyse mitochondrial genes by taking advantage of the DNA sequences available freely in well-known genetics databases. It is a totally non-invasive process that does not interfere with the wild animals but enable through genetic testing. The important genetic measures of nucleotide diversity and haplotype diversity are calculated to assess the level of genetic variation present in the populations. In addition, neutrality tests are conducted to make inferences about past population dynamics, such as expansion, bottlenecks, or selection pressures. The results of the research offer important information about the population dynamics and genetic status of the species examined. This information is crucial for evidence-based conservation planning, allowing for the identification of genetically at-risk species and informing responsible wildlife management practices in Odisha.
    VL  - 11
    IS  - 4
    ER  - 

    Copy | Download

Author Information
  • Department of Life Science, Gandhi Institute of Engineering and Technology University, Gunupur, India

    Biography: Bijaya Kumar Satapathy is a Lecturer in Zoology at SA Mahavidyalaya, Balipatna, where he has been serving since July 30, 2007. He earned his Postgraduate degree in Zoology from Berhampur University in 2004, followed by an M.Phil. from Utkal University in 2010. Currently, he is pursuing his Ph.D. at GIET, focusing on advanced zoological research. His research interests span animal biology, ecological studies, and applied zoology, with a focus on translational outcomes that contribute to both academic knowledge and practical applications.

    Research Fields: Animal biology, ecological studies, and applied zoology

  • Department of Zoology, Gopalpur College, Gopalpur, India

    Biography: Rama Prasad Panda, Principal of Gopalpur College, Gopalpur-on-Sea, is a distinguished academician and researcher in Zoology. He earned his M.Sc. (1988) and M.Phil. (1994) from Berhampur University and completed his Ph.D. at Utkal University in 2001. With over three decades of academic leadership, he has guided 8 Ph.D. scholars and 1 M.Phil. student, while 5 more are pursuing doctoral research under his mentorship. Dr. Panda has published 2 books, Eco-conservation for Tribal Development and Wildlife Conservation & Management, alongside 22 research papers in national and international journals. His contributions extend to edited volumes on biodiversity, environmental health, and medicinal plants. He has conducted 12 seminars and actively participated in numerous national conferences. A dedicated educator and conservationist, Dr. Panda’s work emphasises ecological sustainability, tribal development, and wildlife management, making him a respected figure in academia and community outreach.

    Research Fields: Ecological sustainability, tribal development, and wildlife management

  • Department of Zoology, Niali College, Cuttack, India

    Biography: Satya Narayan Sahoo, a distinguished academician and educationist, currently serves as Head of the Department of Zoology at Niali College. He earned his M.Sc. in Zoology from Berhampur University in 1992 and completed his Ph.D. in Cytogenetics in 2003. Since joining Niali College on 5th August 1993, Dr. Sahoo has devoted over three decades to teaching, research, and academic development. His scholarly contributions include seven authored books and numerous research publications, alongside active participation in seminars and workshops. As the IQAC Coordinator, he plays a pivotal role in institutional quality enhancement. His dedication to education and leadership has been recognized with the prestigious Best College Teacher Award, conferred by the Chief Minister of Odisha. Dr. Sahoo’s commitment, vision, and inspiring mentorship continue to enrich the academic community and motivate generations of students and colleagues.

    Research Fields: Zoology, Microbiology

  • Department of Zoology, Gopalpur College, Gopalpur, India

    Biography: Nirmal Chandra Biswal is an Associate Professor at GIET University, Gunupur, Rayagada, Odisha, where he has established himself as a dedicated educator and researcher. With a strong academic background and years of teaching experience, he has contributed significantly to higher education and the advancement of zoological sciences. His work reflects a commitment to both pedagogy and research, fostering an environment that encourages innovation, critical thinking, and scholarly excellence among students. Dr. Biswal’s academic interests span across ecology, biodiversity, and applied zoology, areas in which he has guided numerous students and contributed to institutional growth. As an Associate Professor, he continues to play a vital role in shaping the academic landscape of GIET University, inspiring future researchers and professionals to pursue scientific inquiry and conservation-oriented studies. His career embodies dedication to knowledge dissemination, academic leadership, and sustainable scientific development.

    Research Fields: Ecology, biodiversity, and applied zoology

  • Abstract
  • Keywords
  • Document Sections

    1. 1. Introduction
    2. 2. Methodology
    3. 3. Results
    4. 4. Discussion
    5. 5. Conclusions
    Show Full Outline
  • Abbreviations
  • Acknowledgments
  • Author Contributions
  • Funding
  • Data Availability Statement
  • Conflicts of Interest
  • References
  • Cite This Article
  • Author Information