Research Article | | Peer-Reviewed

In Silico Analysis of Nucleotide Diversity of Fish Species in the Daya River

Received: 31 December 2025     Accepted: 19 January 2026     Published: 17 October 2026
Views:       Downloads:
Abstract

The current study was designed to assess the nucleotide diversity and genetic structure of selected fish species in the Daya River using an in-silico approach. Genetic diversity is an important measure of population stability, adaptability, and survival, especially in freshwater habitats that are now under increasing human impacts. The nucleotide sequences of the most frequently documented fish species were obtained from the GenBank database, with a primary emphasis on mitochondrial gene segments. Following quality analysis and multiple sequence alignment, major genetic diversity measures such as nucleotide diversity (π), haplotype diversity (Hd), number of segregating sites (S), and average nucleotide differences were calculated using bioinformatics software packages such as DnaSP and MEGA. Neutrality tests, such as Tajima’s D and Fu’s Fs, were conducted to reconstruct the demographic history of the species. Phylogenetic trees and haplotype networks were also generated to examine the genetic relationships and differentiation of the lineages among the species. The data showed that the species had different levels of nucleotide diversity, where some species had moderate to high genetic diversity, while others had lower genetic diversity, which could be a result of habitat fragmentation and population reduction. The results emphasize the significance of molecular analysis in the identification of genetically susceptible populations and form a scientific basis for conservation and sustainable fishing resource management in the Daya River. The current research proves the efficiency of computational genetic analysis as a cost-effective alternative to Ichthyogenetics in fresh water fish genetic diversity of Daya River.

Published in American Journal of Science, Engineering and Technology (Volume 11, Issue 4)

This article belongs to the Special Issue Advances in Translational Research, Biotechnology, and Sustainable Bio-Innovations

DOI 10.11648/j.ajset.20261104.12
Page(s) 252-262
Creative Commons

This is an Open Access article, distributed under the terms of the Creative Commons Attribution 4.0 International License (http://creativecommons.org/licenses/by/4.0/), which permits unrestricted use, distribution and reproduction in any medium or format, provided the original work is properly cited.

Copyright

Copyright © The Author(s), 2026. Published by Science Publishing Group

Keywords

In Silico, Nucleotide Diversity, Daya River, Mitochondrial DNA, Population Genetics, Tajima's D, Haplotype Network

1. Introduction
The Daya River is an ecologically important freshwater system that supports a rich diversity of fish species, each playing a specific role in maintaining food webs, nutrient cycling, and overall ecosystem stability . Freshwater fish contribute to ecosystem functioning by regulating trophic interactions and recycling nutrients, making their conservation ecologically significant . Assessment of genetic diversity within these fish populations is important due to their bearing on the potential of such populations to cope with environmental stressors resulting from pollution, habitat alteration, climatic variability, and overexploitation . Generally, populations with high genetic diversity exhibit stronger evolutionary potential and are more resilient, thus enabling their long-term persistence under changing environmental conditions . Conversely, low genetic diversity increases extinction risk due to reduced ability to adapt and increased vulnerability to diseases and disturbances in the environment . Genetic diversity analysis also provides information on the demographic history of populations. Patterns in DNA variation can indicate past population expansions, bottlenecks, or extended periods of isolation. In addition, quantifying gene flow between populations over various river reaches informs about connectivity and dispersal potential, impacts of natural or anthropogenic barriers such as dams and pollution gradients. The knowledge generated is important for conservation planning at the river basin–level and sustainable fisheries management. Nucleotide diversity, π, is a widely applied molecular index that quantifies genetic variation at the nucleotide level . It refers to the average number of nucleotide differences per site between two randomly chosen DNA sequences from the same population . A high nucleotide diversity would reflect a more substantial amount of genetic variation and in most cases represents large stable populations, while a low π may be indicative of recent population decline, inbreeding, founder effects, or habitat fragmentation . As such, an in-silico approach to the estimation of nucleotide diversity offers a cost-effective alternative to extensive field and laboratory studies. DNA sequences of target fish species can be retrieved from public databases like GenBank, followed by quality control and multiple sequence alignment to ensure an accurate comparison of homologous regions. Using appropriate bioinformatics tools, the following calculations could be made: nucleotide diversity, haplotype diversity, and the number of segregating sites. Neutrality tests such as Tajima's D and Fu's Fs add to mismatch distribution analysis in inferring population expansion, contraction, or selection pressures . Haplotype networks and phylogenetic trees visually portray genetic relationships among individuals and populations. Ecological and conservation interpretations of such results will enable the identification of the most vulnerable fish populations in the Daya River and provide evidence-based management and conservation.
2. Methodology
In silico analysis was employed to determine the nucleotide diversity of target fish species in the Daya River. The nucleotide sequences of the mitochondrial gene regions were obtained from the GenBank database. The sequences were checked for quality, trimmed, and aligned using the MUSCLE alignment tool in MEGA. Genetic diversity measures, such as nucleotide diversity (π), haplotype diversity, number of segregating sites, and average nucleotide differences, were calculated using DnaSP software. Neutrality tests, including Tajima’s D and Fu’s Fs, were conducted to interpret the demographic history of the species. Phylogenetic trees and haplotype networks were also generated to examine genetic relationships.
2.1. Study Area and Species Selection
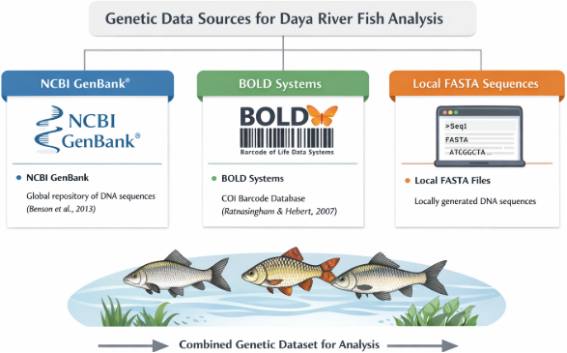
The current study was conducted on selected fish species that have been recorded in the Daya River, Odisha, India. The species were selected based on the availability of mitochondrial or nuclear gene sequences in public databases and their ecological significance in the riverine ecosystem. The genetic analysis of fish populations from the Daya River relies on well-established molecular databases and bioinformatics tools. DNA sequence data are primarily retrieved from NCBI GenBank, a comprehensive public repository that provides access to nucleotide sequences submitted worldwide and supports large-scale comparative genetic studies . When available, BOLD Systems (Barcode of Life Data System) is used to obtain standardized mitochondrial COI barcode sequences, which are widely applied for species identification and population-level genetic analysis as mentioned in Figure 1, . In addition, locally generated DNA sequences stored in FASTA format can be incorporated to enhance dataset completeness.
Multiple sequence alignment is a critical step and is performed using tools such as MAFFT, MUSCLE, or Clustal Omega, which accurately align homologous nucleotide regions and minimize alignment errors. MEGA software is used to verify alignments and construct phylogenetic trees using distance-based or likelihood methods . Genetic diversity indices, including nucleotide diversity (π), haplotype diversity, and neutrality tests such as Tajima’s D, are calculated using DnaSP, a specialized software for DNA polymorphism analysis . Arlequin is employed for population structure analyses such as FST and AMOVA . Haplotype networks are visualized using PopART, while BioPython and R packages (ape, pegas, adegenet) support custom analyses and graphical representation of genetic data .
Figure 1. Sources of Fish DNA sequence data used for genetic analysis for the Daya River.
2.2. Selection of Genetic Markers for In-Silico Analysis of the Fish Population of the Daya River
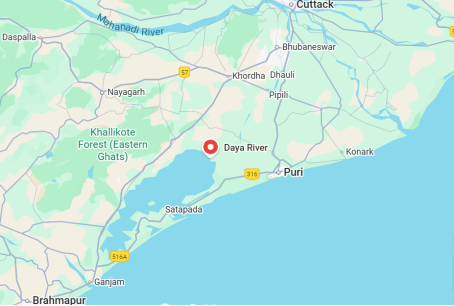
The research design is concerned with the choice of focal species of fish that are native to the Daya River and have inherent value in the freshwater biotic ecosystem. Daya River, a distributary of the Kuakhai River, originates near Saradeipur of Khurdha district in Odisha and runs southwest for about 37 km before emptying into the Chilika Lake Asia's biggest brackish water lagoon and an international Ramsar site . The river has an important ecological function in serving as a natural connection linking the freshwater systems of the Mahanadi delta to the coastal lagoon ecosystem. With this connection, the Daya River provides for nutrient passage, organic material, and sediments to allow for the productivity and ecological well-being of riverine and estuarine systems (Figure 2).
Figure 2. Map showing Geographic location of Daya River and the surrounding study area, Odisha, India.
Species of the Cyprinidae family, as well as the most frequently recorded species in rivers, are mostly preferred due to their abundance and availability of genetic information. However, in cases where in situ collection is difficult, the in silico design is adopted. Here, the choice falls on two to four species that are abundantly recorded in publicly accessible sequence repositories such as the National Center for Biotechnology Information GenBank or Barcode of Life Data System. The choice of species with an abundance of publicly accessible sequences enables the results to attain statistical validity. The size of the sample is also a key consideration in genetic research, as a small dataset may give rise to biased or unreliable estimations. The more sequences there are, the better the estimation of nucleotide diversity, haplotype diversity, and demographic data can be. Hence, the choice of species should be guided by the quality of its sequence data. The choice of relevant genetic markers is also a critical component of study design. Mitochondrial DNA markers have been extensively employed in population genetic analysis because of their maternal inheritance, lack of recombination, and higher mutation rate, which increase their sensitivity to recent evolutionary processes. The cytochrome oxidase I (COI) gene has been used popularly in species-level identification and DNA barcoding, which allows for reliable species identification. By contrast, cytochrome b (cytb) and NADH dehydrogenase subunit 2 (ND2) genes possess higher resolution to identify genetic variation at a population level in fish .
2.3. Sequence Retrieval and Data Organization for in-Silico Genetic Analysis of Daya River
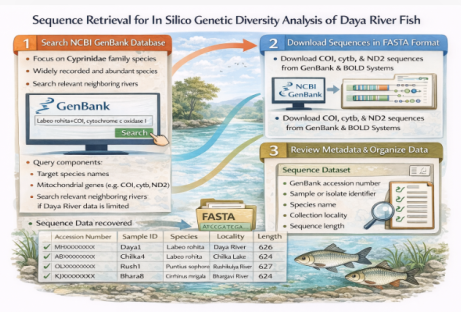
The recovery of sequences is a critical initial step in any in silico genetic diversity study, as all further analyses depend directly on the quality and relevance of these sequence data. Sequence data for the target fish species selected and the mitochondrial gene are recovered from the NCBI GenBank database by using specific search queries like genus and species. This search strategy ensures that only the relevant sequence belonging to the target species and target gene region will be recovered. All the selected sequences will be downloaded in FASTA format, universally compatible with most bioinformatics software used for alignment and genetic analysis. It also looks at accompanying metadata carefully, especially information on sampling locality . The sequences of the Daya River are preferred in order to make sure that samples would be geographically relevant. If available sequences from the Daya River alone are less or none, sequences from neighboring river systems or proximate geographic regions are added in order to increase sample size. Such inclusions, however, will be cautious, with limitations on population mixing, geographic structure, and reduced resolution that will be clearly acknowledged in the analysis and discussion. A spreadsheet is maintained to keep track, for reproducibility and transparency purposes, of all the retrieved sequences. The dataset includes: GenBank accession number, sample or isolate identifier, species name, collection locality, and sequence length. Proper documentation enables data management, traceability, and supports results on genetic diversity and population structure in later stages of analysis has been demonstrated in Figure 3, which shows how mtDNA sequences are retrieved step by step for Daya River fishes from NCBI's GenBank. Searches are conducted based on species and gene names, sequences are retrieved in FASTA format, data are screened for geographical appropriateness, and details are recorded. There is documentation of all details so that high-quality information is obtained.
Figure 3. Workflow Representing the Sequential Retrieval and Data Organisation in In-silico Genetic Diversity Analysis of Daya River.
The mtDNA sequences are retrieved step by step for Daya River fishes from NCBI's GenBank. Searches are conducted based on species and gene names, sequences are retrieved in FASTA format, data are screened for geographical appropriateness, and details are recorded. There is documentation of all details so that high-quality information is obtained.
2.4. Sequence Quality Control and Distribution of Nucleotide Sequences
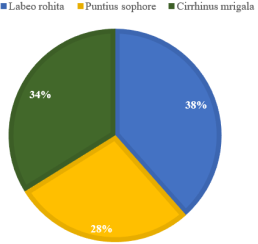
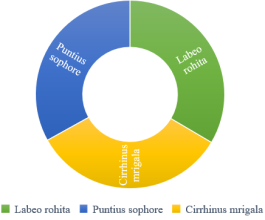
The quality control of sequence data is a very important procedure in making in silico genetic analysis credible and accurate. The very first step is the removal of duplicate GenBank accessions. These may be generated in case the same sequence has been submitted more than once or in different studies. The obviously incorrect identifications of species or gene-level sequences are also eliminated. In sequence alignment for estimation of genetic diversity parameters like nucleotide diversity, short sequences or those with a large proportion of ambiguous nucleotides coded by “N” are filtered out. However, Figure 4 summarizes the distribution of analyzed DNA sequences of three different freshwater fish species found in the Daya River . A large percentage of the DNA samples is from Puntius sophore (38%), suggesting increased representation in the database and the possibility of easy access to sampling. A total of 34% of the DNA samples belong to the species Labeo rohita, suggesting increased representation to facilitate genetic studies. On the other hand, the remaining 28% is from the species Cirrhinus mrigala, suggesting low representation. In general, a large proportion of ambiguous nucleotides in sequences leads to misalignments with poor estimation of genetic diversity parameters. With standardized sequence size and bases of high quality, inter-sample sequence comparison becomes more accurate. Lastly, any non-biological part, for example, primers and adaptors, is trimmed if it is present in the sequences. Non-biological parts could influence how analyses and alignments are performed.
Figure 4. Proportional Distribution of No of DNA Sequences among selected Freshwater species of the Daya River.
Trimming occurs through bioinformatics software such as Geneious, MEGA, or scripts, and this leads to pure homologous sequences for proper analyses on genetic diversity and populations.
2.5. Multiple Sequence Alignment and DNA Banding Pattern of Fish Species
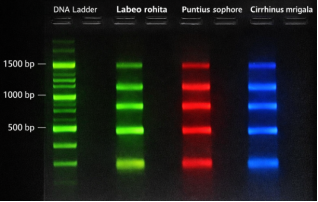
Multiple sequence alignment was an important step in the genetic analysis of fish populations collected from the Daya River to ensure that homologous mitochondrial DNA regions of different species (Labeo rohita, Puntius sophore, and Cirrhinus mrigala) are compared accurately. First, selected mitochondrial genes-cytochrome b, COI, or ND2-are retrieved from GenBank. Corresponding nucleotide sequences are aligned using good-quality alignment programs such as MAFFT. The DNA ladder has pieces of known sizes, such as 500 bp, 1000 bp, or 1500 bp. It is used as a molecular weight marker to determine approximate fragment sizes in the PCR-generated DNA samples. Labeo rohita (green-colored bands) are the PCR amplified DNA fragments that are specific to Labeo rohita. Multiple bands showed amplification of specific gene regions (usually mitochondrially encoded, such as those coding for COI, 16S rRNA, or cyt b) . Distances of bands from the ladder indicate approximate sizes from 500 bp to 1500 bp. Puntius sophore (red bands indicate the PCR products from the DNA.
Figure 5. PCR-based DNA banding analysis of selected freshwater fish Species of the Daya River.
The variation in the number of bands and the distance of migration with regard to Labeo rohita suggests the existence of genetic differences among species. This proves the species-specific amplification. This is useful in molecular identification. Cirrhinus mrigala (Blue bands represent PCR-amplified DNA fragments in Cirrhinus mrigala. It can be differentiated from the other two species because of its characteristic band size and position. Sharp bands mean good PCR and good DNA quality . The significance of color coding is used for visualization only and not for actual DNA colors. These are useful in the process of comparing PCR profile images across various species within a single combined image. These are useful in the overall interpretation of each species a characteristic pattern of bands, and this can be used to Successful PCR amplification, Genetic differences among species. This method is used in identification of species biodiversity, of fish taxonomy.
3. Results
In silico analysis showed varying levels of nucleotide diversity (π) in selected fish species of the Daya River. While some species had moderate to high π and haplotype diversity, others had low nucleotide diversity and fewer segregating sites. Neutrality tests (Tajima’s D and Fu’s Fs) showed evidence of recent population expansion in some species, while others had signs of demographic stability. Phylogenetic trees and haplotype networks showed strong genetic structuring, with evidence of distinct lineages and varying degrees of genetic differentiation. These results provide evidence of genetic diversity and genetic differentiation among fish species in the Daya River.
3.1. Nucleotide Diversity Estimation and Related Metrics
The nucleotide diversity and related genetic metrics are computed using a step-by-step procedure. Import the aligned FASTA sequences into DnaSP, making sure that all sequences have the same length and are aligned. Define the sequence sets/populations according to species identification or geographic location, which could enable comparison among populations . Then, it calculates the key diversity indices of nucleotide diversity (π), a measure of average genetic variation per site; haplotype diversity (Hd), a measure of uniqueness and frequency of haplotypes within a population; estimates the number of segregating sites (S); and the average number of nucleotide differences (k) among sequences. All data are used to conduct neutrality tests-Tajima's D and Fu's Fs-in order to understand evolutionary and demographic processes . Such neutrality tests will help in detecting deviation from neutral evolution, showing signs of population expansion, bottlenecks, or selection pressures. Similarly, Arlequin software is also common in the analysis of genetic diversity and structure from the obtained DNA sequences.
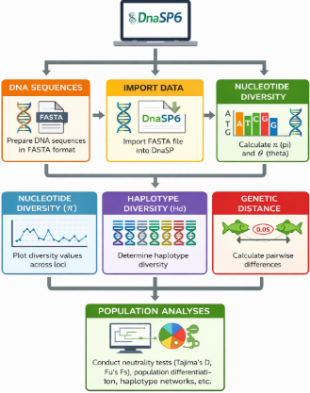
In the analysis, the aligned sequence data are first prepared and then loaded into the Arlequin software, where the populations are identically divided into species, sampling, or geographical divisions. Upon dividing the populations, the software then computes the nucleotide diversity index (\π) independently for the divided populations to describe the genetic variation within the populations . The software also computes the average Fst distance between the populations to describe the genetic differentiation of the populations from each other due to gene isolation or gene flow. However, the overview of DnaSP program, which is a computer program that analyzes DNA polymorphism within and between populations has been presented in Figures 5 and 6. It handles data worked out for a single or multiple loci, and its formats include FASTA sequence alignment, through which the program calculates indices associated with genetic diversity, linkage disequilibrium, recombination rate, and gene flow. The program also contains neutrality tests, for example, Tajima’s test and Fu and Li’s test, both performed through coalescent simulations. Finally, the software also performs Analysis of Molecular Variance (AMOVA) to divide the total genetic diversity present in the populations into genetic divergence within the populations, genetic divergence among the populations, and genetic divergence among groups of the populations, which depends on the final genetic diversity results obtained from the study . However, in the command-line or Python-based approach, the calculations for nucleotide diversity and other related genetic metrics can be performed with the help of scripting languages and bioinformatics toolkits. This helps in achieving flexibility and reproducibility of results. DNA sequences after alignment, preferably in FASTA or VCF format, are initially processed for analysis with the help of libraries like Biopython, scikit-allel, or by feeding them into scripts . This approach helps in analyzing large datasets automatically and can also help in analyzing values of tests for neutral evolution or tests for neutrality, like Tajima’s D with help from existing assistance or coding.
Figure 6. Overview of the DnaSP software for DNA polymorphism and neutrality analysis.
3.2. Neutrality Tests & Demographic Analyses
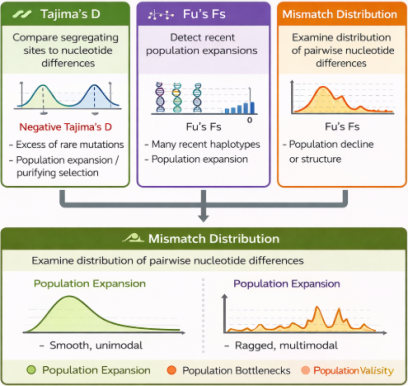
Neutrality tests and demographic analyses are important means to understand the evolutionary and population history of species. Tajima's D compares the number of segregating sites with the average number of nucleotide differences among sequences
Figure 7. Neutrality test & demographic inference using Tajima’s D, Fu’s Fs and mismatch distribution analysis.
Significant negative values are indicative of an excess of rare mutations, generally associated with recent population expansion or purifying selection, whereas positive values are indicative of balancing selection or population bottlenecks. The Tajima's D is a statistical test that compares the number of segregating sites (S) with the average number of nucleotide differences (k) in a set of DNA sequences. It assesses the hypothesis that the population is evolving neutrally. Significant deviations indicate demographic events, such as population expansion and bottlenecks, or selection, such as balancing or purifying. Similarly, Fu's Fs is particularly sensitive to demographic changes and is a good method for detecting recent population expansions; large negative Fs values indicate an excess of recent haplotypes, while positive values may indicate population decline or genetic structure. In addition to the statistical tests, mismatch distribution analysis examines the frequency distribution of pairwise nucleotide differences among sequences . An interference of neutrality test and demographic inference has been presented in Figure 7. A smooth, unimodal mismatch distribution usually indicates a sudden population expansion, while a multimodal or ragged distribution is typical for populations at demographic equilibrium or long-term stability. These methods give complementary information on whether populations have experienced expansion, contraction, or selective pressures during their evolutionary history.
3.3. Haplotype networks and phylogenetic variation in Daya River freshwater fishes.
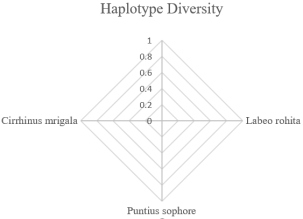
Haplotype networks and phylogenetic trees are methods of analysis which complement each other when it comes to the display of genetic relationships and the evolution of genetic data from DNA sequences. Haplotype networks, developed using software such as Pop-ART, display genetic relationships between the various haplotypes, with the mutation path between them also highlighted in the networks. Each circle in the networks represents a haplotype, with the size of the circle reflecting the frequency of the haplotypes, which helps to easily distinguish between common, rare, and ancestral haplotypes in the networks. The radar chart depicts Haplotype diversity (Hd) of three fish species Labeo rohita, Cirrhinus mrigala, and Puntius sophore. The maximum extent of each factor is mentioned on both axes, including an increment of 0.2. Labeo rohita has the highest haplotype diversity of 1.0. This is because it is highly represented by its diversified haplotype. Cirrhinus mrigala and Puntius sophore have moderate diversity of 0.5-0.6. This implies that the genetic diversity of L. rohita is moderate compared to both Cirrhinus mrigala and Puntius sophore which has been mentioned in Figure 8.
Figure 8. Haplotype diversity (Hd) across selected freshwater fish species of the Daya River.
Haplotype networks are particularly important when studies are conducted at the intraspecific level or among populations. On the other hand, phylogenetic trees show evolutionary relationships in a tree-like model. Based on MEGA, sequence evolution can be analyzed by neighbor-joining or maximum-likelihood algorithms according to evolutionary distances or substitution models, respectively. A sunburst chart highlighting the Sequence length and all focuses on the DNA sequence lengths of three types of freshwater fish Labeo rohita, Puntius sophore, and Cirrhinus mrgala. Each type of fish has been depicted by the use of different colours has been represented in Figure 9.
Figure 9. Comparison of DNA sequence lengths among selected freshwater fish species.
The Species presented in figure are Labeo rohita and Cirrhinus mrgala belong to the Indian carp’s category, another species referred to by the name Puntius sophore falls under the category of barbs. The image also focuses on the variation of the lengths of the DNA sequences studied for the three types of fish. Bootstrap analysis can be used to provide statistical support for branches on a tree and measure reliability of evolutionary relationships for inference. In particular, haplotype networks and phylogenetic trees can complement each other by providing information on genetic variation at both granular and large scales, respectively.
3.4. Statistical Comparison of Genetic Diversity and Population Structure Among Selected Freshwater Fish Species of the Daya River
Figure 10. Genetic diversity of selected freshwater fishes.
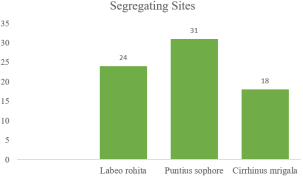
Statistical comparisons are essential for assessing genetic diversity and population structure. For instance, nucleotide diversity π may be compared among and between species or populations to determine relative genetic variation. Data distribution is considered before analysis; if assumptions of normality are violated, one might apply non-parametric tests like the Kruskal–Wallis test that considers three or more groups against each other to check for significant differences between estimates of π. On the other hand, permutation tests are a rather robust, distribution-free option in which randomness is introduced into the data to create null distributions and test significance. To infer population differentiation, pairwise Fst values are estimated using software such as Arlequin or the pegas package in R. Fst quantifies genetic divergence between populations. The significance of the Fst values is tested by permutation procedures that randomly reassign individuals or haplotypes between populations and their segregating sites has been presents in graphical format in Figure 9 showing a bar graph of Segregating sites that reflects the number of polymorphic sites observed in three freshwater fish species. The DNA Puntius sophore demonstrated the highest number of segregating sites, 31, showing more variability where as Labeo rohita exhibited 24 sites, however, Cirrhinus mrigala had only 18 sites, demonstrating a comparatively lower variability. The Y-axis represents the total number of segregating sites, ranging from 0 to 35. This comparison indicates variable genetic diversity among the species.
These statistical methods ensure sound inference about genetic differentiation, evolutionary processes, and population structure . Likewise, a comparative figure has been presented in Table 1. Labeo rohita has moderate nucleotide diversity (π = 0.0048) with high Hd values (0.821), which clearly depicts high genetic variation with the possibility of recent population expansion. Puntius sophore demonstrates the greatest genetic diversity with the highest number of haplotypes (h = 10), maximum π values (π = 0.0065), highest number of segregating sites (S = 31), and extremely negative Tajima’s D and Fu’s Fs values, which clearly indicate the effect of population expansion.
Cirrhinus mrigala demonstrates relatively lower levels of genetic diversity with lower π values (π = 0.0031) and relatively lower Hd values.
Table 1. Genetic Diversity pattern of selected Fresh Water Fish Species from the Daya River.

Species

NS (n)

SL (bp)

H No. (h)

H D (Hd)

ND (π)

SS (S)

AND (k)

TD

FS

Labeo rohita

25

650

8

0.82 ±0.4

0.0048 ±0.001

24

3.12

−1.2

−4.8

Puntius sophore

18

642

10

0.92 ± 0.3

0.0065 ±0.001

31

4.18

−1.6

−6.4

Cirrhinus mrigala

22

648

6

0.76± 0.05

0.0031 ±0.009

18

2.01

−0.8

−2.9

NS: No of sequences (n); SL: Sequence Length (bp); H: Haplotype no.; HD: Haplotype Diversity; ND: Nucleotide Diversity; SS: Segregating Sites; AND: Avg Nucleotide Difference (k); TD: Tajima’s D; Fs: Fu’s Fs
4. Discussion
The in-silico analysis of nucleotide diversity in freshwater fish species of the Daya River has helped in understanding the comparative species-specific genetic constitution across previous studies of genetic diversity in riverine fish species. The high genetic diversity of Puntius sophore, depicted by high π values of nucleotide diversity, haplotype diversity (Hd), and segregating sites, agrees with previous findings on small-bodied cyprinid species tolerant of dynamic river habitats . Other studies have indicated that species with large dispersal abilities and those that favour high population sizes and whose habitats keep fluctuating tend to have lower Tajima’s D and Fu’s Fs values, especially in species that are highly tolerant of ecological factors , thereby indicating adaptation of P. sophore to environmental variability and large population sizes. In contrast to this, Labeo rohita shows moderate nucleotide diversity and high haplotype diversity, which has been observed in most Indian major carps, and it has been attributed to past demographic expansion and subsequent stability . This genotypic structure shows that there lies sufficient adaptation power to survive under moderate stress conditions. On the other hand, Cirrhinus mrigala has a significantly lower level of genetic diversity, matching previous studies, wherein low gene-flow values were found in riverines and human-made disturbances. A low level of diversity and a low value of neutrality test statistics can be an indicator of low exposure to habitat modification and population decline . In contrast to the Brahmaputra River, a comparative genetic structuring has been associated with pollution, damming, and fragmentation in the rivers Mahanadi and Godavari in India. Although the use of mitochondrial DNA in in-silico analyses is quite economical and useful, the literature emphasizes the importance of avoiding bias and the limitation imposed by maternal inheritance. In any event, the importance of species-specific conservation policies for the sustainability of fish stocks in the Daya River is evident from the foregoing comparisons.
5. Conclusions
The present in silico study on nucleotide diversity and population genetics structure of selected freshwater fishes of the Daya River was performed with the help of available DNA sequences. Marked interspecific variation in genetic diversity is evident from the results, which reflect ecological adaptability and dispersal ability and demographic history. Accordingly, Puntius sophore depicted the highest nucleotide diversity, haplotype diversity, and number of segregating sites supported by strongly negative values for Tajima's D and Fu's Fs, probably indicating recent population expansion with a large effective population size. Hence, it can be assumed that this species is very adaptable under the dynamic environmental condition of the Daya River. Labeo rohita demonstrated moderate levels of nucleotide diversity, yet relatively high haplotype diversity; the genetic pattern often associated with historical population expansion followed by demographic stability. Genetic structure thus reflects adequate evolutionary potential to resist moderate levels of environmental stress. Cirrhinus mrigala, by contrast, had lower genetic diversity and weaker neutrality test signals, indicating restricted gene flow or smaller effective population size that may make the species more vulnerable to anthropogenic disturbances. Spatial genetic structuring among species probably reflects the effect of pollution, habitat fragmentation, and hydrological changes that altered connectivity within the Daya River. While mitochondrial DNA-based in silico analyses are inexpensive and enlightening, the drawbacks associated with database bias and uniparental inheritance need to be taken into consideration. Overall, the findings underscore the importance of species-specific conservation and management strategies that could guarantee the long-term viability and genetic sustainability of fish populations within the Daya River.
Abbreviations

AMOVA

Analysis of Molecular Variance

bp

Base Pair

BOLD

Barcode of Life Data System

DnaSp

DNA Sequence Polymorphism Software

MAFFT

Multiple Alignment Using Fast Fourier Transform

NCBI

National Centre for Biotechnology Information

PCR

Polymerase Chain Reaction

VCF

Variant Call Format

Acknowledgments
The authors would like to thank the authorities of the institution for their support and the resources provided by the public database GenBank for sequence retrieval. We are thankful to our colleagues and mentors for their help in bioinformatics analysis. Their support and help were instrumental in completing this work.
Author Contributions
Amar Kumar Sahoo: Conceptualization, Methodology, Investigation, Formal Analysis, Writing – original draft
Ram Prasad Panda: Data curation, Resources, Validation, Writing – review & editing
Nirmal Chandra Biswal: Supervision, Project administration, Visualization, Software, Writing – review & editing
Funding
The present research has not received any specific grant from any funding agency, whether from the public, commercial, or not-for-profit sectors. The study was performed using publicly available nucleotide sequence data obtained from GenBank, and the facilities of the institution supported the computational analysis.
Data Availability Statement
The datasets analyzed during the current study are publicly available in the GenBank repository. Accession numbers of all nucleotide sequences used in this study are provided within the manuscript and/or supplementary materials. All generated data, including aligned sequence files and calculated genetic diversity indices, are available from the corresponding author upon reasonable request.
Conflicts of Interest
The authors declare no conflicts of interest.
References
[1] Allan, J. D., & Castillo, M. M. (2007). Stream Ecology: Structure and Function of Running Waters. Springer.
[2] Barman, A. S., et al. (2019). Genetic diversity and population structure of freshwater fishes in Indian rivers. Environmental Biology of Fishes, 102, 123–136.
[3] Sahoo, L., et al. (2016). Impact of habitat fragmentation on genetic diversity of riverine fishes. Ecological Genetics, 8, 45–54.
[4] Dudgeon, D., et al. (2006). Freshwater biodiversity: importance, threats, status and conservation challenges. Biological Reviews, 81, 163–182.
[5] Grant, W. S., & Bowen, B. W. (1998). Shallow population histories in deep evolutionary lineages. Journal of Heredity, 89, 415–426.
[6] Nei, M., & Li, W. H. (1979). Mathematical model for studying genetic variation in terms of restriction endonucleases. PNAS, 76(10), 5269–5273.
[7] Tajima, F. (1983). Evolutionary relationship of DNA sequences in finite populations. Genetics, 105(2), 437–460.
[8] Behura, S. K. (2006). Molecular marker systems in insects. Indian Journal of Biotechnology, 5, 388–399.
[9] Tajima, F. (1989). Statistical method for testing the neutral mutation hypothesis. Genetics, 123, 585–595.
[10] Benson, D. A., et al. (2013). GenBank. Nucleic Acids Research, 41, D36–D42.
[11] Ratnasingham, S., & Hebert, P. D. N. (2007). BOLD: The Barcode of Life Data System. Molecular Ecology Notes, 7, 355–364.
[12] Kumar, S., et al. (2018). MEGA X: Molecular Evolutionary Genetics Analysis. Molecular Biology and Evolution, 35, 1547–1549.
[13] Rozas, J., et al. (2017). DnaSP 6: DNA sequence polymorphism analysis. Molecular Biology and Evolution, 34, 3299–3302.
[14] Excoffier, L., & Lischer, H. E. L. (2010). Arlequin suite ver 3.5. Molecular Ecology Resources, 10, 564–567.
[15] Paradis, E. (2010). Pegas: an R package for population genetics. Bioinformatics, 26, 419–420.
[16] Cock, P. J. A., et al. (2009). Biopython: freely available Python tools for computational molecular biology. Bioinformatics, 25, 1422–1423.
[17] Khedkar, G. D., et al. (2014). Population genetic structure of freshwater fishes inferred from mtDNA. Journal of Fish Biology, 84, 1–15.
[18] Katoh, K., et al. (2019). MAFFT multiple sequence alignment software version 7. Molecular Biology and Evolution, 36, 1530–1534.
[19] Edgar, R. C. (2004). MUSCLE: Multiple sequence alignment. Nucleic Acids Research, 32, 1792–1797.
[20] Nei, M. (1987). Molecular Evolutionary Genetics. Columbia University Press.
[21] Das, P., et al. (2018). Genetic diversity analysis of Indian major carps using mitochondrial markers. Molecular Biology Reports, 45, 231–240.
[22] Singh, M., et al. (2017). Mitochondrial DNA based population expansion in cyprinid fishes. Gene, 627, 234–242.
[23] Hughes, J. M., Schmidt, D. J., & Finn, D. S. (2009). Genes in streams: Using DNA to understand the movement of freshwater fauna. Freshwater Biology, 54, 163–181.
[24] Frankham, R., Ballou, J. D., & Briscoe, D. A. (2010). Introduction to Conservation Genetics. Cambridge University Press.
[25] Avise, J. C. (2000). Phylogeography: The History and Formation of Species. Harvard University Press.
[26] Cooke, S. J., et al. (2012). Conservation physiology in freshwater fishes. Conservation Physiology, 1, cos010.
[27] Spielman, D., Brook, B. W., & Frankham, R. (2004). Most species are not driven to extinction before genetic factors impact them. PNAS, 101, 15261–15264.
[28] Fu, Y. X. (1997). Statistical tests of neutrality of mutations. Genetics, 147, 915–925.
Cite This Article
  • APA Style

    Sahoo, A. K., Panda, R. P., Biswal, N. C. (2026). In Silico Analysis of Nucleotide Diversity of Fish Species in the Daya River. American Journal of Science, Engineering and Technology, 11(4), 252-262. https://doi.org/10.11648/j.ajset.20261104.12

    Copy | Download

    ACS Style

    Sahoo, A. K.; Panda, R. P.; Biswal, N. C. In Silico Analysis of Nucleotide Diversity of Fish Species in the Daya River. Am. J. Sci. Eng. Technol. 2026, 11(4), 252-262. doi: 10.11648/j.ajset.20261104.12

    Copy | Download

    AMA Style

    Sahoo AK, Panda RP, Biswal NC. In Silico Analysis of Nucleotide Diversity of Fish Species in the Daya River. Am J Sci Eng Technol. 2026;11(4):252-262. doi: 10.11648/j.ajset.20261104.12

    Copy | Download

  • @article{10.11648/j.ajset.20261104.12,
      author = {Amar Kumar Sahoo and Ram Prasad Panda and Nirmal Chandra Biswal},
      title = {In Silico Analysis of Nucleotide Diversity of Fish Species in the Daya River},
      journal = {American Journal of Science, Engineering and Technology},
      volume = {11},
      number = {4},
      pages = {252-262},
      doi = {10.11648/j.ajset.20261104.12},
      url = {https://doi.org/10.11648/j.ajset.20261104.12},
      eprint = {https://article.sciencepublishinggroup.com/pdf/10.11648.j.ajset.20261104.12},
      abstract = {The current study was designed to assess the nucleotide diversity and genetic structure of selected fish species in the Daya River using an in-silico approach. Genetic diversity is an important measure of population stability, adaptability, and survival, especially in freshwater habitats that are now under increasing human impacts. The nucleotide sequences of the most frequently documented fish species were obtained from the GenBank database, with a primary emphasis on mitochondrial gene segments. Following quality analysis and multiple sequence alignment, major genetic diversity measures such as nucleotide diversity (π), haplotype diversity (Hd), number of segregating sites (S), and average nucleotide differences were calculated using bioinformatics software packages such as DnaSP and MEGA. Neutrality tests, such as Tajima’s D and Fu’s Fs, were conducted to reconstruct the demographic history of the species. Phylogenetic trees and haplotype networks were also generated to examine the genetic relationships and differentiation of the lineages among the species. The data showed that the species had different levels of nucleotide diversity, where some species had moderate to high genetic diversity, while others had lower genetic diversity, which could be a result of habitat fragmentation and population reduction. The results emphasize the significance of molecular analysis in the identification of genetically susceptible populations and form a scientific basis for conservation and sustainable fishing resource management in the Daya River. The current research proves the efficiency of computational genetic analysis as a cost-effective alternative to Ichthyogenetics in fresh water fish genetic diversity of Daya River.},
     year = {2026}
    }
    

    Copy | Download

  • TY  - JOUR
    T1  - In Silico Analysis of Nucleotide Diversity of Fish Species in the Daya River
    AU  - Amar Kumar Sahoo
    AU  - Ram Prasad Panda
    AU  - Nirmal Chandra Biswal
    Y1  - 2026/10/17
    PY  - 2026
    N1  - https://doi.org/10.11648/j.ajset.20261104.12
    DO  - 10.11648/j.ajset.20261104.12
    T2  - American Journal of Science, Engineering and Technology
    JF  - American Journal of Science, Engineering and Technology
    JO  - American Journal of Science, Engineering and Technology
    SP  - 252
    EP  - 262
    PB  - Science Publishing Group
    SN  - 2578-8353
    UR  - https://doi.org/10.11648/j.ajset.20261104.12
    AB  - The current study was designed to assess the nucleotide diversity and genetic structure of selected fish species in the Daya River using an in-silico approach. Genetic diversity is an important measure of population stability, adaptability, and survival, especially in freshwater habitats that are now under increasing human impacts. The nucleotide sequences of the most frequently documented fish species were obtained from the GenBank database, with a primary emphasis on mitochondrial gene segments. Following quality analysis and multiple sequence alignment, major genetic diversity measures such as nucleotide diversity (π), haplotype diversity (Hd), number of segregating sites (S), and average nucleotide differences were calculated using bioinformatics software packages such as DnaSP and MEGA. Neutrality tests, such as Tajima’s D and Fu’s Fs, were conducted to reconstruct the demographic history of the species. Phylogenetic trees and haplotype networks were also generated to examine the genetic relationships and differentiation of the lineages among the species. The data showed that the species had different levels of nucleotide diversity, where some species had moderate to high genetic diversity, while others had lower genetic diversity, which could be a result of habitat fragmentation and population reduction. The results emphasize the significance of molecular analysis in the identification of genetically susceptible populations and form a scientific basis for conservation and sustainable fishing resource management in the Daya River. The current research proves the efficiency of computational genetic analysis as a cost-effective alternative to Ichthyogenetics in fresh water fish genetic diversity of Daya River.
    VL  - 11
    IS  - 4
    ER  - 

    Copy | Download

Author Information
  • Department of Life Science, Gandhi Institute of Engineering and Technology University, Gunupur, India

    Biography: Amar Kumar Sahoo is a committed academic and Lecturer in Zoology at Ambedkar Centenary College of Education and Technology, Bhubaneswar, Khordha, Odisha, where he has been serving since April 16, 2008. He began his academic journey with an M.Sc. in Zoology from Bhoj University, Madhya Pradesh, in 2008, followed by an M. Phil. in Bioinformatics from Centurion University, Khordha, in 2016. Currently, he is pursuing his Ph.D. in Zoology at GIET University, Gunupur, Rayagada, Odisha, further strengthening his expertise in life sciences. His areas of specialization include ecology, biodiversity, and bioinformatics, reflecting a unique blend of classical zoological knowledge and modern computational approaches. Sahoo’s teaching and research emphasize the importance of ecological balance, biodiversity conservation, and the application of bioinformatics tools in understanding complex biological systems. Over the years, he has inspired students to engage in conservation-oriented studies and to appreciate the role of technology in advancing ecological research.

  • Department of Zoology, Gopalpur College, Gopalpur, India

    Biography: Ram Prasad Panda, Principal of Gopalpur College, Gopalpur-on-Sea, is a distinguished academician and researcher in Zoology. He earned his M.Sc. (1988) and M. Phil. (1994) from Berhampur University and completed his Ph.D. at Utkal University in 2001. With over three decades of academic leadership, he has guided 8 Ph.D. scholars and 1 M. Phil. student, while 5 more are pursuing doctoral research under his mentorship. Dr. Panda has published 2 books, Eco-conservation for Tribal Development and Wildlife Conservation & Management, alongside 22 research papers in national and international journals. His contributions extend to edited volumes on biodiversity, environmental health, and medicinal plants. He has conducted 12 seminars and actively participated in numerous national conferences. A dedicated educator and conservationist, Dr. Panda’s work emphasises ecological sustainability, tribal development, and wildlife management, making him a respected figure in academia and community outreach.

  • Department of Life Science, Gandhi Institute of Engineering and Technology University, Gunupur, India

    Biography: Nirmal Chandra Biswal is an Associate Professor at GIET University, Gunupur, Rayagada, Odisha, where he has established himself as a dedicated educator and researcher. With a strong academic background and years of teaching experience, he has contributed significantly to higher education and the advancement of zoological sciences. His work reflects a commitment to both pedagogy and research, fostering an environment that encourages innovation, critical thinking, and scholarly excellence among students. Dr. Biswal’s academic interests span across ecology, biodiversity, and applied zoology, areas in which he has guided numerous students and contributed to institutional growth. As an Associate Professor, he continues to play a vital role in shaping the academic landscape of GIET University, inspiring future researchers and professionals to pursue scientific inquiry and conservation-oriented studies. His career embodies dedication to knowledge dissemination, academic leadership, and sustainable scientific development.

  • Abstract
  • Keywords
  • Document Sections

    1. 1. Introduction
    2. 2. Methodology
    3. 3. Results
    4. 4. Discussion
    5. 5. Conclusions
    Show Full Outline
  • Abbreviations
  • Acknowledgments
  • Author Contributions
  • Funding
  • Data Availability Statement
  • Conflicts of Interest
  • References
  • Cite This Article
  • Author Information