Piped water must inspire consumer confidence in health and organoleptic terms. In the event of a food poisoning, consumers who have a poor perception of its quality may incriminate it, without taking into consideration that the fact of passing it through a drinking water storage container before consuming it can also cause contamination. The present study carried out in the town of Aboisso aimed to assess the role of water storage in the deterioration of microbiological quality of drinking water, and to identify the predictive factors of the presence of bacteria in stored water. To do this, physicochemical parameters (temperature, pH, conductivity, turbidity and free chlorine) and microbiological parameters (total coliforms, thermotolerant coliforms and E. coli) were measured on water samples taken from taps and storage containers in 94 households. The storage conditions of drinking water were also the subject of a brief household survey. The identification of predictive factors for the presence of total coliforms and E. coli in stored water was done using bivariate analysis and multivariate analysis by binary logistic regression through two models. The first model included the use of a transport container and the storage conditions as independent variables. The second included besides that the values of turbidity and free chlorine. As results, the waters were weakly mineralized and acidic. Free chlorine levels, temperature values, and bacterial loads in tap water were significantly (p < 0.05) higher than those in stored water. While 13.83% of samples taken at the taps were contaminated with total coliforms and 1.06% with E. coli, 50% and 18.09% of those taken in containers were contaminated with total coliforms and E. coli, respectively. In the first model, only the storage duration and the method used to draw water from storage container were statistically associated with the presence of total coliforms while no variable was statistically associated with the presence of E. coli. In the second model, the drawing method and the free chlorine level were significantly associated with the presence of total coliforms while only the free chlorine level was associated with E. coli. These results motivate the need to raise awareness and train populations in drinking water hygiene.
| Published in | International Journal of Nutrition and Food Sciences (Volume 13, Issue 3) |
| DOI | 10.11648/j.ijnfs.20241303.15 |
| Page(s) | 102-113 |
| Creative Commons |
This is an Open Access article, distributed under the terms of the Creative Commons Attribution 4.0 International License (http://creativecommons.org/licenses/by/4.0/), which permits unrestricted use, distribution and reproduction in any medium or format, provided the original work is properly cited. |
| Copyright |
Copyright © The Author(s), 2024. Published by Science Publishing Group |
Piped Water, Water Storage, Water Quality, Total Coliforms, E. coli, Multivariate Analysis, Logistic Regression
Parameters | Units | Min | Med | Mean ± SD | Max | CV | Ivorian standard | Non-compliances | |
|---|---|---|---|---|---|---|---|---|---|
n | % | ||||||||
Temp | °C | 26.50 | 30.00 | 30.02 ± 1.50 | 33.20 | 0.05 | - | - | |
pH* | - | 5.62 | 5.97 | 5.98 ± 0.19 | 6.56 | 0.03 | 6.5 ≤ pH ≤ 9 | 93 | 98.94 |
Cond* | µS/cm | 107.1 | 121.80 | 122.35 ± 8.23 | 143.3 | 0.07 | 200 ≤ Cond ≤ 1100 | 94 | 100 |
Turb | NTU | 0.45 | 1.91 | 2.15 ± 1.01 | 6.42 | 0.47 | Turb ≤ 1 | 90 | 95.74 |
Cl2* | mg/l | 0.03 | 0.89 | 0.86 ± 0.44 | 2.20 | 0.52 | 0.2 ≤ Cl2 ≤ 1 | 38 | 40.43 |
T C | CFU/100 ml | 0 | 0 | 47.20 ± 392.98 | 3800 | 8.33 | < 1 | 13 | 13.83 |
Th C | CFU/100 ml | 0 | 0 | 0.20 ± 1.96 | 19 | 9.70 | < 1 | 1 | 1.06 |
E. coli | CFU/100 ml | 0 | 0 | 0.20 ± 1.96 | 19 | 9.70 | < 1 | 1 | 1.06 |
Parameters | Units | Min | Med | Mean ± SD | Max | CV | Ivorian standard | Non-compliances | |
|---|---|---|---|---|---|---|---|---|---|
n | % | ||||||||
Temp | °C | 25.40 | 29.05 | 29.44 ± 1.86 | 34 | 0.06 | - | - | - |
pH* | - | 5.59 | 6.00 | 6.02 ± 0.21 | 6.83 | 0.04 | 6.5 ≤ pH ≤ 9 | 93 | 98.94 |
Cond* | µS/cm | 107.30 | 122.85 | 125.69 ± 13.77 | 179.5 | 0.11 | 200 ≤ Cond≤ 1100 | 94 | 100 |
Turb | NTU | 0.18 | 1.71 | 1.89 ± 1.21 | 7.27 | 0.64 | Turb ≤ 1 | 72 | 76.60 |
Cl2* | mg/l | 0 | 0.120 | 0.30 ± 0.39 | 1.83 | 1.30 | 0.2 ≤ Cl2 ≤ 1 | 67 | 71.28 |
C T | CFU/100 ml | 0 | 0.50 | 725.83 ± 1218.01 | 4900 | 1.68 | < 1 | 47 | 50.00 |
Th C | CFU/100 ml | 0 | 0 | 48.23 ± 291.65 | 2600 | 6.05 | < 1 | 17 | 18.09 |
E. coli | CFU/100 ml | 0 | 0 | 39.18 ± 233.68 | 2080 | 5.96 | < 1 | 17 | 18.09 |
variables | Total N = 94 | Total coliforms | E. coli | ||||
|---|---|---|---|---|---|---|---|
Absence N = 47 | Presence N = 47 | p-value | Absence N = 77 | Presence N = 17 | p-value | ||
Storage duration | 0.016 | >0.9 | |||||
Two days and less | 77 | 55.8% | 44.2% | 81.8% | 18.2% | ||
More than two days | 17 | 23.5% | 76.5% | 82.4% | 17.6% | ||
Use of a transport container | 0.5 | 0.3 | |||||
No | 61 | 52.5% | 47.5% | 78.7% | 21.3% | ||
Yes | 33 | 45.5% | 54.5% | 87.9% | 12.1% | ||
Storage container volume | 0.4 | 0.5 | |||||
≤ 20 litres | 68 | 52.9% | 47.1% | 83.8% | 16.2% | ||
> 20 litres | 26 | 42.3% | 57.7% | 76.9% | 23.1% | ||
Storage container storage location | >0.9 | 0.7 | |||||
In the House | 78 | 50.0% | 50.0% | 80.8% | 19.2% | ||
Outside the house | 16 | 50.0% | 50.0% | 87.5% | 12.5% | ||
Storage container properly covered | 0.8 | 0.055 | |||||
Yes | 81 | 50.6% | 49.4% | 85.2% | 14.8% | ||
No | 13 | 46.2% | 53.8% | 61.5% | 38.5% | ||
Presence of deposit in the storage container | 0.090 | 0.2 | |||||
No | 36 | 61.1% | 38.9% | 88.9% | 11.1% | ||
Yes | 58 | 43.1% | 56.9% | 77.6% | 22.4% | ||
Drawing method | 0.004 | 0.002 | |||||
Pour out from container | 20 | 70.0% | 30.0% | 100.0% | 0.0% | ||
Dip vessel with handle into container | 63 | 38.1% | 61.9% | 73.0% | 27.0% | ||
Dip vessel without handle into container | 11 | 81.8% | 18.2% | 100.0% | 0.0% | ||
Turbidity | 0.003 | 0.2 | |||||
≤ 1 NTU | 22 | 22.7% | 77.3% | 72.7% | 27.3% | ||
> 1 NTU | 72 | 58.3% | 41.7% | 84.7% | 15.3% | ||
Free chlorine level | <0.001 | 0.003 | |||||
Cl2 ≥ 0.2 mg/l | 35 | 82.9% | 17.1% | 97.1% | 2.9% | ||
Cl2 < 0.2 mg/l | 59 | 30.5% | 69.5% | 72.9% | 27.1% | ||
Model 1 | Model 2 | |||||
|---|---|---|---|---|---|---|
Variables | OR | 95% IC | p-value | OR | 95% IC | p-value |
(Intercept) | 0.30 | 0.09 – 0.85 | 0.031 | 0.20 | 0.03 – 1.28 | 0.10 |
Storage duration | ||||||
Two days and less | 1.00 | — | 1.00 | — | ||
More than two days | 5.47 | 1.44 – 28.0 | 0.021 | 3.00 | 0.68 – 17.2 | 0.2 |
Use of a transport container | ||||||
No | 1.00 | — | 1.00 | — | ||
Yes | 0.89 | 0.32 – 2.46 | 0.8 | 0.76 | 0.24 – 2.36 | 0.6 |
Storage container volume | ||||||
≤ 20 liters | 1.00 | — | 1.00 | — | ||
> 20 liters | 0.80 | 0.26 – 2.44 | 0.7 | 0.98 | 0.27 – 3.65 | >0.9 |
Storage container storage location | ||||||
In the House | 1.00 | — | 1.00 | — | ||
Outside the house | 1.09 | 0.28 – 4.42 | 0.9 | 2.17 | 0.41 – 11.9 | 0.4 |
Storage container Properly covered | ||||||
Yes | 1.00 | — | 1.00 | — | ||
No | 1.33 | 0.34 – 5.61 | 0.7 | 1.20 | 0.23 – 7.07 | 0.8 |
Presence of deposit in the storage container | ||||||
No | 1.00 | — | 1.00 | — | ||
Yes | 1.51 | 0.57 – 3.98 | 0.4 | 2.17 | 0.70 – 7.04 | 0.2 |
Drawing method | ||||||
Pour out from container | 1.00 | — | 1.00 | — | ||
Dip vessel with handle into container | 3.50 | 1.07 – 12.7 | 0.045 | 1.21 | 0.26 – 5.46 | 0.8 |
Dip vessel without handle into container | 0.28 | 0.03 – 2.06 | 0.2 | 0.09 | 0.01 – 0.81 | 0.046 |
Turbidity | ||||||
≤ 1 NTU | 1.00 | — | ||||
> 1 NTU | 0.45 | 0.11 – 1.69 | 0.2 | |||
Free chlorine level | ||||||
Cl2 ≥ 0.2 mg/l | 1.00 | — | ||||
Cl2 < 0.2 mg/l | 12.0 | 3.66 – 46.5 | <0.001 | |||
Model 1 | Model 2 | |||||
|---|---|---|---|---|---|---|
Variables | OR | 95% IC | p-value | OR | 95% IC | p-value |
(Intercept) | 0.12 | 0.03 – 0.34 | <0.001 | 0.02 | 0.00 – 0.20 | 0.004 |
Storage duration | ||||||
Two days and less | 1.00 | — | 1.00 | — | ||
More than two days | 0.94 | 0.18 – 3.91 | >0.9 | 0.71 | 0.12 – 3.33 | 0.7 |
Use of a transport container | ||||||
No | 1.00 | — | 1.00 | — | ||
Yes | 0.44 | 0.10 – 1.60 | 0.2 | 0.27 | 0.05 – 1.14 | 0.10 |
Storage container volume | ||||||
≤ 20 liters | 1.00 | — | 1.00 | — | ||
> 20 liters | 2.00 | 0.51 – 7.82 | 0.3 | 2.56 | 0.54 – 12.9 | 0.2 |
Storage container storage location | ||||||
In the House | 1.00 | — | 1.00 | — | ||
Outside the house | 0.43 | 0.05 – 2.20 | 0.4 | 0.44 | 0.04 – 2.95 | 0.4 |
Storage container Properly covered | ||||||
Yes | 1.00 | — | 1.00 | — | ||
No | 2.71 | 0.67 – 10.2 | 0.14 | 3.24 | 0.67 – 16.1 | 0.14 |
Presence of deposit in the storage container | ||||||
No | 1.00 | — | 1.00 | — | ||
Yes | 2.34 | 0.69 – 9.51 | 0.2 | 2.38 | 0.64 – 10.7 | 0.2 |
Turbidity | ||||||
≤ 1 NTU | 1.00 | — | ||||
> 1 NTU | 0.67 | 0.17 – 2.77 | 0.6 | |||
Free chlorine level | ||||||
Cl2 ≥ 0.2 mg/l | 1.00 | — | ||||
Cl2 < 0.2 mg/l | 16.7 | 2.70 – 340 | 0.013 | |||
CFU | Colony Forming Unit |
CV | Coefficient of Variation |
NTU | Nephelometric Turbidity Unit |
OR | Odds Ratio |
| [1] | Attaoui, Z. E., Sossi, F. Z. A., Khatori, Y. E. Management of risks threatening water quality: Application of the PROCESSES and the HACCP method. SHS Web of Conferences. 2023, 175. |
| [2] | Boko, G., Manou, B. E., Wertz, I., Drubbel, M. V., Kelome, N. A. Contribution of GIS in the diagnosis of the drinking water supply system in the town of Kétou in south Benin. Int J Biol Chem Sci. 2021, 15(3), 38–53. |
| [3] | Bernard, N., Machado, A. Du droit à l’eau et de la précarité hydrique [The right to water and water poverty]. In Aménagement - environnement: urbanisme et droit foncier. 2021, 3, 145-166. |
| [4] | WHO, UNICEF. Progress on sanitation and drinking water – 2015 update and MDG assessment. Geneve : World Health Organization (WHO) and United Nations International Children's Emergency Fund (UNICEF). 2015. |
| [5] | Kouadio, L., Diarra, M., Akessé, D. P. V., Aboua K. N., Soro, B. D., Méite, L., Dembélé, A., Koné, M., Traoré, S. K. Influence of the light source and the nature of water on the elimination of ciprofloxacin. J. Soc. Ouest-Afr. Chim. 2017, 044, 23–29. |
| [6] | Beaulieu P, Fisset B. Tap water: A requirement of quality. Cah Nutr Diététique. 2009, 44(6), 294–301. |
| [7] | Bontemps C., Nauges C. Carafe ou bouteille? Le rôle de la qualité de l’environnement dans la décision du consommateur. [Carafe or bottle? The role of environmental quality in consumer decisions]. Économie & Prévision. 2009, 188, 61–79. |
| [8] | Reynaud, A., Garcia-Valiñas, M. A. Does Residential Water Use Depend on Water Quality? Some Answers from a French Case Study. In: Grafton Q, Daniell KA, Nauges C, Rinaudo J-D, Chan NWW, editors. Underst. Manag. Urban Water Transit., Dordrecht: Springer Netherlands. 20 15, p. 337–57. |
| [9] | Ballet, T. G. N., Gnagne, A., Fofana, V., Yapo, B. O. Evaluation of households' perception about the quality of tap water in two communes, Cocody and Yopougon from Abidjan town, Côte d’Ivoire. Afr Sci. 2018, 14(6), 48–57. |
| [10] | Koudou, A., Assoma, T. V., Niamké, K. H., Anoh, K. A., Adiaffi, B., Kouamé, K. F. Characterization and quantification of the relationship between hydrographic network and fracturing of the Agneby coastal watershed in Côte d’Ivoire. Afr Sci. 2018, 14(5), 311–324. |
| [11] | Niamké G. M. Dégradation de l’environnement et santé de la population dans la ville d’Aboisso [Environmental degradation and population health in the town of Aboisso]. Thèse Unique de Doctorat. Université Félix Houphouët Boigny, Abidjan. 2016. |
| [12] | Ake G. E., Eba A. E. L., Assi J. J., Kouadio B. H., Biemi J. GIS contribution to the delimitation of the protection perimeters around the water source of SODECI in Aboisso, South-East Côte d’Ivoire. Afr Sci. 2019, 15(3), 234–252. |
| [13] | Konan, Y. A., Kessie, B. A., Kamelan, T. M., Kouamelan, E. P. Growth and reproduction parameters of Brienomyrus brachyistius (Gill, 1862) from the Lake Ayamé 1 (Bia river, Côte d’Ivoire). Agron Afr. 2021, 33(2), 215–229. |
| [14] | Bain, R., Cronk, R., Hossain, R., Bonjour, S., Onda, K., Wright, J., Yang, H., Slaymaker, T., Hunter, P., Prüss-Ustün, A., Bartram, J. Global assessment of exposure to faecal contamination through drinking water based on a systematic review. Trop Med Int Health. 2014, 19(8), 917–927. |
| [15] | Lavie, E., El-Tayib, N. H. From the tap to the mouth, drinking water quality in the domestic context in Khartoum, Sudan. Cybergeo Eur J Geogr, [En ligne], Espace, Société, Territoire, document 664. 2014. |
| [16] | Amoukpo, H., Toffa, D., Boni, G., Salou Bachirou, Z., Wari, M., Fandohan, I., Aimade, H., Noudoffinin, N., Gouton, E., Fiossi, M., Agossadou, C., Mignanwande, F., Catraye, P., Bedie, V., Barogui, Y., Diez, G., Johnson, R. C. Improvement of the microbiological quality of drinking water in Lalo and Zè, two rural municipalities in Benin. Environ Risques Santé. 2018, 17(6), 611–618. |
| [17] | Coulibaly, M., Coulibaly, M., Diomandé, S. Analyse du mode d’accès, de conservation de l’eau et risques de maladies hydriques dans un quartier populaire: Cas de Kennedy Clouetcha dans la commune d’Abobo (Côte d’Ivoire). [Analysis of the mode of access, water conservation and risks of water-borne diseases in a working-class neighborhood: Case of Kennedy Clouetcha in the commune of Abobo (Ivory Coast)]. La revue des Sciences Sociales « Kafoudal ». 2019, N° Spécial Janvier 2020, 122-141. |
| [18] | Gbohaida, V., Agbangnan, D. C. P., Ngossanga, M. B., Medoatinsa, S. E., Dovonon, L. F. C., Wotto, D. V., Avlessi, F., Sohounhloue, D. C. K. Study of the physico-chemical quality of drinking water in two localities of Benin: Cotonou and Dassa-Zoumè. Int J Biol Chem Sci. 2016, 10(1), 422-434. |
| [19] | Mvouezolo, R. F. L., Nkounkou, L. C., Foto, E., Ayessou, N., Mar, C. G., Ouamba, J. M. Hydrochemical quality and metallic contamination of the water distributed under pipeline in the city of Brazzaville, Congo. 2019, 15(1), 227–241. |
| [20] | Daley, K., Truelstrup, H. L., Jamieson, R. C., Hayward, J. L., Piorkowski, G. S., Krkosek, W., Gagnon G. A., Castleden, H., MacNeil, K., Poltarowicz, J., Corriveau, E., Jackson, A., Lywood, J., Huang, Y. Chemical and microbial characteristics of municipal drinking water supply systems in the Canadian Arctic. Environ Sci Pollut Res. 2018, 25, 32926–32937. |
| [21] | Rakotomaria, E., Ratsimba, M. H., Rakotomamonjy, P. Chemical promotion of the kaolin in water treatment: preparation of new coagulant minerals. Rev Sci L’eau. 2011, 24(4), 437–448. |
| [22] | Angui, K., Gone, D., Djebre, S. Comparative effects of unslaked lime and dolomite on some chemical parameters of a ferrasol and an organic soil in southern Côte d’Ivoire. Agron Afr. 2009, 21(2), 155-163. |
| [23] | Dubovkina, I. Different methods of treatment of liquid systems and solutions: a review. Ukr J Food Sci. 2019, 7(2), 317–330. |
| [24] | Odjegba, E., Amori, A., Zaccheaus, O., Awomeso, A., Adetula, B. Water Quality and Socio-economic Appraisal of Public Water Supply in Abeokuta, Southwest, Nigeria. 2015, 1(1-2), 193–203. |
| [25] | Mbweb Katshil, P., Yav, N. N., Kashala, J. L. Comparative study on the quality of the water produced at REGIDESO factories in the center of Kolwezi with that distributed to customers: Case of the Mununka district in the commune of Manika, City of Kolwezi, DR Congo. Int J Innov Appl Stud. 2021, 35(1), 153–164. |
| [26] | Dovonou, E. F., Hounsou, M. B., Sambienou, G. W., Adandedjan, C., Houessouga, F., Mama, D. Physico-chemical and bacteriological characterization of Rain water stored in tanks for consumption in the community of Toffo: case of the borough of Damè.. J Appl Biosci. 2020, 154, 15871–15880. |
| [27] | Wongpeerak, K., Charuwimolkul, N., Changklom, J., Lipiwattanakarn, S., Pornprommin, A. Theoretical Estimation of Disinfectant Mass Balance Components in Drinking Water Distribution Systems. Water. 2023, 15(2), 368. |
| [28] | Mahfouz, A. S. B., El-Halwagi, M. M., Abdel-Wahab, A. Process integration techniques for optimizing seawater cooling systems and biocide discharge. Clean Technol Environ Policy. 2006, 8, 203–215. |
| [29] | James, R. Dechlorination by ultraviolet radiation: a suitable alternative to activated carbon in dialysis water systems? J Ren Care. 2009, 35(4), 205–210. |
| [30] | Warren, A., Drogui, P., Laurion, I. A review of the current state of knowledge concerning the processes used for removal of cyanobacteria and cyanotoxins from drinking water. Rev Sci Eau. 2010, 23(4), 391–412. |
| [31] | Yin, J., Gao, W., Yu, W., Guan, Y., Wang, Z., Jin, Q. A batch microfabrication of a self-cleaning, ultradurable electrochemical sensor employing a BDD film for the online monitoring of free chlorine in tap water. Microsyst Nanoeng. 2022, 8(1), 1-12. |
| [32] | Dedić, S., Jukić, H., Rodić, M., Jusufhodžić, Z., Džaferović, A. Evaluation of Microbiological Parameters of Drinking Water from the Dobrenica Water Supply System in Ostrožac na Uni. In: Brka M, Omanović-Mikličanin E, Karić L, Falan V, Toroman A, editors. 30th Sci.-Experts Conf. Agric. Food Ind., Cham: Springer International Publishing; 2020, p. 281–287. |
| [33] | Anayah, F., Al-Khatib, I. A., Hejaz, B. Assessment of water and sanitation systems at Palestinian healthcare facilities: pre- and post-COVID-19. Environ Monit Assess. 2021, 193, 41. |
| [34] | Hounsounou, E. O., Tchibozo M. A. D., Ayi-Fanou, L., Agbossou, E. Public network’s chain of water in some shantytowns of sixth district of Cotonou-Bénin. VertigO - Rev Électronique En Sci Environ. 2017, 17(3). |
| [35] | Ognard, C., Taglioni, F. Ressource en eau et fabrique du risque sanitaire au prisme de l’analyse de la vulnérabilité dans la capitale malgache [Water resources and the production of health risks through the prism of vulnerability analysis in the Malagasy capital]. Cah O-m. 2019, 280(2), 439–467. |
| [36] | Ngnikam, E., Mougoue, B., Tietche, F. Eau, Assainissement et impact sur la santé: étude de cas d’un écosystème urbain à Yaoundé [Water, Sanitation and impact on health: case study of an urban ecosystem in Yaoundé]. Actes JSIRAUF, Hanoi: 2007, p. 13. |
| [37] | Some, Y. S. C., Soro, T. D., Ouedraogo, S. Étude de la prévalence des maladies liées à l’eau et influences des facteurs environnementaux dans l’arrondissement de Nomgr-Masson: cas du quartier Tanghin (Ouagadougou-Burkina Faso) [Study of the prevalence of water-related diseases and influences of environmental factors in the district of Nomgr-Masson: case of the Tanghin district (Ouagadougou-Burkina Faso)]. Int J Biol Chem Sci. 2014, 8(1), 289–303. |
| [38] | Tambekar W. S. Assessment of storage and handling practices on quality of household drinking water. BELS - Bull Enviromental Life Sci. 2022, 4(1), 12-17. |
APA Style
Seki, T. O., Meless, D. F. R., Kpaibé, S. A. P., Amin, N. C. (2024). Quality Control of Tap Water and Factors Determining Bacterial Contamination of Households’ Stored Drinking Water in the Town of Aboisso (Côte d’Ivoire). International Journal of Nutrition and Food Sciences, 13(3), 102-113. https://doi.org/10.11648/j.ijnfs.20241303.15
ACS Style
Seki, T. O.; Meless, D. F. R.; Kpaibé, S. A. P.; Amin, N. C. Quality Control of Tap Water and Factors Determining Bacterial Contamination of Households’ Stored Drinking Water in the Town of Aboisso (Côte d’Ivoire). Int. J. Nutr. Food Sci. 2024, 13(3), 102-113. doi: 10.11648/j.ijnfs.20241303.15
AMA Style
Seki TO, Meless DFR, Kpaibé SAP, Amin NC. Quality Control of Tap Water and Factors Determining Bacterial Contamination of Households’ Stored Drinking Water in the Town of Aboisso (Côte d’Ivoire). Int J Nutr Food Sci. 2024;13(3):102-113. doi: 10.11648/j.ijnfs.20241303.15
@article{10.11648/j.ijnfs.20241303.15,
  author = {Thierry Oscar Seki and Djedjro Franck Renaud Meless and Sawa André Philippe Kpaibé and N’cho Christophe Amin},
  title = {Quality Control of Tap Water and Factors Determining Bacterial Contamination of Households’ Stored Drinking Water in the Town of Aboisso (Côte d’Ivoire)
},
  journal = {International Journal of Nutrition and Food Sciences},
  volume = {13},
  number = {3},
  pages = {102-113},
  doi = {10.11648/j.ijnfs.20241303.15},
  url = {https://doi.org/10.11648/j.ijnfs.20241303.15},
  eprint = {https://article.sciencepublishinggroup.com/pdf/10.11648.j.ijnfs.20241303.15},
  abstract = {Piped water must inspire consumer confidence in health and organoleptic terms. In the event of a food poisoning, consumers who have a poor perception of its quality may incriminate it, without taking into consideration that the fact of passing it through a drinking water storage container before consuming it can also cause contamination. The present study carried out in the town of Aboisso aimed to assess the role of water storage in the deterioration of microbiological quality of drinking water, and to identify the predictive factors of the presence of bacteria in stored water. To do this, physicochemical parameters (temperature, pH, conductivity, turbidity and free chlorine) and microbiological parameters (total coliforms, thermotolerant coliforms and E. coli) were measured on water samples taken from taps and storage containers in 94 households. The storage conditions of drinking water were also the subject of a brief household survey. The identification of predictive factors for the presence of total coliforms and E. coli in stored water was done using bivariate analysis and multivariate analysis by binary logistic regression through two models. The first model included the use of a transport container and the storage conditions as independent variables. The second included besides that the values of turbidity and free chlorine. As results, the waters were weakly mineralized and acidic. Free chlorine levels, temperature values, and bacterial loads in tap water were significantly (p E. coli, 50% and 18.09% of those taken in containers were contaminated with total coliforms and E. coli, respectively. In the first model, only the storage duration and the method used to draw water from storage container were statistically associated with the presence of total coliforms while no variable was statistically associated with the presence of E. coli. In the second model, the drawing method and the free chlorine level were significantly associated with the presence of total coliforms while only the free chlorine level was associated with E. coli. These results motivate the need to raise awareness and train populations in drinking water hygiene.
},
 year = {2024}
}
TY  - JOUR
T1  - Quality Control of Tap Water and Factors Determining Bacterial Contamination of Households’ Stored Drinking Water in the Town of Aboisso (Côte d’Ivoire)

AU  - Thierry Oscar Seki
AU  - Djedjro Franck Renaud Meless
AU  - Sawa André Philippe Kpaibé
AU  - N’cho Christophe Amin
Y1  - 2024/06/03
PY  - 2024
N1  - https://doi.org/10.11648/j.ijnfs.20241303.15
DO  - 10.11648/j.ijnfs.20241303.15
T2  - International Journal of Nutrition and Food Sciences
JF  - International Journal of Nutrition and Food Sciences
JO  - International Journal of Nutrition and Food Sciences
SP  - 102
EP  - 113
PB  - Science Publishing Group
SN  - 2327-2716
UR  - https://doi.org/10.11648/j.ijnfs.20241303.15
AB  - Piped water must inspire consumer confidence in health and organoleptic terms. In the event of a food poisoning, consumers who have a poor perception of its quality may incriminate it, without taking into consideration that the fact of passing it through a drinking water storage container before consuming it can also cause contamination. The present study carried out in the town of Aboisso aimed to assess the role of water storage in the deterioration of microbiological quality of drinking water, and to identify the predictive factors of the presence of bacteria in stored water. To do this, physicochemical parameters (temperature, pH, conductivity, turbidity and free chlorine) and microbiological parameters (total coliforms, thermotolerant coliforms and E. coli) were measured on water samples taken from taps and storage containers in 94 households. The storage conditions of drinking water were also the subject of a brief household survey. The identification of predictive factors for the presence of total coliforms and E. coli in stored water was done using bivariate analysis and multivariate analysis by binary logistic regression through two models. The first model included the use of a transport container and the storage conditions as independent variables. The second included besides that the values of turbidity and free chlorine. As results, the waters were weakly mineralized and acidic. Free chlorine levels, temperature values, and bacterial loads in tap water were significantly (p E. coli, 50% and 18.09% of those taken in containers were contaminated with total coliforms and E. coli, respectively. In the first model, only the storage duration and the method used to draw water from storage container were statistically associated with the presence of total coliforms while no variable was statistically associated with the presence of E. coli. In the second model, the drawing method and the free chlorine level were significantly associated with the presence of total coliforms while only the free chlorine level was associated with E. coli. These results motivate the need to raise awareness and train populations in drinking water hygiene.

VL  - 13
IS  - 3
ER  -
Department of Water and Food Analysis, National Institute of Public Hygiene, Abidjan, Côte d’Ivoire; Department of Analytical Sciences and Public Health, Pharmaceutical and Biological Sciences Faculty, Félix Houphouët-Boigny University, Abidjan, Côte d’Ivoire
Department of Water and Food Analysis, National Institute of Public Hygiene, Abidjan, Côte d’Ivoire; Department of Analytical Sciences and Public Health, Pharmaceutical and Biological Sciences Faculty, Félix Houphouët-Boigny University, Abidjan, Côte d’Ivoire
Department of Water and Food Analysis, National Institute of Public Hygiene, Abidjan, Côte d’Ivoire; Department of Analytical Sciences and Public Health, Pharmaceutical and Biological Sciences Faculty, Félix Houphouët-Boigny University, Abidjan, Côte d’Ivoire
Department of Water and Food Analysis, National Institute of Public Hygiene, Abidjan, Côte d’Ivoire; Department of Analytical Sciences and Public Health, Pharmaceutical and Biological Sciences Faculty, Félix Houphouët-Boigny University, Abidjan, Côte d’Ivoire
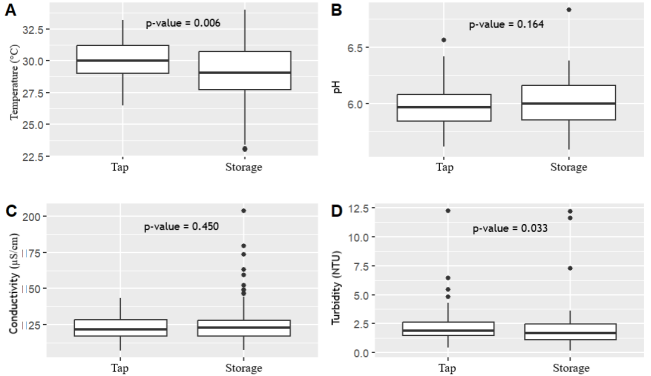
Figure 1. Comparison between tap water and stored water in terms of temperature, pH, conductivity and turbidity (Wilcoxon rank sum test p-value for α =5%).
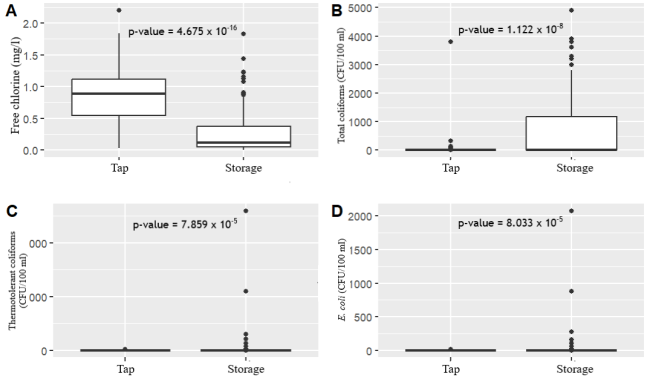
Figure 2. Comparison between tap water and stored water in terms of free chlorine, total coliforms, thermotolerant coliforms and E. coli (Wilcoxon rank sum test p-value for α =5%).
Information

