Abstract
Albuminuria is the gold standard for the screening of microalbuminuria, a biomarker of early onset of nephropathy during sickle cell anemia (SCA). Nephropathy increase morbidity and mortality of SCA in the absence of appropriate treatment. However, albuminuria is not readily available or affordable in resource-limited countries, so in 2012 Kidney Diseases Improving Global Outcomes (KDIGO) proposed using proteinuria at a threshold of 150 mg/g urine creatinine to screen for microalbuminuria in these settings. The aim of this study was therefore to assess the performance of proteinuria in screening microalbuminuria in sub-Saharan Senegalese sickle cell patients. Albuminuria in recruited SS sickle cell patients was expressed as a urine albumin-to-creatinine ratio (UACR) and proteinuria as a urine proteins-to-creatinine ratio (UPCR). The prevalence of microalbuminuria, Cohen's kappa coefficient and areas under the curve (AUC) were then determined to assess the performance of proteinuria in detecting microalbuminuria. A total of 150 patients with a median age of 20 years [minimum-maximum: 4-57] and a female proportion of 51.33% were included in the study. Microalbuminuria was present in 42.38% (n=64) of subjects according to the UPCR. The Cohen's kappa coefficient was 0.41 [IC95%: 0.27-0.56] and the AUC 0.71 [IC95%: 0.64 - 0.81] with UPCR 150mg/g. The best Cohen's kappa coefficient and AUC were observed with an UPCR threshold of 135 mg/g. Our results confirm that proteinuria is useful in screening for microalbuminuria and show that RPCU 135 mg/g would be the optimal cut-off for detecting microalbuminuria in Senegalese sickle cell anemia patients.
Keywords
Sickle Cell Anemia, Kidney Disease, Albuminuria, Proteinuria
1. Introduction
Sickle cell anaemia (SCA) is an autosomal recessive inherited disease
. It is due to a point variation in the β globin gene on chromosome 11
. The variation confers a polymerization property on the haemoglobin S thus formed, promoting red blood cell sickle-shaped formation, which leads to the obstruction of small-caliber vessels, resulting in hypoxia and acute tissue damage and chronic organ dysfunction
. It is estimated that, every year, 300 000 births are affected by sickle cell disease (SCD), the three quarters of which are recorded in Sub-Saharan Africa and, in the coming decades, this number is expected to considerably rise
| [3] | P. B. Piel, A. P. Patil, R. E. Howes, et al., Global epidemiology of sickle haemoglobin in neonates: a contemporary geostatistical model-based map and population estimates, Lancet. 381 (2013) 142‑151. https://doi.org/10.1016/S0140-6736(12)61229-X |
[3]
.
Sickle cell nephropathy (SCN) is a serious chronic complication of the disease
. It starts in infancy and may lead to an end-stage renal failure (ESRD) which, among chronic complications, is the first cause of death among Senegalese sickle-cell patients
| [7] | D. R. Powars, D. D. Elliott-Mills, L. Chan, et al., Chronic Renal Failure in Sickle Cell Disease: Risk Factors, Clinical Course, and Mortality, Ann. Intern. Med. 115 (1991) 614‑620. https://doi.org/10.7326/0003-4819-115-8-614 |
| [8] | V. K. Derebail, Q. Zhou, E. J. Ciccone et al., Rapid decline in estimated glomerular filtration rate is common in adults with sickle cell disease and associated with increased mortality, Br. J. Haematol. 186 (2019) 900-907. https://doi.org/10.1111/bjh.16003 |
| [9] | M. Seck, O. Ba, B. F. Faye, et al., Homozygous sickle cell disease related mortality in Senegal (2011-2020), EJHaem. 2 (2021) 711-715. https://doi.org/10.1002/jha2.273 |
[7-9]
. ESRD requiring a dialysis and/or a renal transplant occurs among 4 to 18% of the sickle cell patients and its occurrence shortens the patients’ longevity with a 4-year survival time and a median age of death of 27 years
| [7] | D. R. Powars, D. D. Elliott-Mills, L. Chan, et al., Chronic Renal Failure in Sickle Cell Disease: Risk Factors, Clinical Course, and Mortality, Ann. Intern. Med. 115 (1991) 614‑620. https://doi.org/10.7326/0003-4819-115-8-614 |
| [10] | D. R. Powars, L. S. Chan, A. Hiti et al., Outcome of sickle cell anemia: a 4-decade observational study of 1056 patients, Medicine. 84 (2005) 363‑376. https://doi.org/10.1097/01.md.0000189089.45003.52 |
[7, 10]
. It is therefore important to detect sickle cell nephropathy (SCN) early so as to slow down or hinder its progress towards kidney failure by notably using hydroxyurea and converting enzyme inhibitors
| [11] | V. Audard, P. Bartolucci et T. Stehlé, Sickle cell disease and albuminuria: recent advances in our understanding of sickle cell nephropathy, Clin. Kidney J. 10 (2017) 475‑478. https://doi.org/10.1093/ckj/sfx027 |
[11]
.
Monitoring renal function in subjects at particular risk of developing chronic kidney disease, notably SCD patients, involves screening for microalbuminuria (grade A2 albuminuria), which is carried out by measuring urinary albumin using a method based on a monoclonal antibody specifically directed against albumin
| [12] | Kidney Disease: Improving Global Outcomes (KDIGO) CKD Work Group, KDIGO 2012 Clinical Practice Guideline for the Evaluation and Management of Chronic Kidney Disease. Kidney Int Suppl. 3 (2013) 1-150, p31. https://doi.org/10.1038/kisup.2012.73 |
[12]
. This method being relatively expensive and poorly accessible in countries with limited financial resources, the Kidney Disease Improving Global Outcomes (KDIGO) suggests using proteinuria as an alternative for want of having albuminuria to screen out pathological albuminuria (microalbuminuria and macroalbuminuria or grade A2 and grade A3 albuminuria respectively)
| [12] | Kidney Disease: Improving Global Outcomes (KDIGO) CKD Work Group, KDIGO 2012 Clinical Practice Guideline for the Evaluation and Management of Chronic Kidney Disease. Kidney Int Suppl. 3 (2013) 1-150, p31. https://doi.org/10.1038/kisup.2012.73 |
| [13] | E. O. Gosmanova, S. Zaidi, J. Y. Wan, et al. Prevalence and progression of chronic kidney disease in adult patients with sickle cell disease, J Investig Med. 62 (2014) 804-807. https://doi.org/10.1097/01.JIM.0000446836.75352.72 |
[12, 13]
. According to KDIGO indeed, a proteinuria > 150 mg/g of urinary creatinine does not only indicate a pathological proteinuria but also the presence of, at least, a grade A2 albuminuria
| [12] | Kidney Disease: Improving Global Outcomes (KDIGO) CKD Work Group, KDIGO 2012 Clinical Practice Guideline for the Evaluation and Management of Chronic Kidney Disease. Kidney Int Suppl. 3 (2013) 1-150, p31. https://doi.org/10.1038/kisup.2012.73 |
| [13] | E. O. Gosmanova, S. Zaidi, J. Y. Wan, et al. Prevalence and progression of chronic kidney disease in adult patients with sickle cell disease, J Investig Med. 62 (2014) 804-807. https://doi.org/10.1097/01.JIM.0000446836.75352.72 |
[12, 13]
. Several other thresholds for defining pathological proteinuria, including 130 mg/g, 180 mg/g and 200 mg/g can be found in the literature
| [14] | E. J. Lamb, G. R. D. Jones, Kidney function tests, In: N. Rifai, A. R. Horvath, C. T. Wittwer (Eds), Tietz fundamentals of clinical chemistry and molecular diagnostics, Elsevier Inc., St Louis, 2018, 359–376. |
| [15] | A. Bökenkamp, Proteinuria-take a closer look!, Pediatr. Nephrol. 35 (2020) 533-541. https://doi.org/10.1007/s00467-019-04454-w |
| [16] | R. J. Hogg, R. J. Portman, D. Milliner, et al., Evaluation and management of proteinuria and nephrotic syndrome in children: recommendations from a pediatric nephrology panel established at the National Kidney Foundation conference on proteinuria, albuminuria, risk, assessment, detection, and elimination (PARADE), Pediatrics. 105 (2000) 1242-1249. https://doi.org/10.1542/peds.105.6.1242 |
| [17] | B. Viteri, J. Reid-Adam, Hematuria and Proteinuria in Children, Pediatr. Rev. 39 (2018) 573-587. https://doi.org/10.1542/pir.2017-0300 |
[14-17]
. It is in that context that the present study is carried out in view of evaluating the performance of proteinuria in screening for pathological albuminuria among patients living with sickle cell anaemia in Senegal.
2. Design and Methods
2.1. Ethical Considerations
The study followed a protocol that complied with the ethical guidelines of the Declaration of Helsinki and was approved by the ethics committee of Cheikh Anta Diop University in Dakar (0312/2018/CER/UCAD). A free and informed consent form was obtained from all adult participants prior to enrolment. Parental or guardian approval was required for the participation of minors.
2.2. Type of Study and Framework
The study was a cross-sectional observational-analytic study. Patients were recruited systematically at random during their follow-up medical visit. Recruitment took place at the clinical unit of the National Blood Transfusion Center (CNTS) and the Ambulatory Care Unit for Children and Adolescents with Sickle Cell Disease (USAD) located at the Albert Royer National Children’s Hospital (CHNEAR).
2.3. Study Population and Recruitment Criteria
The study population consisted of adult and children aged at least 4 years living with sickle cell anaemia in an intercritical state and regularly followed at the CNTS or USAD. Patients known to be diabetic or suffering from other pathologies likely to induce chronic renal disease, pregnant or breast-feeding women and children under 4 years of age were not included in the study.
2.4. Determination of Anthropometric Parameters
Patients' age and sex were recorded during the clinical history, height measured with a wall chart, weight determined using a scale and body mass index (BMI) calculated using Quetelet formula, BMI = weight (kg)/height2 (m2). Any subject under the age of 20 years was considered a youth, otherwise an adult. Systolic and diastolic blood pressures were measured using a blood pressure monitor.
2.5. Determination of Biological Parameters
All subjects included in the study had a random midstream urine specimens collected in a sterile urinary pot. Quantitative determination of biological indices was carried out using Biosystems reagents (Biosystems reagents & instruments; Barcelona, Spain) on a Mindray-BS-380 Biochemistry analyzer (Mindray, Créteil, France) in CHNEAR core laboratory. Creatininuria, albuminuria and proteinuria were determined spectrophotometrically. Creatininuria was determined by an enzymatic method using the creatininase/creatinase/sarcosine oxidase/peroxidase system. The intensity of the pink-red coloration, read in the visible wavelength ʎ = 500 nm, is proportional to the quantity of hydrogen peroxide formed and therefore to the initial concentration of creatinine present in the test sample. Urinary determination was performed on urine diluted 1:50, then the diluted creatinine concentration was multiplied by the inverse of the dilution to obtain the creatinine concentration of the undiluted urine. Dilution was not used to determine urine protein or albumin concentrations. Urinary proteins were assayed using the pyrogallol red colorimetric method in the presence of molybdate, based on the reaction of proteins, in an acid medium, with pyrogallol red combined with molybdate to form a blue-colored complex. The intensity of this blue coloration, measured at wavelength ʎ = 600 nm, is directly proportional to protein concentration in the urine. Urinary albumin was determined by the immunoturbidimetric method using latex particles coated with albumin-specific antibodies. This method is based on the agglutination reaction between albumin present in the urine and latex particles coated with specific antibodies directed against albumin. The intensity of turbidity induced by immuno-agglutination of the particles, quantifiable at wavelength ʎ =535 nm, is proportional to the concentration of albumin in the urine.
Following the assays, the urine protein-to-creatinine ratio (UPCR) and the urine albumin-to-creatinine ratio (UACR) were calculated for each patient by dividing the urine protein or albumin concentration in mg/l by the urine creatinine concentration in g/l, respectively. UPCR and UACR were then expressed in mg/g. UACR ˂ 30mg/g or UPCR ˂ 150mg/g defined grade A1 albuminuria, formerly known as normoalbuminuria
| [12] | Kidney Disease: Improving Global Outcomes (KDIGO) CKD Work Group, KDIGO 2012 Clinical Practice Guideline for the Evaluation and Management of Chronic Kidney Disease. Kidney Int Suppl. 3 (2013) 1-150, p31. https://doi.org/10.1038/kisup.2012.73 |
| [13] | E. O. Gosmanova, S. Zaidi, J. Y. Wan, et al. Prevalence and progression of chronic kidney disease in adult patients with sickle cell disease, J Investig Med. 62 (2014) 804-807. https://doi.org/10.1097/01.JIM.0000446836.75352.72 |
[12, 13]
. A 30 ≤ UACR < 300 mg/g or 150 ≤ UPCR < 500 mg corresponded to grade A2 albuminuria or microalbuminuria
| [12] | Kidney Disease: Improving Global Outcomes (KDIGO) CKD Work Group, KDIGO 2012 Clinical Practice Guideline for the Evaluation and Management of Chronic Kidney Disease. Kidney Int Suppl. 3 (2013) 1-150, p31. https://doi.org/10.1038/kisup.2012.73 |
| [13] | E. O. Gosmanova, S. Zaidi, J. Y. Wan, et al. Prevalence and progression of chronic kidney disease in adult patients with sickle cell disease, J Investig Med. 62 (2014) 804-807. https://doi.org/10.1097/01.JIM.0000446836.75352.72 |
[12, 13]
. A UACR ≥ 300 mg/g or a UPCR ≥ 500 mg/g indicated grade A3 albuminuria or macroalbuminuria
| [12] | Kidney Disease: Improving Global Outcomes (KDIGO) CKD Work Group, KDIGO 2012 Clinical Practice Guideline for the Evaluation and Management of Chronic Kidney Disease. Kidney Int Suppl. 3 (2013) 1-150, p31. https://doi.org/10.1038/kisup.2012.73 |
| [13] | E. O. Gosmanova, S. Zaidi, J. Y. Wan, et al. Prevalence and progression of chronic kidney disease in adult patients with sickle cell disease, J Investig Med. 62 (2014) 804-807. https://doi.org/10.1097/01.JIM.0000446836.75352.72 |
[12, 13]
. This interpretation proposed by the KDIGO enabled two groups of subjects to be defined: a first group presenting normal albuminuria with a UACR ˂ 30 mg/g or a UPCR ˂150 mg/g, and a second group presenting pathological albuminuria with a UACR ≥ 30 mg/g or a UPCR ≥ 150 mg/g
| [12] | Kidney Disease: Improving Global Outcomes (KDIGO) CKD Work Group, KDIGO 2012 Clinical Practice Guideline for the Evaluation and Management of Chronic Kidney Disease. Kidney Int Suppl. 3 (2013) 1-150, p31. https://doi.org/10.1038/kisup.2012.73 |
| [13] | E. O. Gosmanova, S. Zaidi, J. Y. Wan, et al. Prevalence and progression of chronic kidney disease in adult patients with sickle cell disease, J Investig Med. 62 (2014) 804-807. https://doi.org/10.1097/01.JIM.0000446836.75352.72 |
[12, 13]
. Pathological albuminuria’s threshold definition value according to the UPCR was then displaced as per literature data from 150 to 130 then to 180 and to 200 mg/g
| [14] | E. J. Lamb, G. R. D. Jones, Kidney function tests, In: N. Rifai, A. R. Horvath, C. T. Wittwer (Eds), Tietz fundamentals of clinical chemistry and molecular diagnostics, Elsevier Inc., St Louis, 2018, 359–376. |
| [15] | A. Bökenkamp, Proteinuria-take a closer look!, Pediatr. Nephrol. 35 (2020) 533-541. https://doi.org/10.1007/s00467-019-04454-w |
| [16] | R. J. Hogg, R. J. Portman, D. Milliner, et al., Evaluation and management of proteinuria and nephrotic syndrome in children: recommendations from a pediatric nephrology panel established at the National Kidney Foundation conference on proteinuria, albuminuria, risk, assessment, detection, and elimination (PARADE), Pediatrics. 105 (2000) 1242-1249. https://doi.org/10.1542/peds.105.6.1242 |
| [17] | B. Viteri, J. Reid-Adam, Hematuria and Proteinuria in Children, Pediatr. Rev. 39 (2018) 573-587. https://doi.org/10.1542/pir.2017-0300 |
[14-17]
. Pathological albuminuria’s optimal threshold definition value of our own series was 134 mg/g according to the Liu method and 135 mg/g according to the Area Under the Curve method (AUC) (supplemental data)
. The pathological albuminuria’s optimal threshold definition of our own series represented the UPCR value for which the UPCR’s sensitivity and specificity sum was maximal
.
2.6. Statistical Analyses
The prevalences of pathological albuminuria in the series were then determined using the UPCR at various thresholds then compared to the one obtained with the UACR deemed to be the reference method. The comparison was made with the khi-deux test and the meaningfulness threshold of the test was set at a p < 0.05. The performance of the UPCR at the various pathological albuminuria definition thresholds in relation to the UACR were assessed thanks to areas under the curve (AUC) obtained with receiver-operating curve (ROC curve) analysis, the coefficient of agreement and the Cohen’s kappa coefficient
| [18] | K. Linnet, P. M. Bossuyt, K. G. Moons, et al., Quantifying the accuracy of a diagnostic test or marker, Clin Chem. 58 (2012) 1292-301. https://doi.org/10.1373/clinchem.2012.182543 |
| [20] | T. J. Zhou, S. Raza, K. P. Nelson, et al. Methods of assessing categorical agreement between correlated screening tests in clinical studies, J Appl Stat. 48 (2021) 1861–1881. https://doi.org/10.1080/02664763.2020.1777394 |
| [21] | K. G. Moons, J. A. de Groot, K. Linnet, et al., Quantifying the added value of a diagnostic test or marker, Clin Chem. 58 (2012) 1408-1417. https://doi.org/10.1373/clinchem.2012.182550 |
| [22] | M. Li, Q. Gao, T. Yu, et al. Kappa statistic considerations in evaluating inter-rater reliability between two raters: which, when and context matters, BMC Cancer. 23 (2023) 799. https://doi.org/10.1186/s12885-023-11325-z |
| [23] | J. Cohen, A Coefficient of Agreement for Nominal Scales, Educ. Psychol. 20 (1960) 27-46. https://doi.org/10.1177/001316446002000104 |
[18, 20-23]
. The UPCR was deemed to be non-informative if AUC was equal to 0.50; less accurate if 0.50 < AUC ≤ 0.70; moderately accurate if 0.70 < AUC ≤ 0.9; highly accurate, if 0.9 ≤ AUC < 1, and perfect tests in relation to the UACR if AUC = 1
| [24] | M. Greiner, D. Pfeiffer, R. D. Smith, et al., Principles and practical application of the receiver-operating characteristic analysis for diagnostic tests, Prev Vet Med. 45 (2000) 23–41. https://doi.org/10.1016/S0167-5877(00)00115-X |
[24]
. The match between the UPCR and the UACR was deemed to be poor if the kappa coefficient (κ) was kappa < 0; slight if 0 ≤ kappa < 0.20; fair if 0.20 < kappa ≤ 0,40; moderate if 0.40 < kappa ≤ 0.60; substantial if 0.60 < kappa ≤ 0,80; almost perfect if 0.80 < kappa ≤ 1
. The statistical analysis was made with Software STATA version 2015 from data collected on Microsoft Excel version 2013.
3. Results
3.1. Anthropometric and Biological Characteristics of the Study Population
Table 1. Base-line anthropometric and biological parameters.
| Median (Min – Max) | 25 – 75th percentiles | Observations |
Age | 20 (4 – 57) | 12 – 25 | 150 |
Age ≤ 20 years, % (n) | 54% (81) | XXX |
Female sex, % (n) | 51,33% (77) | XXX |
SBP, mmHg | 110 (80 – 140) | 110 - 100 |
DBP, mmHg | 70 (40 – 110) | 70 – 70 |
UACR, mg/g | 26 (3 – 329) | 16 – 49 |
UPCR, mg/g | 157 (17 – 2958) | 71 - 304 |
SBP, mmHg. DBP, mmHg. Hb, g/dl (x 0.6206 mmol/l).
UACR, mg/g (x 0.113 mg/mmol). UPCR, mg/g (x 0.113 mg/mmol).
Min: minimum. Max: maximum. BMI: body mass index.
SBP: systolic blood pressure. DBP: diastolic blood pressure.
UACR: urinary albumin/creatinine ratio. UPCR: urinary protein /creatinine ratio.
A total of 150 patients living with SCA were recruited. The median age was 20 years (4 years minimum; 57 years maximum). Young subjects (54%, n = 81) and female (51.33%, n = 77) were mostly represented (
Table 1).
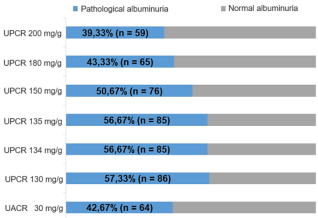
Figure 1. Prevalence of microalbuminuria according to UACR and UPCR at various thresholds.
UPCR: Urinary Protein / Creatinine Ratio. UACR: Urinary Albumin / Creatinine Ratio.
3.2. Prevalences of Pathological Albuminuria
The prevalences of pathological albuminuria according to the UACR, the reference method, and according to the UPCR with various thresholds are shown in
Figure 1. The pathological albuminuria’s prevalence obtained with the UACR was 42.67%. This prevalence was superimposable to the one obtained with the UPCR threshold = 180 mg/g which was 43.33%. The prevalence of pathological albuminuria determined by the thresholds of 130, 134, 135 or 150 mg/g of UPCR was higher than the one obtained with the UACR. On the other hand, the prevalence was lower than that determined by the UACR when the UPCR threshold was set at 200 mg/g. The prevalence of pathological albuminuria obtained with thresholds of 134 and 135 mg/g of UPCR were identical.
3.3. Comparison of Proteinuria and Albuminuria Using AUC and Kappa Coefficients
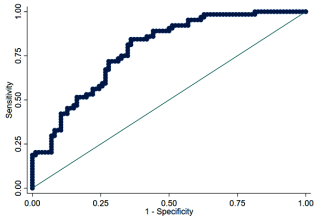
The UPCR ROC curve as compared with the reference method for screening pathological albuminuria (UACR) is exhibited in
Figure 2. Curve analysis showed an area under the curve (AUC) of 78.60% (95%CI: 71.46% - 85.73%). Sensitivity-specificity pairs sum have suggested that the threshold UPCR = 135 mg/g was the optimal cut-off for our series (supplemental data). Applying the Liu method has indicated that the threshold UPCR = 134 mg/g was rather the optimal cut-off of the series (supplemental data).
Figure 2. Receiver operating curve (ROC curve) of UPCR in screening for microalbuminuria with UACR as a gold standard. Curve analysis showed an area under the curve (AUC) of 78.60% (95%CI: 71.46% - 85.73%).
UPCR: Urinary Protein / Creatinine Ratio. UACR: Urinary Albumin / Creatinine Ratio.
Table 2. Sensitivity, specificity and area under the curve at various UPCR thresholds with UACR as a gold standard.
UPCR cut-offs (mg/g) | Frequency | Sensitivity (%) | Specificity (%) | AUC (95% CI) |
130 | 150 | 84,38 | 62,79 | 0,736 (0,668-0,804) |
134 | 84,38 | 63,95 | 0,742 (0,674-0,810) |
135 | 84,38 | 63,95 | 0,742 (0,674-0,810) |
150 | 75, 0 | 67,44 | 0,712 (0,639-0,785) |
180 | 65,63 | 73,26 | 0,694 (0,619-0,770) |
200 | 57,81 | 74,42 | 0,661 (0,585-0,738) |
UPCR: Urinary Protein / Creatinine Ratio. UACR: Urinary Albumin / Creatinine Ratio.
AUC: Area Under the Curve. CI: Confidence Interval
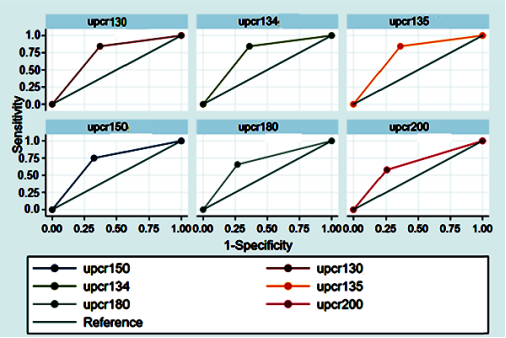
The ROC curves of the UPCR to the thresholds of 134 and 135 mg/g but also to the thresholds reported in the literature (130, 150, 180 and 200 mg/g) are presented in
Figure 3. The results of the UPCR sensitivity, specificity and the AUC to the various threshold values as compared with the UACR are summed up in
Table 2. Analyzing the results of
Figure 2 and
Table 2 has helped note that the threshold values of UPCR of 180 and 200 mg/g showed greater specificity (73.26% and 74.42% ) associated to lesser sensitivity (65.63% and 57.81%) and the lowest AUC 0.694 [95%CI: 0.619-0.770] and 0.661 [95%CI: 0.585-0.738]. On the other hand, the thresholds of UPCR 134 and 135 mg/g indicated the best compromise in terms of sensitivity and specificity, that is the best sums of sensitivity (84.38%) and specificity (63.95%) but also the best AUC 0.742 [95%CI: 0.674-0.810] giving thereby more accurate results in adequacy with the UACR. The AUC obtained with the threshold of UPCR 150 mg/g was 0.712 [0.639-0.785], the sensitivity, 75% and the specificity, 67.44%.
Table 3. Agreement between UPCR and UACR at various UPCR thresholds.
UPCR cut-offs (mg/g) | Frequency | Agreement coefficient (%) | Cohen’s kappa coefficient (95 % CI) | p-value |
130 | 150 | 72,00 | 0,452 [0,317-0,587] | < 0,001 |
134 | 72,67 | 0,464 [0,329-0,599] | < 0,001 |
135 | 72,67 | 0,464 [0,329-0,599] | < 0,001 |
150 | 70,67 | 0,414 [0,271-0,558] | < 0,001 |
180 | 70,00 | 0,388 [0,239-0,537] | < 0,001 |
200 | 67,33 | 0,326 [0,173-0,479] | < 0,001 |
UPCR: Urinary Protein / Creatinine Ratio. AUC: Area Under the Curve.
CI: Confidence Interval
Table 3 shows that the thresholds of UPCR 134 and 135 mg/g had the best agreement (72.67%) and kappa (0.464) coefficients as compared with the other thresholds notably the threshold of UPCR 150 mg/g the agreement and kappa coefficients of which were respectively 70.67% and 0.414.
4. Discussion
Since 2012, KDIGO has been proposing the use of proteinuria (UPCR) as an alternative to albuminuria (UACR) to screen for pathological albuminuria (grade A2 or grade A3 albuminuria) in countries with limited financial resources, where albuminuria can be relatively expensive and not widely available
| [12] | Kidney Disease: Improving Global Outcomes (KDIGO) CKD Work Group, KDIGO 2012 Clinical Practice Guideline for the Evaluation and Management of Chronic Kidney Disease. Kidney Int Suppl. 3 (2013) 1-150, p31. https://doi.org/10.1038/kisup.2012.73 |
| [13] | E. O. Gosmanova, S. Zaidi, J. Y. Wan, et al. Prevalence and progression of chronic kidney disease in adult patients with sickle cell disease, J Investig Med. 62 (2014) 804-807. https://doi.org/10.1097/01.JIM.0000446836.75352.72 |
[12, 13]
. Indeed, according to the KDIGO, a UPCR > 150 mg/g creatinine indicates at least grade A2 albuminuria
| [12] | Kidney Disease: Improving Global Outcomes (KDIGO) CKD Work Group, KDIGO 2012 Clinical Practice Guideline for the Evaluation and Management of Chronic Kidney Disease. Kidney Int Suppl. 3 (2013) 1-150, p31. https://doi.org/10.1038/kisup.2012.73 |
| [13] | E. O. Gosmanova, S. Zaidi, J. Y. Wan, et al. Prevalence and progression of chronic kidney disease in adult patients with sickle cell disease, J Investig Med. 62 (2014) 804-807. https://doi.org/10.1097/01.JIM.0000446836.75352.72 |
[12, 13]
. However, we are not aware of any study that has assessed the validity of this KDIGO proposal in Africa, particularly in Senegal, a country with particularly limited financial resources. Consequently, the present work was carried out with the aim of evaluating the performance of UPCR in detecting pathological albuminuria (grade A2 and grade A3 albuminuria) in the context of the sickle cell anaemia, using UACR as the gold standard.
To that purpose, urinary albumin has been measured by an immunoturbidimetric assay using an antibody specifically directed against the albumin in the urine. The prevalence of the pathological albuminuria found was 42.67% (
Figure 1). Such non negligible prevalence was superimposable to the one described and already discussed in the Article
. Proteinuria, for its part, was determined by the pyrogallol red - molybdate method, a non-specific colorimetric method that measures all proteins present in urine, including albumin. By expressing this proteinuria in the form of UPCR, a pathological albuminuria prevalence of 43.33% superimposed on that determined by UACR was obtained with a UPCR threshold not of 150 mg/g as proposed by KDIGO, but rather with a threshold of 180 mg/g (
Figure 1). This could be explained by the results of the study by Ndour and coworkers who found that the upper limit of the reference interval for proteinuria in a supposedly healthy Senegalese population should be 180 mg/g
. This threshold of 180 mg/g also appears to be the one adopted by Bökenkamp in his review of the literature
. The prevalence of pathological albuminuria became lower than that determined by UACR if the UPCR threshold was set at 200 mg/g (
Figure 1). In contrast, the prevalence of pathological albuminuria determined by a UPRC threshold of 130, 134, 135 or 150 mg/g was higher than that obtained with UACR (
Figure 1). This could be explained by a higher number of false positives if the UPCR threshold was set at these cut-offs values. The increase in the number of false positives could be explained not only by the low threshold values, but also probably by the high prevalence of proteinuria of tubular origin in the Senegalese sickle cell population described in the study by Ndour and coworkers
. Indeed, the tubular proteinuria is a proteinuria where albumin is in the minority as compared with proteins of low-molecular weight
. As a consequence, the UACR measuring specifically albumin is deemed not to be as sensitive, in this context, as the UPCR which measures all the proteins found in the urine.
The UPCR cut-offs values of 180 and 200 mg/g showed the highest specificity, but also the lowest sensitivity and AUC (
Figure 3,
Table 2). Their use could therefore delay early detection of pathological albuminuria and increase the proportion of false negatives. Adopting 180 mg/g or 200 mg/g as cut-offs values could therefore result in a delay in the management of renal impairment in sickle cell patients. On the other hand, the best compromise in terms of sensitivity and specificity,
i.e. the best sum of sensitivity and specificity as well as the best AUC were observed with the UPCR cut-offs of 134 and 135 mg/g which were determined using Liu's method and the AUC method respectively (
Figure 2). These UPCR cut-offs offered more results in line with the UACR. In view of these observations these two cut-offs which lead to exactly identical results would be more appropriate in sickle cell populations than the 150 mg/g cut-off proposed by KDIGO (
Figure 3,
Table 2)
| [12] | Kidney Disease: Improving Global Outcomes (KDIGO) CKD Work Group, KDIGO 2012 Clinical Practice Guideline for the Evaluation and Management of Chronic Kidney Disease. Kidney Int Suppl. 3 (2013) 1-150, p31. https://doi.org/10.1038/kisup.2012.73 |
[12]
. This reduction of the cut-off from 150 mg/g to 135 mg/g in the Senegalese sickle cell population could be explained by the fact that loss of urine concentration ability is very common in this group of patients
. This loss of urine concentration ability would result in the emission of diluted urine reducing the concentration of proteins in the urine leading in turn to a reduction in the UPCR cut-off.
In addition, the best coefficient of agreement between UACR and UPCR (72.67%) was obtained with UPCR cut-off of 134 and 135 mg/g (
Table 3). This coefficient of agreement was superimposed on that (72%) obtained with the UPCR cut-off of 130 mg/g (
Table 3)
| [14] | E. J. Lamb, G. R. D. Jones, Kidney function tests, In: N. Rifai, A. R. Horvath, C. T. Wittwer (Eds), Tietz fundamentals of clinical chemistry and molecular diagnostics, Elsevier Inc., St Louis, 2018, 359–376. |
[14]
. The coefficient of agreement observed with the UPCR cut-off of 134 and 135 mg/g is thus better than those obtained with the UPCR threshold of 150 mg/g proposed by the KDIGO or with the UPCR threshold of 180 mg/g found in the study of Ndour and coworkers and proposed by Bökenkamp
. The lowest coefficient of agreement of our series was observed with the UPCR threshold of 200 mg/g, the cut-off value for defining pathological proteinuria according to Hogg as well as Viteri and coworkers
| [16] | R. J. Hogg, R. J. Portman, D. Milliner, et al., Evaluation and management of proteinuria and nephrotic syndrome in children: recommendations from a pediatric nephrology panel established at the National Kidney Foundation conference on proteinuria, albuminuria, risk, assessment, detection, and elimination (PARADE), Pediatrics. 105 (2000) 1242-1249. https://doi.org/10.1542/peds.105.6.1242 |
| [17] | B. Viteri, J. Reid-Adam, Hematuria and Proteinuria in Children, Pediatr. Rev. 39 (2018) 573-587. https://doi.org/10.1542/pir.2017-0300 |
[16, 17]
.
The kappa coefficient of 0.464 obtained with the UPCR thresholds of 134 and 135 mg/g was to be considered moderate given that it was between 0.40 and 0.60
. However, it represented the highest kappa coefficient observed with the different UPCR thresholds considered in this study. It was still comparable to those obtained with the UPCR threshold of 130 mg/g, which was 0.452, or with the UPCR threshold of 150 mg/g, which was equal to 0.414 (
Table 3). Fair kappa coefficients in the range 0.20 - 0.40 were found when the UPCR cut-off was set at 180 or 200 mg/g (
Table 3)
.
From these observations concerning the AUC and the kappa coefficient, it could be deduced that UPCR showed modest performances to replace UACR in the screening for pathological albuminuria in Senegalese patients living with SCA. Nevertheless, it would be possible to improve the performance of UPCR as a reliable screening tool for pathological albuminuria in this group of patients by using not the cut-off proposed by KDIGO but the threshold of 135 mg/g
| [12] | Kidney Disease: Improving Global Outcomes (KDIGO) CKD Work Group, KDIGO 2012 Clinical Practice Guideline for the Evaluation and Management of Chronic Kidney Disease. Kidney Int Suppl. 3 (2013) 1-150, p31. https://doi.org/10.1038/kisup.2012.73 |
[12]
.
The limitations of this study include the fact that the assays were based on a single urine sample instead of at least two samples taken three months apart.
5. Conclusion
Our results have shown a high prevalence of pathological albuminuria among patients living with SCA in Senegal. They also highlighted a match between the UACR results and those of the UPCR at the threshold of 135 mg/g, which is moderate but accurate according to AUC and the kappa coefficient analysis. The UPCR with a threshold of 135 mg/g may then be used as an alternative in screening for pathological albuminuria in particular for want of having the UACR in the countries where albuminuria determination is relatively onerous and not widely available. However, when the UPCR reveals a pathological albuminuria, it would be necessary to have the UACR confirm it before proceeding with any therapeutic management.
Abbreviations
AUC | Area Under the Curve Method |
BMI | Body Mass Index |
CHNEAR | Albert Royer National Children’s Hospital |
CNTS | National Blood Transfusion Center |
DBP | Diastolic Blood Pressure |
ESRD | End-Stage Renal Failure |
KDIGO | Kidney Disease Improving Global Outcomes |
Max | Maximum |
Min | Minimum |
ROC | Receiver Operating Curve |
SBP | Systolic Blood Pressure |
SCA | SICKLE Cell Anaemia |
SCD | Sickle Cell Disease |
SCN | Sickle Cell Nephropathy |
UACR | Urine Albumin-to-Creatinine Ratio |
UPCR | Urine Protein-To-Creatinine Ratio |
USAD | Ambulatory Care Unit for Children and Adolescents with Sickle Cell Disease |
Author Contributions
Conception: El Hadji Malick Ndour, Rokhaya Dione, Sokhna Mara
Design: El Hadji Malick Ndour, Rokhaya Dione, Sokhna Mara
Supervision: Fatou Gueye-Tall, Papa Madieye Gueye, Philomene Lopez-Sall, Aynina Cisse
Funding: El Hadji Malick Ndour, Philomene Lopez-Sall, Aynina Cisse
Materials: Moussa Seck, Indou Deme-Ly, Aliou Abdoulaye Ndongo, Saliou Diop, Ibrahima, Diagne
Data Collection and/or Processing: El Hadji Malick Ndour, Rokhaya Dione, Sokhna Mara
Analysis and/or Interpretation: Analysis and/or Interpretation, El Hadji Malick Ndour, Rokhaya Dione, Sokhna Mara, Indou Deme-Ly, Aliou Abdoulaye Ndongo
Writer: El Hadji Malick Ndour, Rokhaya Dione
Critical Review: Fatou Gueye-Tall, Papa Madieye Gueye, Moussa Seck, Indou Deme-Ly, Helene Ange Therese Sagna-Bassene, Rokhaya Dione, Aliou Abdoulaye Ndongo, Nene Oumou Kesso Barry, Moustapha Djite, Saliou Diop, Ibrahima Diagne, Philomene Lopez Sall, Aynina Cisse
Funding
The clinical chemistry experiments of the study were funded by The African Center of Excellence for Maternal and Child Health «Centre d’Excellence Africain pour la Santé de la Mère et del’Enfant (CEA-SAMEF, http://ceasamef.sn, N° 000099/2018/JCM/KND) », Cheikh Anta Diop University of Dakar, Senegal.
Conflicts of Interest
The authors declare no conflicts of interest.
References
| [1] |
R. E. Ware, M. de Montalembert, L. Tshilolo, M. R. Abboud, Sickle Cell Disease, Lancet. 390 (2017) 311–323.
https://doi.org/10.1016/S0140-6736(17)30193-9
|
| [2] |
P. Sundd, M. T. Gladwin, E. M. Novelli, Pathophysiology of Sickle Cell Disease, Annu. Rev. Pathol. 14 (2019) 263-292.
https://doi.org/10.1146/annurev-pathmechdis-012418-012838
|
| [3] |
P. B. Piel, A. P. Patil, R. E. Howes, et al., Global epidemiology of sickle haemoglobin in neonates: a contemporary geostatistical model-based map and population estimates, Lancet. 381 (2013) 142‑151.
https://doi.org/10.1016/S0140-6736(12)61229-X
|
| [4] |
K. R. López, M. P. R. Andrés, Kidney abnormalities in sickle cell disease, Nefrologia. 31 (2011) 591–601.
https://doi.org/10.3265/Nefrologia.pre2011.Feb.10737
|
| [5] |
A. M. Becker, Sickle cell nephropathy: challenging the conventional wisdom, Pediatr. Nephrol. 26 (2011) 2099‑2109.
https://doi.org/10.1007/s00467-010-1736-2
|
| [6] |
K. A. Nath, R. P. Hebbel, Sickle cell disease: renal manifestations and mechanisms, Nat. Rev. Nephrol. 11 (2015) 161‑171.
https://doi.org/10.1038/nrneph.2015.8
|
| [7] |
D. R. Powars, D. D. Elliott-Mills, L. Chan, et al., Chronic Renal Failure in Sickle Cell Disease: Risk Factors, Clinical Course, and Mortality, Ann. Intern. Med. 115 (1991) 614‑620.
https://doi.org/10.7326/0003-4819-115-8-614
|
| [8] |
V. K. Derebail, Q. Zhou, E. J. Ciccone et al., Rapid decline in estimated glomerular filtration rate is common in adults with sickle cell disease and associated with increased mortality, Br. J. Haematol. 186 (2019) 900-907.
https://doi.org/10.1111/bjh.16003
|
| [9] |
M. Seck, O. Ba, B. F. Faye, et al., Homozygous sickle cell disease related mortality in Senegal (2011-2020), EJHaem. 2 (2021) 711-715.
https://doi.org/10.1002/jha2.273
|
| [10] |
D. R. Powars, L. S. Chan, A. Hiti et al., Outcome of sickle cell anemia: a 4-decade observational study of 1056 patients, Medicine. 84 (2005) 363‑376.
https://doi.org/10.1097/01.md.0000189089.45003.52
|
| [11] |
V. Audard, P. Bartolucci et T. Stehlé, Sickle cell disease and albuminuria: recent advances in our understanding of sickle cell nephropathy, Clin. Kidney J. 10 (2017) 475‑478.
https://doi.org/10.1093/ckj/sfx027
|
| [12] |
Kidney Disease: Improving Global Outcomes (KDIGO) CKD Work Group, KDIGO 2012 Clinical Practice Guideline for the Evaluation and Management of Chronic Kidney Disease. Kidney Int Suppl. 3 (2013) 1-150, p31.
https://doi.org/10.1038/kisup.2012.73
|
| [13] |
E. O. Gosmanova, S. Zaidi, J. Y. Wan, et al. Prevalence and progression of chronic kidney disease in adult patients with sickle cell disease, J Investig Med. 62 (2014) 804-807.
https://doi.org/10.1097/01.JIM.0000446836.75352.72
|
| [14] |
E. J. Lamb, G. R. D. Jones, Kidney function tests, In: N. Rifai, A. R. Horvath, C. T. Wittwer (Eds), Tietz fundamentals of clinical chemistry and molecular diagnostics, Elsevier Inc., St Louis, 2018, 359–376.
|
| [15] |
A. Bökenkamp, Proteinuria-take a closer look!, Pediatr. Nephrol. 35 (2020) 533-541.
https://doi.org/10.1007/s00467-019-04454-w
|
| [16] |
R. J. Hogg, R. J. Portman, D. Milliner, et al., Evaluation and management of proteinuria and nephrotic syndrome in children: recommendations from a pediatric nephrology panel established at the National Kidney Foundation conference on proteinuria, albuminuria, risk, assessment, detection, and elimination (PARADE), Pediatrics. 105 (2000) 1242-1249.
https://doi.org/10.1542/peds.105.6.1242
|
| [17] |
B. Viteri, J. Reid-Adam, Hematuria and Proteinuria in Children, Pediatr. Rev. 39 (2018) 573-587.
https://doi.org/10.1542/pir.2017-0300
|
| [18] |
K. Linnet, P. M. Bossuyt, K. G. Moons, et al., Quantifying the accuracy of a diagnostic test or marker, Clin Chem. 58 (2012) 1292-301.
https://doi.org/10.1373/clinchem.2012.182543
|
| [19] |
X. Liu, Classification accuracy and cut-point selection, Stat Med. 31 (2012) 2676–2686.
https://doi.org/10.1002/sim.4509
|
| [20] |
T. J. Zhou, S. Raza, K. P. Nelson, et al. Methods of assessing categorical agreement between correlated screening tests in clinical studies, J Appl Stat. 48 (2021) 1861–1881.
https://doi.org/10.1080/02664763.2020.1777394
|
| [21] |
K. G. Moons, J. A. de Groot, K. Linnet, et al., Quantifying the added value of a diagnostic test or marker, Clin Chem. 58 (2012) 1408-1417.
https://doi.org/10.1373/clinchem.2012.182550
|
| [22] |
M. Li, Q. Gao, T. Yu, et al. Kappa statistic considerations in evaluating inter-rater reliability between two raters: which, when and context matters, BMC Cancer. 23 (2023) 799.
https://doi.org/10.1186/s12885-023-11325-z
|
| [23] |
J. Cohen, A Coefficient of Agreement for Nominal Scales, Educ. Psychol. 20 (1960) 27-46.
https://doi.org/10.1177/001316446002000104
|
| [24] |
M. Greiner, D. Pfeiffer, R. D. Smith, et al., Principles and practical application of the receiver-operating characteristic analysis for diagnostic tests, Prev Vet Med. 45 (2000) 23–41.
https://doi.org/10.1016/S0167-5877(00)00115-X
|
| [25] |
J. R. Landis, G. G. Koch, The Measurement of Observer Agreement for Categorical Data, Biometrics, 33 (1977) 159.
https://doi.org/10.2307/2529310
|
| [26] |
A. S. Rigby, Statistical methods in epidemiology. v. Towards an understanding of the kappa coefficient, Disabil Rehabil. 22 (2000) 339–344.
https://doi.org/10.1080/096382800296575
|
| [27] |
E. H. M. Ndour, K. Mnika, F. Guèye-Tall, et al., Biomarkers of sickle cell nephropathy in Senegal, PLoS One. 17 (2022) e0273745.
https://doi.org/10.1371/journal.pone.0273745
|
| [28] |
O. Marsenic, K. G. Couloures, J. M. Wiley, et al., Proteinuria in children with sickle cell disease, Nephrol Dial Transplant. 23 (2007) 715–720.
https://doi.org/10.1093/ndt/gfm858
|
Cite This Article
-
APA Style
Ndour, E. H. M., Dione, R., Gueye-Tall, F., Mara, S., Deme-Ly, I., et al. (2024). Performances of Proteinuria as Compared with Albuminuria in Screening for Microalbuminuria During Sickle Cell Anaemia. Advances in Biochemistry, 12(2), 76-84. https://doi.org/10.11648/j.ab.20241202.14
 Copy
|
Copy
|
 Download
ACS Style
Ndour, E. H. M.; Dione, R.; Gueye-Tall, F.; Mara, S.; Deme-Ly, I., et al. Performances of Proteinuria as Compared with Albuminuria in Screening for Microalbuminuria During Sickle Cell Anaemia. Adv. Biochem. 2024, 12(2), 76-84. doi: 10.11648/j.ab.20241202.14
Copy
|
Download
AMA Style
Ndour EHM, Dione R, Gueye-Tall F, Mara S, Deme-Ly I, et al. Performances of Proteinuria as Compared with Albuminuria in Screening for Microalbuminuria During Sickle Cell Anaemia. Adv Biochem. 2024;12(2):76-84. doi: 10.11648/j.ab.20241202.14
Copy
|
Download
-
@article{10.11648/j.ab.20241202.14,
  author = {El Hadji Malick Ndour and Rokhaya Dione and Fatou Gueye-Tall and Sokhna Mara and Indou Deme-Ly and Moussa Seck and Aliou Alioune Ndongo and Moustapha Djite and Helene Ange Therese Sagna-Bassene and Nene Oumou Kesso Barry and Pape Matar Kandji and Coumba Kamby and El Hadji Ousmane Sene and Papa Madieye Gueye and Ibrahima Diagne and Saliou Diop and Philomene Lopez-Sall and Aynina Cisse},
  title = {Performances of Proteinuria as Compared with Albuminuria in Screening for Microalbuminuria During Sickle Cell Anaemia
},
  journal = {Advances in Biochemistry},
  volume = {12},
  number = {2},
  pages = {76-84},
  doi = {10.11648/j.ab.20241202.14},
  url = {https://doi.org/10.11648/j.ab.20241202.14},
  eprint = {https://article.sciencepublishinggroup.com/pdf/10.11648.j.ab.20241202.14},
  abstract = {Albuminuria is the gold standard for the screening of microalbuminuria, a biomarker of early onset of nephropathy during sickle cell anemia (SCA). Nephropathy increase morbidity and mortality of SCA in the absence of appropriate treatment. However, albuminuria is not readily available or affordable in resource-limited countries, so in 2012 Kidney Diseases Improving Global Outcomes (KDIGO) proposed using proteinuria at a threshold of 150 mg/g urine creatinine to screen for microalbuminuria in these settings. The aim of this study was therefore to assess the performance of proteinuria in screening microalbuminuria in sub-Saharan Senegalese sickle cell patients. Albuminuria in recruited SS sickle cell patients was expressed as a urine albumin-to-creatinine ratio (UACR) and proteinuria as a urine proteins-to-creatinine ratio (UPCR). The prevalence of microalbuminuria, Cohen's kappa coefficient and areas under the curve (AUC) were then determined to assess the performance of proteinuria in detecting microalbuminuria. A total of 150 patients with a median age of 20 years [minimum-maximum: 4-57] and a female proportion of 51.33% were included in the study. Microalbuminuria was present in 42.38% (n=64) of subjects according to the UPCR. The Cohen's kappa coefficient was 0.41 [IC95%: 0.27-0.56] and the AUC 0.71 [IC95%: 0.64 - 0.81] with UPCR 150mg/g. The best Cohen's kappa coefficient and AUC were observed with an UPCR threshold of 135 mg/g. Our results confirm that proteinuria is useful in screening for microalbuminuria and show that RPCU 135 mg/g would be the optimal cut-off for detecting microalbuminuria in Senegalese sickle cell anemia patients.
},
 year = {2024}
}
Copy
|
Download
-
TY  - JOUR
T1  - Performances of Proteinuria as Compared with Albuminuria in Screening for Microalbuminuria During Sickle Cell Anaemia

AU  - El Hadji Malick Ndour
AU  - Rokhaya Dione
AU  - Fatou Gueye-Tall
AU  - Sokhna Mara
AU  - Indou Deme-Ly
AU  - Moussa Seck
AU  - Aliou Alioune Ndongo
AU  - Moustapha Djite
AU  - Helene Ange Therese Sagna-Bassene
AU  - Nene Oumou Kesso Barry
AU  - Pape Matar Kandji
AU  - Coumba Kamby
AU  - El Hadji Ousmane Sene
AU  - Papa Madieye Gueye
AU  - Ibrahima Diagne
AU  - Saliou Diop
AU  - Philomene Lopez-Sall
AU  - Aynina Cisse
Y1  - 2024/06/13
PY  - 2024
N1  - https://doi.org/10.11648/j.ab.20241202.14
DO  - 10.11648/j.ab.20241202.14
T2  - Advances in Biochemistry
JF  - Advances in Biochemistry
JO  - Advances in Biochemistry
SP  - 76
EP  - 84
PB  - Science Publishing Group
SN  - 2329-0862
UR  - https://doi.org/10.11648/j.ab.20241202.14
AB  - Albuminuria is the gold standard for the screening of microalbuminuria, a biomarker of early onset of nephropathy during sickle cell anemia (SCA). Nephropathy increase morbidity and mortality of SCA in the absence of appropriate treatment. However, albuminuria is not readily available or affordable in resource-limited countries, so in 2012 Kidney Diseases Improving Global Outcomes (KDIGO) proposed using proteinuria at a threshold of 150 mg/g urine creatinine to screen for microalbuminuria in these settings. The aim of this study was therefore to assess the performance of proteinuria in screening microalbuminuria in sub-Saharan Senegalese sickle cell patients. Albuminuria in recruited SS sickle cell patients was expressed as a urine albumin-to-creatinine ratio (UACR) and proteinuria as a urine proteins-to-creatinine ratio (UPCR). The prevalence of microalbuminuria, Cohen's kappa coefficient and areas under the curve (AUC) were then determined to assess the performance of proteinuria in detecting microalbuminuria. A total of 150 patients with a median age of 20 years [minimum-maximum: 4-57] and a female proportion of 51.33% were included in the study. Microalbuminuria was present in 42.38% (n=64) of subjects according to the UPCR. The Cohen's kappa coefficient was 0.41 [IC95%: 0.27-0.56] and the AUC 0.71 [IC95%: 0.64 - 0.81] with UPCR 150mg/g. The best Cohen's kappa coefficient and AUC were observed with an UPCR threshold of 135 mg/g. Our results confirm that proteinuria is useful in screening for microalbuminuria and show that RPCU 135 mg/g would be the optimal cut-off for detecting microalbuminuria in Senegalese sickle cell anemia patients.

VL  - 12
IS  - 2
ER  -
Copy
|
Download