Abstract
Agricultural digitalization could help reconcile farm-income growth with emissions reduction, but evidence on how the depth of smart-technology application shapes these outcomes among smallholders remains limited. Using field-survey data from 243 wheat-growing households in Neihuang, Lintong and Lingwu along China’s Yellow River, we construct a smart agricultural technology application-intensity index covering planting, irrigation and fertilization, crop protection and harvesting. We combine regression analysis with a coupling-coordination model to examine effects on per-mu net income and carbon emissions, and to assess the moderating roles of farmer education and green planting practices. Greater technology application is associated with higher per-mu net income and lower per-mu carbon emissions: the estimated coefficients are 0.0341 and −0.0979, respectively. Farmer education strengthens the income effect, whereas green planting practices weaken it in the short term. Overall, the coupling between emissions reduction and income growth is at an intermediate level, with coordination highest in Lintong, followed by Neihuang and Lingwu. These findings indicate that smart agriculture generates economic and environmental benefits when technology depth is supported by human capital, technical services and market institutions. Policies that integrate digital-skills training, production-stage services, green incentives and agricultural value-chain development could improve the alignment between farmer prosperity and low-carbon agricultural transformation.
|
Published in
|
Science Innovation (Volume 14, Issue 6)
|
|
DOI
|
10.11648/j.si.20261406.11
|
|
Page(s)
|
211-222 |
|
Creative Commons
|

This is an Open Access article, distributed under the terms of the Creative Commons Attribution 4.0 International License (http://creativecommons.org/licenses/by/4.0/), which permits unrestricted use, distribution and reproduction in any medium or format, provided the original work is properly cited.
|
|
Copyright
|
Copyright © The Author(s), 2026. Published by Science Publishing Group
|
Keywords
Smart Agriculture, Carbon Emissions, Farmer Income, Technology Application Intensity
1. Introduction
1.1. Research Background and Problem Statement
Agricultural production underpins food security and rural livelihoods, but it is also a major source of land and water use and greenhouse gas emissions. The Intergovernmental Panel on Climate Change emphasizes that agricultural emissions reduction requires attention to both the production of agricultural inputs and field-level operations. The Food and Agriculture Organization of the United Nations further stresses that automation, digitalization and intelligent technologies can improve resource-allocation efficiency only when they are embedded in farmers’ production decisions. These policy priorities are reflected in
| [1] | Ministry of Agriculture and Rural Affairs of the People’s Republic of China. Implementation Plan for Agricultural and Rural Emissions Reduction and Carbon Sequestration. 2022. |
| [2] | Ministry of Agriculture and Rural Affairs of the People’s Republic of China. National Smart Agriculture Action Plan (2024-2028). 2024. |
[1, 2]
. Recent studies indicate that agricultural digitalization can raise productivity and resilience while reducing environmental footprints; however, these effects depend on complementary conditions, including infrastructure, service organizations, market access and farmers’ capabilities
| [3] | MacPherson J, Voglhuber-Slavinsky A, Olbrisch M, et al. Future agricultural systems and the role of digitalization for achieving sustainability goals: A review. Agronomy for Sustainable Development, 2022, 42(4).
https://doi.org/10.1007/s13593-022-00792-6 |
| [4] | Finger R. Digital innovations for sustainable and resilient agricultural systems. European Review of Agricultural Economics, 2023, 50(4): 1277-1309. https://doi.org/10.1093/erae/jbad021 |
| [5] | Rosa L, Gabrielli P R. Achieving net-zero emissions in agriculture: A review. Environmental Research Letters, 2023, 18(6): 063002. https://doi.org/10.1088/1748-9326/acd5e8 |
[3-5]
. Against the backdrop of China’s carbon-peaking and carbon-neutrality goals and the rural revitalization strategy, shifting agricultural production from input-driven growth toward the coordinated use of digital and green technologies has become an important policy direction for strengthening agricultural resilience, increasing farmers’ incomes and reducing agricultural emissions. The Implementation Plan for Agricultural and Rural Emissions Reduction and Carbon Sequestration identifies reductions in fertilizer and pesticide use, energy-efficient agricultural machinery and comprehensive straw utilization as key tasks
| [1] | Ministry of Agriculture and Rural Affairs of the People’s Republic of China. Implementation Plan for Agricultural and Rural Emissions Reduction and Carbon Sequestration. 2022. |
[1]
. The National Smart Agriculture Action Plan (2024-2028) calls for the accelerated application of artificial intelligence, the Internet of Things, remote sensing and BeiDou navigation technologies throughout the production chain, including planting, crop management and harvesting
| [2] | Ministry of Agriculture and Rural Affairs of the People’s Republic of China. National Smart Agriculture Action Plan (2024-2028). 2024. |
[2]
.
Smart agricultural technologies are characterized by data sensing, intelligent decision-making and precision operations. By identifying variations in soil, crops and weather conditions, these technologies can optimize planting, irrigation and fertilization, crop protection and harvesting, thereby reducing information asymmetry, inefficient input use and redundant operations. Finger
| [4] | Finger R. Digital innovations for sustainable and resilient agricultural systems. European Review of Agricultural Economics, 2023, 50(4): 1277-1309. https://doi.org/10.1093/erae/jbad021 |
[4]
and MacPherson et al.
show that digital innovations have the potential to increase productivity per unit of land, reduce input intensity, improve risk management and strengthen agricultural resilience. These benefits, however, depend on continued technology use, farmers’ learning capabilities and the coordination of service and market systems. Papadopoulos et al.
| [6] | Papadopoulos G, Arduini S, Uyar H, et al. Economic and environmental benefits of digital agricultural technologies in crop production: A review. Smart Agricultural Technology, 2024, 8: 100441. https://doi.org/10.1016/j.atech.2024.100441 |
[6]
further demonstrate that digital agricultural technologies can simultaneously improve crop yields, farm profitability and environmental performance, whereas Khanna et al.
find that the returns to adopting artificial-intelligence-based technologies are closely associated with learning costs, initial investment, risk perceptions and farm size. Compared with a binary measure of whether a single technology has been adopted, an application-intensity measure covering planting, irrigation and fertilization, crop protection and harvesting better captures the depth of technological integration into agricultural production. It therefore enables a more precise assessment of how technology intensification affects farmers’ economic and environmental performance.
1.2. Literature Review
Existing studies have mainly focused on three aspects. First, research on the income effects of smart agriculture, digital agriculture and precision agriculture generally argues that data access, intelligent decision-making and precision operations can reduce search and transaction costs, improve input combinations and increase labor productivity
| [4] | Finger R. Digital innovations for sustainable and resilient agricultural systems. European Review of Agricultural Economics, 2023, 50(4): 1277-1309. https://doi.org/10.1093/erae/jbad021 |
| [8] | Wolfert S, Ge L, Verdouw C, Bogaardt M J. Big data in smart farming: A review. Agricultural Systems, 2017, 153: 69-80.
https://doi.org/10.1016/j.agsy.2017.01.023 |
| [9] | Klerkx L, Jakku E, Labarthe P. A review of social science on digital agriculture, smart farming and agriculture 4.0: New contributions and a future research agenda. NJAS-Wageningen Journal of Life Sciences, 2019, 90-91: 100315.
https://doi.org/10.1016/j.njas.2019.100315 |
[4, 8, 9].
Evidence from Chinese family farms and farm households shows that the adoption of new agricultural technologies, digital rural development and digital technology applications can increase farmers’ incomes by improving production efficiency, expanding market channels and facilitating factor mobility
. However, the returns to digital technologies are highly conditional. Farm size, technical services, market access, digital skills and human capital all influence whether technological adoption can be translated into higher net income
| [7] | Khanna M, Atallah S S, Heckelei T, et al. Economics of the adoption of artificial intelligence-based digital technologies in agriculture. Annual Review of Resource Economics, 2024, 16(1): 41-61.
https://doi.org/10.1146/annurev-resource-101623-092515 |
| [13] | Gabriel A, Gandorfer M. Adoption of digital technologies in agriculture: An inventory in a European small-scale farming region. Precision Agriculture, 2023, 24(1): 68-91.
https://doi.org/10.1007/s11119-022-09931-1 |
| [14] | Cheng C, Gao Q, Ju K, et al. How digital skills affect farmers’ agricultural entrepreneurship? An explanation from factor availability. Journal of Innovation & Knowledge, 2024, 9(2): 100477. https://doi.org/10.1016/j.jik.2024.100477 |
[7, 13, 14]
.
Second, studies have examined the environmental effects of agricultural technologies. Precision fertilization, variable-rate irrigation, pest and disease monitoring and intelligent agricultural machinery can reduce excessive use of fertilizers, pesticides, fuel and irrigation water, thereby lowering agricultural carbon emissions and non-point-source pollution
| [6] | Papadopoulos G, Arduini S, Uyar H, et al. Economic and environmental benefits of digital agricultural technologies in crop production: A review. Smart Agricultural Technology, 2024, 8: 100441. https://doi.org/10.1016/j.atech.2024.100441 |
| [15] | Finger R, Swinton S M, El Benni N, Walter A. Precision farming at the nexus of agricultural production and the environment. Annual Review of Resource Economics, 2019, 11: 313-335.
https://doi.org/10.1146/annurev-resource-100518-093929 |
[6, 15]
. Studies in China further show that digital agriculture can reduce carbon emissions by optimizing resource allocation, improving ecological efficiency and curbing excessive fertilizer and pesticide use. These effects are also subject to contextual conditions, including the level of regional development. Third, the literature has addressed the green transformation of agriculture. Existing studies emphasize that the long-term ecological benefits of green production must be supported by combinations of green technologies, specialized agricultural services, product premiums and ecological compensation mechanisms
| [3] | MacPherson J, Voglhuber-Slavinsky A, Olbrisch M, et al. Future agricultural systems and the role of digitalization for achieving sustainability goals: A review. Agronomy for Sustainable Development, 2022, 42(4).
https://doi.org/10.1007/s13593-022-00792-6 |
| [16] | Tilman D, Balzer C, Hill J, Befort B L. Global food demand and the sustainable intensification of agriculture. Proceedings of the National Academy of Sciences, 2011, 108(50): 20260-20264. https://doi.org/10.1073/pnas.1116437108 |
[3, 16]
. Education, risk perceptions, access to credit and labor allocation also affect the adoption and performance of green technologies. In addition, a higher degree of green production technology adoption can increase farmers’ sales revenues, but the realization of these benefits depends on whether gains in output and prices are sufficient to offset the associated upfront costs.
Although existing studies provide an important basis for understanding the roles of digital and green technologies, three gaps remain. First, few studies construct a continuous, farm-household-level measure of technology application intensity across planting, irrigation and fertilization, crop protection and harvesting. Existing research on small-scale farms has focused mainly on adoption sequences and determinants, with limited attention to the performance consequences of multi-stage technology intensification
| [13] | Gabriel A, Gandorfer M. Adoption of digital technologies in agriculture: An inventory in a European small-scale farming region. Precision Agriculture, 2023, 24(1): 68-91.
https://doi.org/10.1007/s11119-022-09931-1 |
[13]
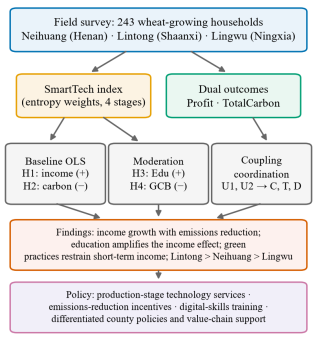
. Second, the literature has paid insufficient attention to the joint relationship between technology application, farmer income and carbon emissions, as well as to their coordination. Although global meta-analysis has begun to evaluate the economic and environmental benefits of precision agriculture simultaneously, the micro-level coordination mechanism among smallholders in the Yellow River Basin remains unclear. Third, the mechanisms through which human capital strengthens technology returns and green transition generates short-term cost constraints have not been tested within a unified framework. To address these gaps, this study uses survey data from 243 wheat-growing households in three representative counties along the Yellow River, constructs an index of smart agricultural technology application intensity, examines per-mu net income and per-mu carbon emissions as dual outcomes, tests the moderating roles of farmer education and green planting practices, and measures the coupling coordination between emissions reduction and income growth. The overall research framework is shown in
Figure 1.
1.3. Research Hypotheses
Smart agricultural technologies improve the observability of production conditions through sensors, remote sensing and intelligent decision systems. They enable the precise allocation of seeds, water, fertilizers and machinery, thereby reducing excessive inputs and redundant operations. Precision application can lower costs and improve yields and profitability
| [6] | Papadopoulos G, Arduini S, Uyar H, et al. Economic and environmental benefits of digital agricultural technologies in crop production: A review. Smart Agricultural Technology, 2024, 8: 100441. https://doi.org/10.1016/j.atech.2024.100441 |
| [15] | Finger R, Swinton S M, El Benni N, Walter A. Precision farming at the nexus of agricultural production and the environment. Annual Review of Resource Economics, 2019, 11: 313-335.
https://doi.org/10.1146/annurev-resource-100518-093929 |
[6, 15]
. Evidence from China also shows that the adoption of new technologies increases family-farm income
| [12] | Ma C, Liu W, Fang Y. Theoretical mechanisms and empirical evidence of digital technology-enabled income growth among farmers: Evidence from the CRRS 2022 farmer survey. China Soft Science, 2024(7): 69-78. https://doi.org/10.3969/j.issn.1002-9753.2024.07.007 |
[12]
, while digital technologies promote income growth through efficiency gains, expanded market channels and factor mobility
| [11] | Ma S, He G, Guo J. The welfare effects of digital agriculture: Decomposition from the perspectives of value recreation and redistribution. Issues in Agricultural Economy, 2022(5): 10-26. https://doi.org/10.13246/j.cnki.iae.2022.05.006 |
| [12] | Ma C, Liu W, Fang Y. Theoretical mechanisms and empirical evidence of digital technology-enabled income growth among farmers: Evidence from the CRRS 2022 farmer survey. China Soft Science, 2024(7): 69-78. https://doi.org/10.3969/j.issn.1002-9753.2024.07.007 |
[11, 12]
. Accordingly, deeper technology application should increase per-mu net income through higher yields, improved quality, lower costs and reduced production risks. We therefore propose Hypothesis H1: Greater application intensity of smart agricultural technologies significantly increases farmers’ per-mu net income.
Smart agricultural technologies reduce emissions by precisely adjusting input use and field operations. Variable-rate fertilization and pest monitoring reduce excessive fertilizer and pesticide application, whereas water-saving irrigation and intelligent machinery scheduling reduce energy consumption and redundant operations. Finger et al.
and Papadopoulos et al.
| [6] | Papadopoulos G, Arduini S, Uyar H, et al. Economic and environmental benefits of digital agricultural technologies in crop production: A review. Smart Agricultural Technology, 2024, 8: 100441. https://doi.org/10.1016/j.atech.2024.100441 |
[6]
show that precision agriculture and digital technologies can reduce the use of agricultural chemicals and fuel. Studies in China also indicate that digital agriculture promotes carbon reduction through more efficient resource allocation
| [16] | Tilman D, Balzer C, Hill J, Befort B L. Global food demand and the sustainable intensification of agriculture. Proceedings of the National Academy of Sciences, 2011, 108(50): 20260-20264. https://doi.org/10.1073/pnas.1116437108 |
[16]
, while technology combinations can reduce greenhouse gas emissions without compromising productivity
. We therefore propose Hypothesis H2: Greater application intensity of smart agricultural technologies significantly reduces farmers’ per-mu carbon emissions.
Smart agricultural technologies are knowledge-intensive and strongly dependent on learning. Farmers with higher levels of education generally have stronger information-acquisition and learning capabilities, allowing them to master digital technologies more quickly and translate them into production decisions. Khanna et al.
, Cheng et al.
| [14] | Cheng C, Gao Q, Ju K, et al. How digital skills affect farmers’ agricultural entrepreneurship? An explanation from factor availability. Journal of Innovation & Knowledge, 2024, 9(2): 100477. https://doi.org/10.1016/j.jik.2024.100477 |
[14]
and Ma et al.
| [12] | Ma C, Liu W, Fang Y. Theoretical mechanisms and empirical evidence of digital technology-enabled income growth among farmers: Evidence from the CRRS 2022 farmer survey. China Soft Science, 2024(7): 69-78. https://doi.org/10.3969/j.issn.1002-9753.2024.07.007 |
[12]
identify learning costs, digital skills and factor mobility as important constraints on the realization of technological returns. Thus, higher education is expected to release a larger share of the marginal benefits associated with smart agricultural technology application. We therefore propose Hypothesis H3: Farmer education positively moderates the income effect of smart agricultural technology application intensity.
Green planting practices can improve soil quality, reduce pollution and strengthen long-term ecological performance, but their economic returns are often delayed and highly dependent on market conditions. During the early stage of technological transition, measures such as organic fertilizer substitution and biological pest control may increase costs and generate short-term yield fluctuations. When price premiums, ecological compensation and stable marketing channels are unavailable, ecological benefits are difficult to convert into cash income. Research on sustainable intensification emphasizes that services, markets and policy mechanisms are needed to reconcile long-term environmental benefits with short-term economic costs
| [3] | MacPherson J, Voglhuber-Slavinsky A, Olbrisch M, et al. Future agricultural systems and the role of digitalization for achieving sustainability goals: A review. Agronomy for Sustainable Development, 2022, 42(4).
https://doi.org/10.1007/s13593-022-00792-6 |
[3]
. We therefore propose Hypothesis H4: Green planting practices negatively moderate the short-term income effect of smart agricultural technology application intensity.
Figure 1. Research framework linking the smart agricultural technology application-intensity index to income, emissions and coupling-coordination outcomes.
2. Research Design
2.1. Model Specification
To examine the effects of smart agricultural technology application intensity on farmers’ net income and carbon emissions, we specify the following baseline regression model:
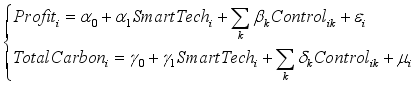 (1)
where

denotes farmers’ per-mu net income;
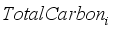
denotes farmers’ per-mu total carbon emissions;

is the core explanatory variable measuring smart agricultural technology application intensity;

is the vector of coefficients for the control variables;

is the random disturbance term.
To examine whether farmer education and green planting practices moderate the income effect of different levels of smart agricultural technology application, we introduce interaction terms into the baseline model and specify the following moderation model:
 (2)
where

denotes the moderator, including farmer education (EduLevel) and green planting characteristics (GCB);
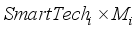
denotes the interaction term;

is the coefficient of the interaction term. A statistically significant coefficient indicates a moderating effect.
2.2. Variable Selection
2.2.1. Dependent Variables
The dependent variables are farmers’ per-mu net income (Profit) and per-mu carbon emissions (TotalCarbon), which capture the economic and environmental effects of different levels of smart agricultural technology application.
1) Per-mu net income (Profit). This variable is measured as the net profit from wheat cultivation per mu. It is calculated as gross output value per mu minus expenditures on agricultural inputs, labor, machinery and land rent, and captures the actual economic returns to technology application.
2) Per-mu carbon emissions (TotalCarbon). We calculate per-mu carbon emissions using a life-cycle assessment approach. Emission factors for each production stage are drawn from the IPCC Guidelines for National Greenhouse Gas Inventories and the Ecoinvent database. Carbon sources include agricultural inputs, energy use by machinery and irrigation, and CO2, CH4 and N2O emissions induced by nitrogen fertilizer application. All emissions are converted into t CO2-eq using global warming potentials.
2.2.2. Core Explanatory Variable
The core explanatory variable is smart agricultural technology application intensity (SmartTech). we select per-mu expenditures in four production stages, namely planting, irrigation and fertilization, crop protection and harvesting. Objective entropy weights are then used to construct an index of smart agricultural technology application intensity.
For each positive indicator, we apply min-max normalization, calculate its proportion and entropy value, and then derive the corresponding weight:
 (3)
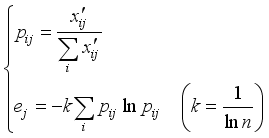 (4)
The composite index is defined as follows:
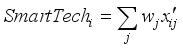 (5)
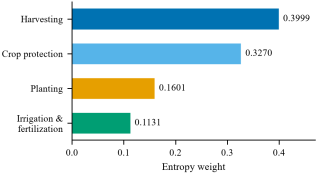
The estimated weights for the four production stages are reported in
Table 1 and visualized in
Figure 2. A higher value indicates greater input intensity in smart agricultural technologies and deeper technology application.
Table 1.
Entropy weights for the smart agricultural technology application-intensity index. Entropy weights for the smart agricultural technology application-intensity index. Entropy weights for the smart agricultural technology application-intensity index. Basic indicators | Indicator type | Entropy weight |
SowCost | Positive | 0.1601 |
FertIrrigCost | Positive | 0.1131 |
ProtCost | Positive | 0.3270 |
HarvCost | Positive | 0.3999 |
Figure 2. Entropy weights of the four production-stage indicators: harvesting and crop protection dominate the application-intensity index.
2.2.3. Moderating Variables
To examine heterogeneity in the income effect of smart agricultural technology application intensity, we introduce farmer education (EduLevel) and green planting characteristics (GCB) as moderating variables.
1) Farmer education (EduLevel). Education is measured using an ordinal scale: primary school or below, junior secondary school, senior secondary school or technical secondary school, and college or above are assigned values of 1-4, respectively.
2) Green planting characteristics (GCB). This variable is constructed by counting the number of green production practices adopted by each household, including straw incorporation, organic fertilizer substitution and biological pesticides. It ranges from 0 to 5 and captures farmers’ ecological preferences in production, which constitute an important contextual factor shaping the coordination between the environmental and economic effects of technology application.
2.2.4. Control Variables
To reduce omitted-variable bias, we control for three groups of factors: (1) village characteristics, represented by agricultural infrastructure conditions (InfraRate); (2) household characteristics, represented by farmer age (Age) and wheat-planting area (WheatArea); and (3) the production and market environment, represented by historical labor costs (LaborCost), historical agricultural input costs (CultCost), land rent (LandRent), historical yield per mu (Yield) and selling price (Price). Historical labor and input costs are measured as the average per-mu values over the previous three years to capture factor-cost constraints and mitigate potential endogeneity.
2.3. Data Sources and Descriptive Statistics
2.3.1. Data Sources
The data come from a field survey of farmers’ smart agricultural technology use conducted in representative counties along the upper, middle and lower reaches of the Yellow River. Considering regional differences in agricultural resource endowments, economic development and the diffusion stage of smart agricultural technologies, we selected Neihuang in Henan Province, Lintong in Shaanxi Province and Lingwu in Ningxia. After excluding questionnaires with key missing information or clear logical inconsistencies, we retained 243 valid observations.
2.3.2. Descriptive Statistics
we divide the full sample into a partial-adoption group and a full-adoption group. As shown in
Table 2, the full-adoption group has lower mean per-mu carbon emissions than the partial-adoption group (0.7081 versus 0.7415), providing preliminary evidence that deeper technology application is associated with emissions reduction. By contrast, mean net income is slightly higher in the partial-adoption group (0.2982), and both groups contain negative minimum values, indicating substantial market and natural risks in agricultural operations. The full-adoption group has significantly larger wheat-planting areas and higher land rents, suggesting that scale of operation is an important driver of deeper technology adoption.
Table 2. Descriptive statistics of the main variables by adoption level.
Group | VarName | Obs | Mean | SD | Min | P25 | Median | P75 | Max |
Partial adoption | TotalCarbon | 91 | 0.7415 | 0.155 | 0.4111 | 0.6243 | 0.7373 | 0.8452 | 1.1565 |
Profit | 91 | 0.2982 | 0.3311 | -0.44 | 0.0157 | 0.301 | 0.5618 | 0.842 |
WheatArea | 91 | 257.5165 | 399.1582 | 4 | 12 | 40 | 502.5 | 1475 |
CultCost | 91 | 1.0469 | 0.2361 | 0.606 | 0.89 | 1.115 | 1.1975 | 1.566 |
LandRent | 91 | 0.3436 | 0.2294 | 0 | 0 | 0.41 | 0.45 | 0.85 |
Yield | 91 | 483.4615 | 103.7269 | 280 | 405 | 470 | 555 | 750 |
GCB | 91 | 3.1538 | 0.9991 | 1 | 2 | 3 | 4 | 5 |
EduLevel | 91 | 1.7912 | 0.753 | 1 | 1 | 2 | 2 | 3 |
Full adoption | TotalCarbon | 152 | 0.7081 | 0.1603 | 0.3468 | 0.6021 | 0.6934 | 0.8139 | 1.1289 |
Profit | 152 | 0.2533 | 0.2961 | -0.3405 | 0.0542 | 0.2182 | 0.4769 | 0.965 |
WheatArea | 152 | 324.7105 | 462.1705 | 4 | 18 | 42.5 | 695 | 1470 |
CultCost | 152 | 1.0682 | 0.2527 | 0.525 | 1.015 | 1.09 | 1.1712 | 1.742 |
LandRent | 152 | 0.4013 | 0.2469 | 0 | 0.36 | 0.425 | 0.4925 | 1 |
Yield | 152 | 479.5066 | 85.695 | 320 | 410 | 460 | 545 | 715 |
GCB | 152 | 3.2303 | 0.8875 | 1 | 3 | 3 | 4 | 5 |
EduLevel | 152 | 1.8224 | 0.7643 | 1 | 1 | 2 | 2 | 3 |
3. Empirical Results
3.1. Effects of Smart Agricultural Technology Application Intensity on Farmers’ Net Income and Carbon Emissions
Table 3 reports the baseline regression results for the effects of smart agricultural technology application intensity on farmers’ net income and carbon emissions. Columns (1) and (2) use farmers’ net income (Profit) and per-mu total carbon emissions (TotalCarbon) as the dependent variables, respectively.
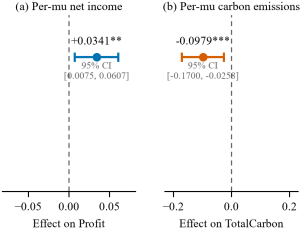
For the income effect, Column (1) shows that the coefficient on smart agricultural technology application intensity (SmartTech) is 0.0341 and statistically significant at the 5% level. Holding other conditions constant, a one-unit increase in SmartTech significantly increases farmers’ per-mu net income by 0.0341 units. Among the control variables, labor costs (LaborCost) and agricultural input costs (CultCost) have significantly negative effects on net income, consistent with the basic relationship between production costs and returns. Historical wheat yield per mu (Yield) and selling price (Price) have significantly positive coefficients, confirming that higher yields and price premiums remain the central drivers of farmer income growth.
For the emissions effect, Column (2) shows that the coefficient on SmartTech is −0.0979 and statistically significant at the 1% level. A one-unit increase in smart agricultural technology application intensity therefore reduces per-mu carbon emissions by 0.0979 units, indicating a significant emissions-reduction effect. Labor costs (LaborCost) have a significantly positive association with carbon emissions, suggesting that greater labor input is accompanied by more machinery operations or agricultural input use. The coefficient on green planting characteristics (GCB) is −0.0798 and significant at the 1% level, indicating that green production practices help reduce carbon emissions. Together, Columns (1) and (2) show that the diffusion of smart agricultural technologies in the sampled counties along the Yellow River initially achieves both income growth and emissions reduction, supporting H1 and H2.
Figure 3 summarizes these two baseline effects with their 95% confidence intervals.
Table 3. Smart agricultural technology application intensity, carbon emissions and farmer income: baseline regressions.Smart agricultural technology application intensity, carbon emissions and farmer income: baseline regressions.Smart agricultural technology application intensity, carbon emissions and farmer income: baseline regressions.
| (1) Profit | (2) TotalCarbon |
SmartTech | 0.0341** | -0.0979*** |
| (2.5261) | (-2.6749) |
Age | 0.0007 | -0.0044** |
| (0.8889) | (-2.0372) |
WheatArea | 0.0000 | 0.0000 |
| (0.5506) | (1.2608) |
InfraRate | -0.0014 | 0.0108 |
| (-0.4539) | (1.2785) |
LaborCost | -1.7973*** | 2.6364*** |
| (-7.0598) | (3.8230) |
CultCost | -0.8386*** | -0.1269 |
| (-16.4275) | (-0.9177) |
LandRent | -0.1627*** | 0.1471 |
| (-3.1537) | (1.0529) |
Yield | 0.0022*** | 0.0001 |
| (54.0246) | (1.3512) |
Price | 0.4985*** | -0.0238 |
| (31.9471) | (-0.5634) |
GCB | -0.0448*** | -0.0798*** |
| (-10.1154) | (-6.6565) |
Constant | -0.8405*** | 1.0331*** |
| (-12.3832) | (5.6193) |
N | 243 | 243 |
Adjusted R2 | 0.971 | 0.187 |
Figure 3. Baseline effects of SmartTech on per-mu net income and per-mu carbon emissions with 95% confidence intervals.
3.2. Smart Agricultural Technology Intensity, Farmers’ Net Income, and Moderation by Education and Green Planting
The baseline results confirm that deeper smart agricultural technology application significantly increases farmers’ net income. However, its marginal effect may depend on farmers’ human-capital endowments and production choices. We therefore introduce farmer education and green planting characteristics as moderating variables.
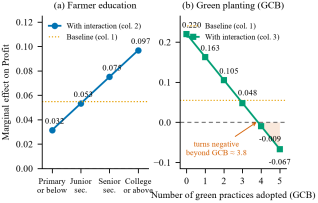
Table 4 reports their moderating effects on the relationship between smart agricultural technology application intensity and farmer income, and
Figure 4 plots the implied marginal income effects across moderator values.
Column (2) shows that the interaction between farmer education and smart agricultural technology application intensity (inter_Edu) is 0.0218 and statistically significant at the 5% level. This result indicates that farmer education positively moderates the income effect of smart agricultural technology application intensity. More highly educated farmers are better able to understand and use smart agricultural technologies and to convert them into productive inputs, making the income gains from deeper technology application more pronounced. The significantly positive main effect of EduLevel in Column (5) further confirms the role of human capital in converting technology application into economic returns.
Column (3) shows that the interaction between green planting characteristics and smart agricultural technology application intensity (inter_GCB) is −0.0574 and statistically significant at the 1% level. This result indicates that green planting characteristics suppress the income effect of deeper smart agricultural technology application. One possible explanation is that green planting often entails stronger environmental constraints, which may increase production costs or limit short-term scope for yield gains, thereby offsetting part of the economic returns to deeper technology application. The significantly negative main effect of GCB in Column (4) further suggests that, under the current agricultural development model, green planting and smart agricultural technologies have not yet formed a mutually reinforcing combination for farmer income growth. In the short term, green production may therefore crowd out part of farmers’ net income. The results support H3 and H4.
Table 4. Smart agricultural technology application intensity and net income: moderating effects of farmer education and green planting characteristics.
| (1) Profit | (2) Profit | (3) Profit | (4) Profit | (5) Profit |
SmartTech | 0.0548*** | 0.0097 | 0.2202*** | 0.0341** | 0.0477*** |
| (3.4248) | (0.3605) | (9.1235) | (2.5261) | (3.0005) |
inter_Edu | | 0.0218** | | | |
| | (2.0855) | | | |
inter_GCB | | | -0.0574*** | | |
| | | (-8.4232) | | |
GCB | | | | -0.0448*** | |
| | | | (-10.1154) | |
EduLevel | | | | | 0.0229*** |
| | | | | (3.0434) |
Age | 0.0004 | 0.0004 | 0.0005 | 0.0007 | 0.0001 |
| (0.4665) | (0.3863) | (0.6479) | (0.8889) | (0.1497) |
WheatArea | 0.0000 | 0.0000 | 0.0000 | 0.0000 | 0.0000 |
| (0.7971) | (0.8455) | (0.9562) | (0.5506) | (0.8550) |
InfraRate | 0.0012 | 0.0022 | -0.0003 | -0.0014 | 0.0029 |
| (0.3328) | (0.5760) | (-0.1033) | (-0.4539) | (0.7814) |
LaborCost | -2.7119*** | -2.6041*** | -1.9432*** | -1.7973*** | -2.5364*** |
| (-9.5127) | (-9.0505) | (-7.3013) | (-7.0598) | (-8.8677) |
CultCost | -0.7213*** | -0.6996*** | -0.8437*** | -0.8386*** | -0.6934*** |
| (-12.1131) | (-11.6517) | (-15.5640) | (-16.4275) | (-11.7055) |
LandRent | -0.2914*** | -0.2884*** | -0.1652*** | -0.1627*** | -0.2782*** |
| (-4.8658) | (-4.8484) | (-3.0244) | (-3.1537) | (-4.7146) |
Yield | 0.0021*** | 0.0021*** | 0.0022*** | 0.0022*** | 0.0021*** |
| (44.3529) | (40.5694) | (51.1540) | (54.0246) | (39.4665) |
Price | 0.5252*** | 0.5125*** | 0.5014*** | 0.4985*** | 0.5057*** |
| (28.5097) | (26.5699) | (30.5717) | (31.9471) | (26.3285) |
Constant | -1.0327*** | -1.0105*** | -0.9621*** | -0.8405*** | -1.0293*** |
| (-13.2314) | (-12.9184) | (-13.9514) | (-12.3832) | (-13.4185) |
N | 243 | 243 | 243 | 243 | 243 |
Adjusted R2 | 0.958 | 0.959 | 0.968 | 0.971 | 0.960 |
Figure 4. Marginal income effects of SmartTech by moderator: (a) farmer education strengthens the effect; (b) green planting practices offset it beyond GCB ≈ 3.8.
4. Extended Analysis
To further examine the synergies between smart agricultural technology application, carbon reduction and farmer income, we construct a coupling-coordination model with two subsystems.
4.1. Indicator System and Measurement Method
This study focuses on the dual effects of smart agricultural technology application on carbon emissions and farmer income. We define two subsystems: U1, the carbon-emissions subsystem, and U2, the farmer-income subsystem. U1 includes four indicators, namely SowCarbon, FertIrrigCarbon, ProtCarbon and HarvCarbon; U2 includes Yield and Price. We use min-max normalization to remove differences in scale, apply the entropy-weight method within each subsystem, and then adopt the coupling-coordination model:
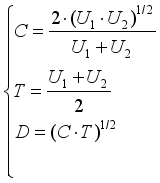 (6)
The coordination levels are classified as follows: 0.4-0.5 indicates near disorder, 0.5-0.6 barely coordinated, 0.6-0.7 primary coordination, 0.7-0.8 intermediate coordination and 0.8-0.9 good coordination.
4.2. Empirical Results and Analysis
4.2.1. Subsystem Weights and Development Levels
The entropy-weight results in
Table 5 show that crop-protection carbon emissions have the highest weight in the U1 carbon-emissions subsystem (0.3629), identifying crop protection as a key node for reducing carbon emissions in wheat production. In the U2 farmer-income subsystem, yield per mu has a substantially higher weight than selling price (0.5687 versus 0.4313), indicating that yield improvement remains the main driver of farmer income at the current stage.
Table 5. Entropy weights of indicators in the two subsystems.
Subsystem | Indicator | Direction | Weight |
U₁ Carbon-emissions subsystem | SowCarbon | Negative | 0.1137 |
| FertIrrigCarbon | Negative | 0.2495 |
| ProtCarbon | Negative | 0.3629 |
| HarvCarbon | Negative | 0.2738 |
U₂ Farmer-income subsystem | Yield | Positive | 0.5687 |
| Price | Positive | 0.4313 |
4.2.2. Spatial Heterogeneity at the County Level
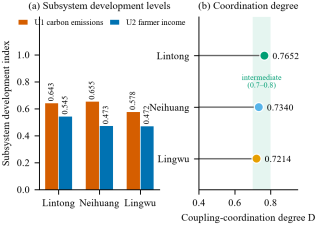
Across counties, the coupling-coordination degree follows the gradient Lintong (0.7652) > Neihuang (0.7340) > Lingwu (0.7214) (
Table 6).
Figure 5 presents the subsystem development levels and the corresponding coordination degrees. This pattern is broadly consistent with differences in location, resource endowments and the penetration of smart agricultural technologies across the upper, middle and lower reaches of the Yellow River.
Lintong exhibits a favorable pattern of intermediate emissions and high income. Its farmer-income subsystem has the highest score among the three counties, indicating that smart agricultural technologies are particularly effective in increasing yields and securing market premiums, thereby offsetting the county’s intermediate emissions performance. Neihuang shows a low-emissions and intermediate-income pattern. Although its carbon emissions are the lowest, its farmer-income subsystem score is only 0.4729, suggesting that environmental benefits have not yet been fully converted into economic returns, possibly because of limited marketing channels and short agricultural value chains. Lingwu faces the dual disadvantage of high emissions and low income, and its overall development level is the main bottleneck limiting coordination. These results indicate that technology promotion cannot rely on isolated investments in individual production stages; it must be matched with market-oriented and industrial-supporting conditions.
Table 6. County-level coupling-coordination degree at the farm-household level. County-level coupling-coordination degree at the farm-household level. County-level coupling-coordination degree at the farm-household level.
County | U₁ Carbon emissions | U₂ Farmer income | C | T | D |
Neihuang | 0.6546 | 0.4729 | 0.9598 | 0.5637 | 0.7340 |
Lintong | 0.6431 | 0.5447 | 0.9894 | 0.5939 | 0.7652 |
Lingwu | 0.5782 | 0.4723 | 0.9925 | 0.5253 | 0.7214 |
Figure 5. County-level coupling coordination: (a) subsystem development levels; (b) coordination degrees, all at the intermediate level.
4.2.3. Distribution of Coordination Levels across Farm Households
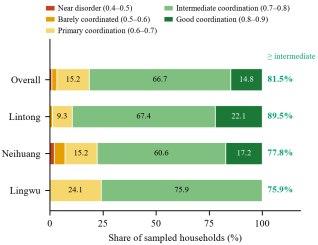
At the farm-household level, coordination levels display a spindle-shaped distribution, with intermediate coordination predominating. The share of households at the intermediate or higher coordination levels reaches 81.48%, and no household falls into the severe-disorder category. This pattern suggests that smart agricultural technologies have initially generated a favorable interaction between emissions reduction and income growth for most sampled households (
Tables 7 and 8;
Figure 6).
The county-level distribution reveals further heterogeneity. The share of households at the intermediate or higher coordination levels reaches 89.53% in Lintong, clearly exceeding the shares in Neihuang and Lingwu. Supported by stronger industrial foundations, Lintong has achieved deeper integration between emissions reduction and income growth through smart agricultural technologies. Lingwu still needs to address bottlenecks in technology diffusion and market connectivity.
Table 7. Distribution of coupling-coordination levels among sampled farm households.
Coordination level | Frequency | Percent (%) |
Near disorder (0.4-0.5) | 2 | 0.82 |
Barely coordinated (0.5-0.6) | 6 | 2.47 |
Primary coordination (0.6-0.7) | 37 | 15.23 |
Intermediate coordination (0.7-0.8) | 162 | 66.67 |
Good coordination (0.8-0.9) | 36 | 14.81 |
Total | 243 | 100.00 |
Figure 6. Distribution of coupling-coordination levels across counties; shares at intermediate coordination or higher are marked on the right.
Table 8. County-level distribution of coupling-coordination levels.
Coordination level | Neihuang | Lintong | Lingwu | Total |
Near disorder | 2 | 0 | 0 | 2 |
Barely coordinated | 5 | 1 | 0 | 6 |
Primary coordination | 15 | 8 | 14 | 37 |
Intermediate coordination | 60 | 58 | 44 | 162 |
Good coordination | 17 | 19 | 0 | 36 |
Total | 99 | 86 | 58 | 243 |
5. Conclusions and Policy Implications
Based on survey data from 243 wheat households in three Yellow River counties, we construct a four-stage smart agricultural technology application index covering planting, irrigation-fertilization, pest control and harvesting, and examine its effects on per-mu net income, carbon emissions and the coupling coordination of income growth and emission reduction. We find that higher technology application boosts income and reduces emissions. Farmer education enhances the income effect, while green planting characteristics suppress it due to short-term transition costs. Coupling coordination is moderate overall but varies sharply across counties. Smart agriculture benefits depend on technology adoption intensity, human capital and green production conditions, calling for joint progress in technical services, market development and ecological compensation.
First, establish a production-stage-oriented extension system for smart agriculture. Policy support should shift from one-time equipment subsidies toward integrated provision of equipment, data and services. Practical, maintainable and continuous technical services should be organized around planting, irrigation and fertilization, crop protection and harvesting. In areas dominated by smallholders, socialized agricultural machinery services, village service stations, cooperatives and agricultural enterprises should reduce household-level adoption costs and prevent smart-agriculture programs from becoming equipment investments without sustained use.
Second, establish emissions-reduction incentives that match the intensity of technology application. Agricultural and rural emissions-reduction policies should incorporate fertilizer and pesticide reduction, water-saving irrigation, green pest management, straw incorporation and energy-efficient machinery into measurable and monitorable emissions-reduction assessments. Reductions could be linked to green subsidies, agricultural insurance premiums, green finance and carbon-inclusion schemes to offset the short-term costs of green production and convert environmental benefits into farm income.
Third, implement differentiated county-level policies and strengthen agricultural value-chain support. Lintong should consolidate the coordination among technology application, industrial chains, branding and markets to reinforce its income advantage. Neihuang should address shortcomings in product marketing, processing and brand premiums, thereby converting its low-carbon advantage into market returns. Lingwu should prioritize technology extension, energy-efficient equipment and agricultural services while developing contract farming, cold-chain logistics and stronger links between production and sales. Combining technology promotion with market-oriented, organizational and industrial conditions is essential for improving coordination between emissions reduction and income growth.
Abbreviations
GCB | Green Planting Characteristics |
IPCC | Intergovernmental Panel on Climate Change |
FAO | Food and Agriculture Organization of the United Nations |
Author Contributions
Di Haoyue: Conceptualization, Data curation, Formal Analysis, Methodology, Writing – original draft, Writing – review & editing
Funding
This work is supported by Shaanxi Provincial College Student Innovation Training Program (Grant No. XN2026015230)
Data Availability Statement
The data supporting the outcome of this research work has been reported in this manuscript.
Conflicts of Interest
The author declares no conflicts of interest.
Acknowledgments
We sincerely thank Han Zhiqian (Agricultural and Rural Bureau of Neihuang County, Henan), Zheng Yicun (Agricultural and Rural Bureau of Lingwu City, Ningxia), Song Jia (Agricultural and Rural Bureau of Lintong District, Shaanxi), relevant staff, surveyed farmers, and alumni for their generous support and assistance in our fieldwork.
References
| [1] |
Ministry of Agriculture and Rural Affairs of the People’s Republic of China. Implementation Plan for Agricultural and Rural Emissions Reduction and Carbon Sequestration. 2022.
|
| [2] |
Ministry of Agriculture and Rural Affairs of the People’s Republic of China. National Smart Agriculture Action Plan (2024-2028). 2024.
|
| [3] |
MacPherson J, Voglhuber-Slavinsky A, Olbrisch M, et al. Future agricultural systems and the role of digitalization for achieving sustainability goals: A review. Agronomy for Sustainable Development, 2022, 42(4).
https://doi.org/10.1007/s13593-022-00792-6
|
| [4] |
Finger R. Digital innovations for sustainable and resilient agricultural systems. European Review of Agricultural Economics, 2023, 50(4): 1277-1309.
https://doi.org/10.1093/erae/jbad021
|
| [5] |
Rosa L, Gabrielli P R. Achieving net-zero emissions in agriculture: A review. Environmental Research Letters, 2023, 18(6): 063002.
https://doi.org/10.1088/1748-9326/acd5e8
|
| [6] |
Papadopoulos G, Arduini S, Uyar H, et al. Economic and environmental benefits of digital agricultural technologies in crop production: A review. Smart Agricultural Technology, 2024, 8: 100441.
https://doi.org/10.1016/j.atech.2024.100441
|
| [7] |
Khanna M, Atallah S S, Heckelei T, et al. Economics of the adoption of artificial intelligence-based digital technologies in agriculture. Annual Review of Resource Economics, 2024, 16(1): 41-61.
https://doi.org/10.1146/annurev-resource-101623-092515
|
| [8] |
Wolfert S, Ge L, Verdouw C, Bogaardt M J. Big data in smart farming: A review. Agricultural Systems, 2017, 153: 69-80.
https://doi.org/10.1016/j.agsy.2017.01.023
|
| [9] |
Klerkx L, Jakku E, Labarthe P. A review of social science on digital agriculture, smart farming and agriculture 4.0: New contributions and a future research agenda. NJAS-Wageningen Journal of Life Sciences, 2019, 90-91: 100315.
https://doi.org/10.1016/j.njas.2019.100315
|
| [10] |
Wu F. Adoption and income effects of new agricultural technology on family farms in China. PLOS ONE, 2022, 17(4): e0267101.
https://doi.org/10.1371/journal.pone.0267101
|
| [11] |
Ma S, He G, Guo J. The welfare effects of digital agriculture: Decomposition from the perspectives of value recreation and redistribution. Issues in Agricultural Economy, 2022(5): 10-26.
https://doi.org/10.13246/j.cnki.iae.2022.05.006
|
| [12] |
Ma C, Liu W, Fang Y. Theoretical mechanisms and empirical evidence of digital technology-enabled income growth among farmers: Evidence from the CRRS 2022 farmer survey. China Soft Science, 2024(7): 69-78.
https://doi.org/10.3969/j.issn.1002-9753.2024.07.007
|
| [13] |
Gabriel A, Gandorfer M. Adoption of digital technologies in agriculture: An inventory in a European small-scale farming region. Precision Agriculture, 2023, 24(1): 68-91.
https://doi.org/10.1007/s11119-022-09931-1
|
| [14] |
Cheng C, Gao Q, Ju K, et al. How digital skills affect farmers’ agricultural entrepreneurship? An explanation from factor availability. Journal of Innovation & Knowledge, 2024, 9(2): 100477.
https://doi.org/10.1016/j.jik.2024.100477
|
| [15] |
Finger R, Swinton S M, El Benni N, Walter A. Precision farming at the nexus of agricultural production and the environment. Annual Review of Resource Economics, 2019, 11: 313-335.
https://doi.org/10.1146/annurev-resource-100518-093929
|
| [16] |
Tilman D, Balzer C, Hill J, Befort B L. Global food demand and the sustainable intensification of agriculture. Proceedings of the National Academy of Sciences, 2011, 108(50): 20260-20264.
https://doi.org/10.1073/pnas.1116437108
|
Cite This Article
-
APA Style
Haoyue, D. (2026). Smart Agricultural Intensity and Income—Carbon Nexus Among Wheat Smallholders in China’s Yellow River Basin. Science Innovation, 14(6), 211-222. https://doi.org/10.11648/j.si.20261406.11
 Copy
|
 Download
ACS Style
Haoyue, D. Smart Agricultural Intensity and Income—Carbon Nexus Among Wheat Smallholders in China’s Yellow River Basin. Sci. Innov. 2026, 14(6), 211-222. doi: 10.11648/j.si.20261406.11
Copy
|
Download
AMA Style
Haoyue D. Smart Agricultural Intensity and Income—Carbon Nexus Among Wheat Smallholders in China’s Yellow River Basin. Sci Innov. 2026;14(6):211-222. doi: 10.11648/j.si.20261406.11
Copy
|
Download
-
@article{10.11648/j.si.20261406.11,
  author = {Di Haoyue},
  title = {Smart Agricultural Intensity and Income—Carbon Nexus Among Wheat Smallholders in China’s Yellow River Basin},
  journal = {Science Innovation},
  volume = {14},
  number = {6},
  pages = {211-222},
  doi = {10.11648/j.si.20261406.11},
  url = {https://doi.org/10.11648/j.si.20261406.11},
  eprint = {https://article.sciencepublishinggroup.com/pdf/10.11648.j.si.20261406.11},
  abstract = {Agricultural digitalization could help reconcile farm-income growth with emissions reduction, but evidence on how the depth of smart-technology application shapes these outcomes among smallholders remains limited. Using field-survey data from 243 wheat-growing households in Neihuang, Lintong and Lingwu along China’s Yellow River, we construct a smart agricultural technology application-intensity index covering planting, irrigation and fertilization, crop protection and harvesting. We combine regression analysis with a coupling-coordination model to examine effects on per-mu net income and carbon emissions, and to assess the moderating roles of farmer education and green planting practices. Greater technology application is associated with higher per-mu net income and lower per-mu carbon emissions: the estimated coefficients are 0.0341 and −0.0979, respectively. Farmer education strengthens the income effect, whereas green planting practices weaken it in the short term. Overall, the coupling between emissions reduction and income growth is at an intermediate level, with coordination highest in Lintong, followed by Neihuang and Lingwu. These findings indicate that smart agriculture generates economic and environmental benefits when technology depth is supported by human capital, technical services and market institutions. Policies that integrate digital-skills training, production-stage services, green incentives and agricultural value-chain development could improve the alignment between farmer prosperity and low-carbon agricultural transformation.},
 year = {2026}
}
Copy
|
Download
-
TY  - JOUR
T1  - Smart Agricultural Intensity and Income—Carbon Nexus Among Wheat Smallholders in China’s Yellow River Basin
AU  - Di Haoyue
Y1  - 2026/11/10
PY  - 2026
N1  - https://doi.org/10.11648/j.si.20261406.11
DO  - 10.11648/j.si.20261406.11
T2  - Science Innovation
JF  - Science Innovation
JO  - Science Innovation
SP  - 211
EP  - 222
PB  - Science Publishing Group
SN  - 2328-787X
UR  - https://doi.org/10.11648/j.si.20261406.11
AB  - Agricultural digitalization could help reconcile farm-income growth with emissions reduction, but evidence on how the depth of smart-technology application shapes these outcomes among smallholders remains limited. Using field-survey data from 243 wheat-growing households in Neihuang, Lintong and Lingwu along China’s Yellow River, we construct a smart agricultural technology application-intensity index covering planting, irrigation and fertilization, crop protection and harvesting. We combine regression analysis with a coupling-coordination model to examine effects on per-mu net income and carbon emissions, and to assess the moderating roles of farmer education and green planting practices. Greater technology application is associated with higher per-mu net income and lower per-mu carbon emissions: the estimated coefficients are 0.0341 and −0.0979, respectively. Farmer education strengthens the income effect, whereas green planting practices weaken it in the short term. Overall, the coupling between emissions reduction and income growth is at an intermediate level, with coordination highest in Lintong, followed by Neihuang and Lingwu. These findings indicate that smart agriculture generates economic and environmental benefits when technology depth is supported by human capital, technical services and market institutions. Policies that integrate digital-skills training, production-stage services, green incentives and agricultural value-chain development could improve the alignment between farmer prosperity and low-carbon agricultural transformation.
VL  - 14
IS  - 6
ER  -
Copy
|
Download




 Share This Article
 Twitter
 Linked In
 Facebook