Research Article | | Peer-Reviewed

From Hourly Noise to Daily Signal: Machine Learning Modelling of Indoor Radon Dynamics Across Diurnal and Daily Scales

Received: 11 October 2026     Accepted: 11 November 2026     Published: 13 November 2026
Views:       Downloads:
Abstract

Radon is the leading cause of lung cancer after cigarette smoking, and studies conducted in Burkina Faso have demonstrated that its concentration can reach relatively high levels inside residential dwellings due to the presence of radiological anomalies. This concentration varies significantly, making it highly complex to understand its behavior. In the present study, predictive models were trained to estimate radon concentrations based on environmental variables such as temperature, relative humidity, and atmospheric pressure. Continuous and simultaneous measurements were carried out inside a single dwelling in the village of Sissene using a Corentium Pro monitor from May 5 to September 6. An initial Random Forest model developed using hourly data yielded unsatisfactory predictive performance, with R2 scores fluctuating between -0.8 and 0.2, specifically failing during the hourly transition periods at 06:00 and 16:00. Conversely, a second modeling approach using daily averaged data for both Random Forest and Gradient Boosting algorithms produced substantially better results. The highest predictive performances were achieved by the Random Forest model, with R2 score and RMSE of 0.392 and 12.01 Bq∙m-3 respectively, compared to the Gradient Boosting model, which obtained values of 0.277 and 13.09 Bq∙m-3 respectively. Furthermore, the ablation study identified relative humidity as the most critical predictive variable for radon estimation, followed by temperature, whereas atmospheric pressure acted as a disruptive variable for the RF architecture. For the RF model, removing humidity and temperature caused the R2 score to drop to 0.15 and 0.13 respectively, while removing pressure led to 0.08 increase. For the GB model, a massive impact was observed: the R2 score dropped to 0.49, 0.30 and 0.04 upon the removal of humidity, temperature and pressure respectively.

Published in Nuclear Science (Volume 11, Issue 2)
DOI 10.11648/j.ns.20261102.11
Page(s) 20-29
Creative Commons

This is an Open Access article, distributed under the terms of the Creative Commons Attribution 4.0 International License (http://creativecommons.org/licenses/by/4.0/), which permits unrestricted use, distribution and reproduction in any medium or format, provided the original work is properly cited.

Copyright

Copyright © The Author(s), 2026. Published by Science Publishing Group

Keywords

Radon Prediction, Random Forest, Gradient Boosting, Atmospheric Parameters, Burkina Faso, Indoor Air Quality, Corentium Pro

1. Introduction
Radon-222 is a radioactive gas originating from the decay of U-238, which has been present in the Earth's crust since the planet's formation 4.5 billion years ago. It can exhalate from the soil, construction materials, groundwater, or natural gas, accumulating inside enclosed environments through cracks and pipelines. In Burkina Faso, radiological anomalies have been identified in certain areas where radioactivity levels are significantly higher than the global average . These anomalies are prone to producing elevated amounts of radon that are imperceptible to human senses. Radon is hazardous at certain concentrations, constituting the leading cause of lung cancer after cigarette smoking. Numerous studies have been conducted in Burkina Faso to determine the spatial and spatio-temporal distribution of radon inside dwellings, schools, and offices . Other studies have investigated the evolution of diurnal radon concentrations and the influence of atmospheric parameters on indoor radon levels . However, most of these studies relied on short-term measurements ranging from a single day to one week, which remains insufficient to fully understand radon dynamics. Previous attempts to identify potential relationships between radon and atmospheric parameters using linear regressions yielded correlation coefficients that failed to establish reliable connections. To understand the behavioral dynamics of radon, we propose to investigate the relationships between indoor radon accumulation and atmospheric variations within a residential dwelling using machine learning algorithms. To achieve this, we will first determine the diurnal and daily variations of radon and atmospheric parameters to capture underlying trends. Second, we will train machine learning models using Gradient Boosting (GB) and Random Forest (RF) algorithms on both hourly and daily datasets. Following model training, feature importance and predictive performance will be analysed to identify the atmospheric parameter that best drives indoor radon concentration forecasting.
2. Materials and Methods
2.1. Measurement of Indoor Radon Concentration
Radon concentration is measured using the Corentium Pro, an electronic radon detector equipped with four detection chambers where radon is captured, identified, and quantified via gamma spectrometry. It is also fitted with sensors that simultaneously measure temperature, atmospheric pressure, and relative humidity alongside radon levels. Additionally, a motion sensor detects any movement or tampering with the equipment during data acquisition. The measured data are logged hourly, and the monitoring is performed continuously.
In the present study, data acquisition was carried out inside a single dwelling in the village of Sissene over a four month period, under the normal living conditions of the inhabitants. The selected dwelling is constructed of banco (clay mixed with straw) and features a thatched roof, as well as a door and windows made of wood and steel. The measurements were conducted from May 5 to September 5, 2025, a period that corresponds to the rainy season.
2.2. Model Evaluation Metrics
The interactions between atmospheric parameters and indoor radon concentration are highly non-linear, as indicated by previous studies . To address this challenge, this study utilizes supervised learning methods, specifically RF and GB. These tree-based models are robust against missing data and outliers, which are commonly encountered in radon measurement datasets due to the highly heterogeneous nature of its distribution. RF trains multiple decision trees in parallel and averages their predictions. Conversely, GB trains decision trees sequentially, focusing on the errors of the preceding trees; while more efficient, it is also more difficult to tune.
Both models are applied to the data encompassing radon and atmospheric parameters, such as temperature, pressure, and humidity. Radon serves as the target variable, whereas the atmospheric parameters act as the predictor variables. The models were trained on both daily data and diurnal variations (hourly data). The latter approach was chosen based on the hypothesis that different hours of the day share similar properties that could enhance the capture of interactions between indoor radon accumulation and atmospheric variability within a dwelling.
Model evaluation was conducted by calculating performance scores to quantify prediction quality on a test dataset. The score is determined by the following mean squared error (MSE) expressed by the following Root Mean Square Error (RMSE) :
RMSE=1N∑k=1Nyk-ŷk2
Where RMSE is the root mean square error, N is the number of samples, yk is the vector of the target variable (radon concentration), and ŷk is the model prediction.
A high-performing model exhibits an RMSE value that approaches zero.
The coefficient of determination is a statistical metric that measures the proportion of the variance in a dependent variable (radon) that is explained by the independent variables (temperature, humidity, and pressure) through the regression model. Its formula is given by the following expression :
R2=1-∑k=1Nyk-ŷk2∑k=1Nyk-y¯2
Where yk is the target value, ŷk is the value predicted by the model for the same sample k, N is the total number of measurements, and y¯ is the mean of all actual measured values. Its formula is given by the following relationship:
y¯=1N∑k=1Nyk
2.3. Model Validation Procedure
The modeling process began by partitioning the dataset into two subsets: 80% of the data was allocated for training, while the remaining 20% was reserved for model testing. The key modeling parameters are summarized in Table 1. A relatively large number of trees (n=1000) was chosen to guarantee the stability of both the RF and GB models. Model complexity was controlled by the maximum allowable tree depth, set to 12 for RF and 5 for GB. To prevent overly specific splits caused by statistical noise, the minimum number of observations required in a terminal node was set to 3 for RF and 5 for GB. Finally, to ensure exact reproducibility of the results, the random seed was fixed at 42 for both models.
Table 1. Configuration hyper parameters for the RF and GB models.

Parameters

Random Forest

Gradient Boosting

Number of trees/ Boosting stage

1000

1000

Maximum trees depth

12

5

Minimum samples leaf

3

5

Random seed

42

42

3. Results and Discussion
3.1. Diurnal and Daily Distribution of Radon
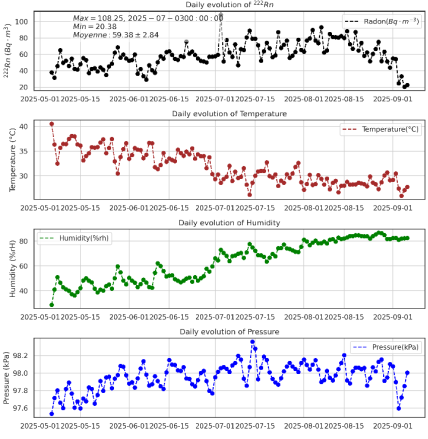
Radon concentration was measured inside a single dwelling over a four-month period to investigate the influence of atmospheric parameters on its accumulation. Variable data were recorded hourly, and daily averages were calculated. Figure 1 presents the daily evolution of radon concentration and atmospheric parameters. It can be observed that radon concentration varies between 20.38 and 108.25 Bq∙m-3, with a mean value of 59.38±2.84 Bq∙m-3. An upward trend is observed in mid-June, with high values during July and August before dropping in September. Temperature shows an inverse trend to radon, with maximum values obtained in May and June and minimum values around July and August. Humidity increases continuously, with minimum values observed in May and June and maximum values in August.
A negative correlation is distinguished between temperature and radon, while a positive correlation is observed between humidity and radon. The increase in humidity reflects the arrival of the rainy season.
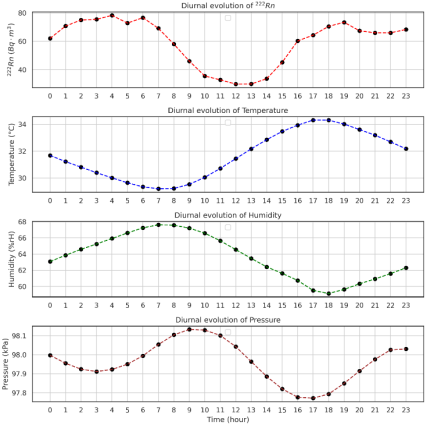
Figure 2 shows the diurnal evolution of radon concentrations relative to the atmospheric parameters of temperature, pressure, and humidity. It can be observed that peak radon concentrations are obtained between midnight and 7 a.m., and then between 5 p.m. and 11 p.m. This part of the day is characterized by stable concentrations with values well above 60 Bq∙m-3. It is also characterized by a gradual drop in temperature, which reaches its minimum around 7 a.m. Between 8 a.m. and 4 p.m., radon concentration experiences a sharp drop from 8 a.m. to 12 p.m., followed by a strong increase between 12 p.m. and 4 p.m. Nevertheless, this period of the day is characterized by lower radon concentrations, with minimum values below 40 Bq∙m-3 observed between 10 a.m. and 2 p.m. This period is also characterized by a progressive increase in temperature, which reaches its maximum around 5 p.m.
The radon and humidity curves are relatively similar, as humidity increases between midnight and 7 a.m. where it reaches its maximum, and then between 6 p.m. and 11 p.m. where it reaches a local maximum. Regarding pressure, it exhibits a semi-diurnal variation with maximum and minimum values located around 9:30 a.m. and 4:30 p.m., respectively.
These results show that a positive correlation could exist between radon and humidity, and a negative correlation between radon and temperature. Between radon and pressure, identifying a probable correlation is not quite evident at this stage.
Figure 1. Daily evolution of radon concentration and atmospheric parameters over a four-month period inside a rural dwelling.
Figure 2. Diurnal distribution of radon concentration over a four-month period inside a single dwelling located in a rural area.
3.2. Predictive Modelling of Radon Concentration
3.2.1. Predictive Modelling Using Hourly Data
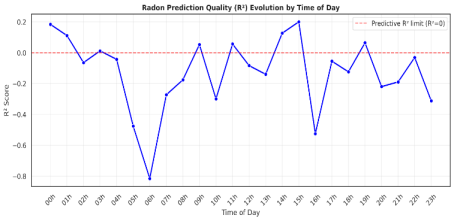
The hourly data obtained over the four-month period were grouped such that each time step of the day from 00:00 to 23:00 constitutes a sample of 124 entries. A portion of each sample, representing 80% of the data, was used for training via the RF method, while the remaining 20% was reserved for testing. Figure 3 illustrates the hourly evolution of radon prediction quality over a full day.
It can be observed that for most of the day, the model fails to effectively predict radon, as most points exhibit a negative predictive R2 value. Only 29% of the samples show a positive but low predictive value. Figure 3 highlights two critical moments at 6 a.m. and 4 p.m. where predictions become extremely inaccurate, with correlation coefficients of R2=-0.8 and R2=-0.5, respectively. At 6 a.m., a major thermal transition occurs related to sunrise. This is the moment when the nocturnal inversion layer breaks down and the air begins to mix turbulently. The model fails to anticipate the impact of these sudden variations in the variables.
Figure 3. Distribution of radon prediction quality using an RF model as a function of the hours of the day.
3.2.2. Predictive Modelling Using Daily Data
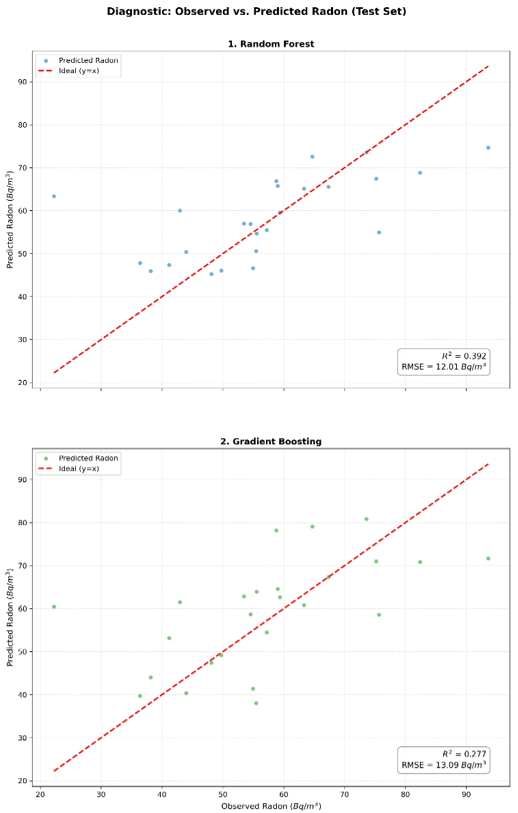
Figure 4 presents a diagnostic of radon prediction on daily data using RF and GB regression models. These models attempt to predict indoor radon concentration based on three meteorological variables: temperature, pressure, and humidity.
Figure 4. Radon prediction based on temperature, humidity, and pressure using RF (top) and GB (bottom) models on daily data.
Table 2. Overall performance of the two methods.

Model

R2

RMSE

Random Forest

0.392

12.01 Bq∙m-3

Gradient Boosting

0.277

13.09 Bq∙m-3

The red dashed line in Figure 4 represents the ideal scenario where the prediction perfectly matches the actual values. It can be observed that both models display a broad horizontal dispersion and a more restricted vertical dispersion. For low radon concentrations, the data clusters lie above the line, whereas for high concentrations, the data points fall below the ideal scenario line. This indicates that the models tend to overestimate low concentrations and underestimate high concentrations. Furthermore, for extreme radon values exceeding 80 Bq∙m-3, both models fail to predict proportionally high values, with predictions simply capping out around 70 Bq∙m-3.
Table 2 displays the performance of the RF and GB models in predicting indoor radon concentration based on atmospheric parameters. The RF model achieved an R2 score of 0.392 and an RMSE of 12.01 Bq∙m-3, whereas the GB model yielded an R2 of 0.277 and an RMSE of 13.09 Bq∙m-3. These results demonstrate that the RF model significantly outperforms the GB model, as evidenced by its higher R2 score and lower RMSE. Consequently, this modelling approach establishes the superior performance of RF over GB for this dataset.
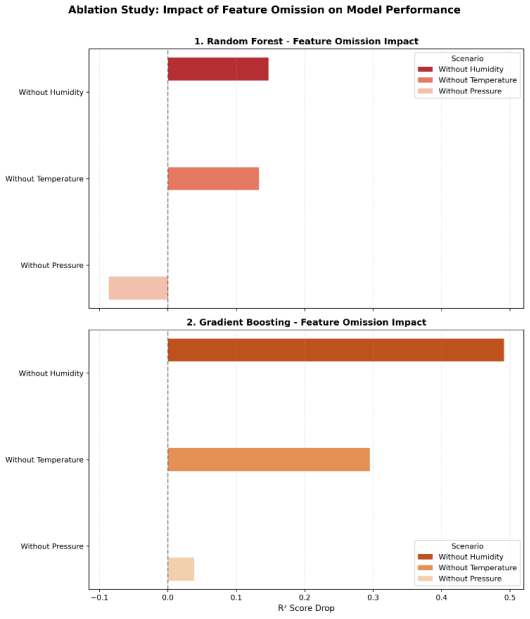
The RF model trained on daily data shows a clear improvement compared to the hourly model analysed in the previous section, which yielded negative scores. However, performance remains moderate because atmospheric parameters alone cannot fully account for the behavioural dynamics of indoor radon accumulation. To assess variable importance in both models, a feature ablation study was conducted, which consists of removing one variable at a time while keeping the other two to observe whether the model improves or deteriorates. Figure 5 presents the results of these ablation studies for both models. This study measures feature importance by observing the drop in the R2 score when a predictor variable is removed from the model. The further the bar extends toward positive values, the more performance the model loses without that specific variable.
It can be observed that both models perfectly agree on the order of importance of the meteorological variables for predicting radon concentration. Humidity constitutes the most important variable for both algorithms, followed by temperature in second place. Pressure exhibits less influence on model performance, confirming the observations previously made in Figure 2.
In the case of RF, removing humidity causes the R2 score to drop by approximately 0.15, and removing temperature leads to a drop of 0.13. The model remains relatively stable even when deprived of one of these two variables. When pressure is removed, the bar moves toward a negative value of about -0.08. This signifies that the R2 score improves when pressure is excluded from the RF model. Because RF constructs its trees through random feature sampling, atmospheric pressure seems to act as background noise or a redundant variable. Its exclusion allows the trees to focus solely on the clear signals from humidity and temperature, thereby optimizing the model's generalization capability.
Figure 5. Effects of the ablation of different predictor variables on the RF (top) and GB (bottom) models.
In the case of GB, a massive impact is observed during feature omissions. When humidity is removed from the model, the R2 score collapses by nearly 0.49, and it drops by 0.30 when temperature is omitted. Unlike RF, removing pressure slightly penalizes GB with a minor drop of 0.04.
These results confirm that humidity carries the major predictive signal for radon. They also demonstrate the robustness of the RF model, which is capable of adapting to the loss of a variable and identifying pressure as noise. Furthermore, they highlight the vulnerability of GB, whose performance depends excessively and disproportionately on the humidity variable alone, confirming its more unstable profile.
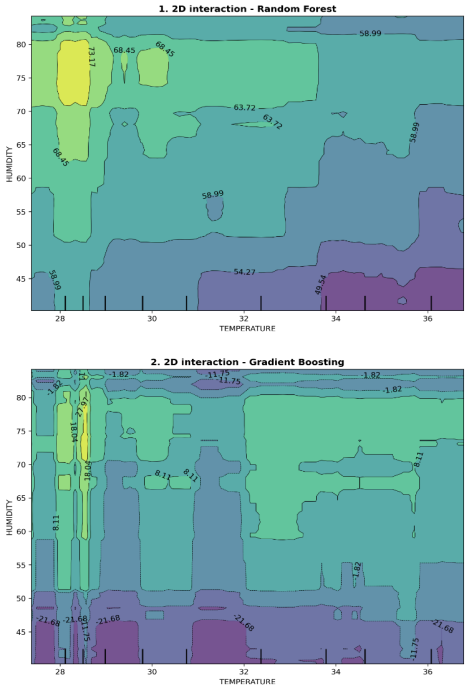
Figure 6 illustrates the joint effects of temperature and humidity on radon concentration prediction for both models. In the RF model, it can be noted that the major color transitions occur vertically, and the highest predictions are observed when humidity exceeds 65%. The model precisely localizes the peak maximum concentration of 73.17 Bq∙m-3 within a window combining cool temperature and high humidity. Conversely, hot and dry air causes the prediction to drop to its minimum of 49.54 Bq∙m-3.
In the GB model, a staircase-like behavior is observed, characterized by an extremely fragmented profile with rigid, angular contour lines and rectangular block structures. It identifies the same maximum prediction zone but with abrupt transitions around this area.
Figure 6. Joint effect of temperature and humidity on radon prediction in the RF (top) and GB (bottom) models.
4. Conclusions
This study models the environmental dynamics of radon-222 based on atmospheric parameters such as temperature, pressure, and humidity. The results demonstrated that radon concentration increases with humidity and decreases with temperature. Pressure does not exhibit any apparent correlation, which was further confirmed by the supervised learning models. The evaluation of hourly predictive performance showed extremely low scores (R2 varied from -0.8 to 0.2), leading us to consider daily data, which are likely to reduce the fluctuations in measured values caused by the highly heterogeneous nature of radon concentrations. The comparison of the algorithms on daily data establishes the superiority of RF (R2=0.392; RMSE =12.01 Bq∙m-3) over GB (R2=0.277; RMSE =13.09 Bq∙m-3). Concurrently, the ablation study validates humidity as the most critical variable for radon prediction in both models, followed by temperature, while pressure proves to be marginal or even disruptive for RF. Although radon trends are strongly linked to humidity and temperature profiles, the exclusive use of these parameters remains insufficient to achieve a perfect prediction. The present study has shown that very short-term measurements, on the order of one hour for example, are disrupted by statistical noise, making it difficult to perceive a probable evolutionary trend between radon and atmospheric parameters. A significant evolution was observed in daily measurements.
It would be advisable to consider modelling based on weekly or monthly data. To achieve this, measurements must be carried out for at least one year. Indoor humidity and temperature alone are not sufficient to predict indoor radon concentration. It would be necessary to test the addition of other parameters, such as outdoor temperature and humidity, and to consider a dwelling kept closed throughout the study period in order to reduce the influence of human activity and capture solely the dynamic behaviour of radon.
Abbreviations

GB

Gradient Boosting

RF

Random Forest

MSE

Mean Squared Error

RMSE

Root Mean Square Error

Acknowledgments
The authors are thankful to Thomas SANKARA University and IAMGOLD-ESSAKANE society for granting the acquisition of Airthing Pro devices for measurement.
Author Contributions
Cedric Elisee Beogo: Conceptualization, Investigation, Writing – original draft
Wepari Charles Yaguibou: Data curation, Visualization, Writing – review & editing
Eric Korsaga: Formal Analysis, Methodology, Writing – review & editing
Funding
The authors have no relevant financial or non-financial interests to disclose. The authors have no competing interests to declare that are relevant to the content of this article. All authors certify that they have no affiliations with or involvement in any organization or entity with any financial interest or non-financial interest in the subject matter or materials discussed in this manuscript. The authors have no financial or proprietary interests in any material discussed in this article.
Data Availability Statement
The data is available from the corresponding author upon reasonable request.
Conflicts of Interest
The authors declare no conflicts of interest.
References
[1] Beogo C. E., Cisse O. I., Zougmore F. (2022) Assessment of radiological hazards from soil samples in the Northeastern area of Burkina Faso. SN Applied Sciences, 4(3): 73.
[2] Beogo C. E, Cisse O. I., Ansong M., Zougmore F. (2024) Gamma‐Ray Spectrometry of Soil Samples From a Pilot Site of Uranium Anomaly in the Sahel Region of Burkina Faso. Applied and Environmental Soil Science, 2024(1): 1-14.
[3] Beogo C. E, Cisse O. I. and Zougmore F. (2024) Spatial distribution of Cesium-137 in the Northeastern part of Burkina Faso, in: 2024 IEEE Multi-Conference on Natural and Engineering Sciences for Sahel’s Sustainable Development (MNE3SD), 1-6.
[4] Derra M., Bambara L. T., Kaboré K., Sawadogo Y. Z., Cisse O. I., Zougmoré F. (2024) Measurement of Radon Concentration and Estimation of Cancer Risk in Twenty-Four Model Houses in the Town of Koudougou. Open Journal of Applied Sciences, 14(1): 193-204.
[5] Bambara L. T., Kaboré K., Derra M., Beogo C. E., Cisse O. I., Zougmore F. (2021) Assessment of Indoor Radon Concentration in Residential Buildings at Ouagadougou and Estimation of the Annual Effective Dose. Radiation Science and Technology, 7(1): 41-46.
[6] Bambara L. T., Doumounia A., Kohio N., Ouedraogo S., Zougmore F. (2022) Radon Level in Burkina Faso Student Residence and Estimation of the Annual Effective Dose. Asian Jounal of Scientific Research 15: 31‑38.
[7] Rouamba J. M. M., Bambara L. T., Doumounia A., Kohio N., Ouedraogo S., Zougmore F. (2023) Evaluation of Radon Concentration and the Health Risk in the Offices of the Institute of Science and Technology of the “Ecole Normale Superieure”, Burkina Faso. World Journal of Nuclear Science and Technology, 13: 41-54.
[8] Bambara L. T., Derra M., Kabore K., Cisse O. I., Zougmore F. (2023) Indoor Radon Concentration in Some Schools in Kaya, Burkina Faso. Physics and Materials Chemistry, 9(1): 8‑13.
[9] Elola W. A., Bambara T. L., Doumounia A., Kohio N., Ouedraogo S., Zougmore F. (2023) Assessment of radon concentrations inside residential buildings and estimation of the dose in the city of Kaya, Burkina Faso. Open Journal of Applied Sciences, 13: 1066-1078.
[10] Beogo C. E., Yaguibou W. C., Bambara, L. T. (2026) Spatial and temporal variability of radon and meteorological parameters in the dwellings of Villy. Sci Rep 16, 27886.
[11] Beogo C. E., Yaguibou W. C., Bambara, L. T. (2026). Spatial and temporal variability of radon concentration with atmospheric parameters inside dwellings of Sissene, Burkina Faso. International Journal of Physical Sciences, 21(2), 29-40.
[12] Chai T., Draxler, R. R. (2014) Root mean square error (RMSE) or mean absolute error (MAE)? – Arguments against avoiding RMSE in the literature. Geoscientific Model Development, 7(3), 1247-1250.
[13] Geron A. (2019) Hands-on Machine Learning with Scikit-Learn, Keras, and TensorFlow: Concepts, Tools, and Techniques to Build Intelligent Systems. 2nd Edition, O’Reilly Media.
[14] Chicco D, Warrens MJ, Jurman G. The coefficient of determination R-squared is more informative than SMAPE, MAE, MAPE, MSE and RMSE in regression analysis evaluation. PeerJ Comput Sci. 2021 Jul 5; 7: e623.
Cite This Article
  • APA Style

    Beogo, C. E., Yaguibou, W. C., Korsaga, E. (2026). From Hourly Noise to Daily Signal: Machine Learning Modelling of Indoor Radon Dynamics Across Diurnal and Daily Scales. Nuclear Science, 11(2), 20-29. https://doi.org/10.11648/j.ns.20261102.11

    Copy | Download

    ACS Style

    Beogo, C. E.; Yaguibou, W. C.; Korsaga, E. From Hourly Noise to Daily Signal: Machine Learning Modelling of Indoor Radon Dynamics Across Diurnal and Daily Scales. Nucl. Sci. 2026, 11(2), 20-29. doi: 10.11648/j.ns.20261102.11

    Copy | Download

    AMA Style

    Beogo CE, Yaguibou WC, Korsaga E. From Hourly Noise to Daily Signal: Machine Learning Modelling of Indoor Radon Dynamics Across Diurnal and Daily Scales. Nucl Sci. 2026;11(2):20-29. doi: 10.11648/j.ns.20261102.11

    Copy | Download

  • @article{10.11648/j.ns.20261102.11,
      author = {Cedric Elisee Beogo and Wepari Charles Yaguibou and Eric Korsaga},
      title = {From Hourly Noise to Daily Signal: Machine Learning Modelling of Indoor Radon Dynamics Across Diurnal and Daily Scales},
      journal = {Nuclear Science},
      volume = {11},
      number = {2},
      pages = {20-29},
      doi = {10.11648/j.ns.20261102.11},
      url = {https://doi.org/10.11648/j.ns.20261102.11},
      eprint = {https://article.sciencepublishinggroup.com/pdf/10.11648.j.ns.20261102.11},
      abstract = {Radon is the leading cause of lung cancer after cigarette smoking, and studies conducted in Burkina Faso have demonstrated that its concentration can reach relatively high levels inside residential dwellings due to the presence of radiological anomalies. This concentration varies significantly, making it highly complex to understand its behavior. In the present study, predictive models were trained to estimate radon concentrations based on environmental variables such as temperature, relative humidity, and atmospheric pressure. Continuous and simultaneous measurements were carried out inside a single dwelling in the village of Sissene using a Corentium Pro monitor from May 5 to September 6. An initial Random Forest model developed using hourly data yielded unsatisfactory predictive performance, with R2 scores fluctuating between -0.8 and 0.2, specifically failing during the hourly transition periods at 06:00 and 16:00. Conversely, a second modeling approach using daily averaged data for both Random Forest and Gradient Boosting algorithms produced substantially better results. The highest predictive performances were achieved by the Random Forest model, with R2 score and RMSE of 0.392 and 12.01 Bq∙m-3 respectively, compared to the Gradient Boosting model, which obtained values of 0.277 and 13.09 Bq∙m-3 respectively. Furthermore, the ablation study identified relative humidity as the most critical predictive variable for radon estimation, followed by temperature, whereas atmospheric pressure acted as a disruptive variable for the RF architecture. For the RF model, removing humidity and temperature caused the R2 score to drop to 0.15 and 0.13 respectively, while removing pressure led to 0.08 increase. For the GB model, a massive impact was observed: the R2 score dropped to 0.49, 0.30 and 0.04 upon the removal of humidity, temperature and pressure respectively.},
     year = {2026}
    }
    

    Copy | Download

  • TY  - JOUR
    T1  - From Hourly Noise to Daily Signal: Machine Learning Modelling of Indoor Radon Dynamics Across Diurnal and Daily Scales
    AU  - Cedric Elisee Beogo
    AU  - Wepari Charles Yaguibou
    AU  - Eric Korsaga
    Y1  - 2026/11/13
    PY  - 2026
    N1  - https://doi.org/10.11648/j.ns.20261102.11
    DO  - 10.11648/j.ns.20261102.11
    T2  - Nuclear Science
    JF  - Nuclear Science
    JO  - Nuclear Science
    SP  - 20
    EP  - 29
    PB  - Science Publishing Group
    SN  - 2640-4346
    UR  - https://doi.org/10.11648/j.ns.20261102.11
    AB  - Radon is the leading cause of lung cancer after cigarette smoking, and studies conducted in Burkina Faso have demonstrated that its concentration can reach relatively high levels inside residential dwellings due to the presence of radiological anomalies. This concentration varies significantly, making it highly complex to understand its behavior. In the present study, predictive models were trained to estimate radon concentrations based on environmental variables such as temperature, relative humidity, and atmospheric pressure. Continuous and simultaneous measurements were carried out inside a single dwelling in the village of Sissene using a Corentium Pro monitor from May 5 to September 6. An initial Random Forest model developed using hourly data yielded unsatisfactory predictive performance, with R2 scores fluctuating between -0.8 and 0.2, specifically failing during the hourly transition periods at 06:00 and 16:00. Conversely, a second modeling approach using daily averaged data for both Random Forest and Gradient Boosting algorithms produced substantially better results. The highest predictive performances were achieved by the Random Forest model, with R2 score and RMSE of 0.392 and 12.01 Bq∙m-3 respectively, compared to the Gradient Boosting model, which obtained values of 0.277 and 13.09 Bq∙m-3 respectively. Furthermore, the ablation study identified relative humidity as the most critical predictive variable for radon estimation, followed by temperature, whereas atmospheric pressure acted as a disruptive variable for the RF architecture. For the RF model, removing humidity and temperature caused the R2 score to drop to 0.15 and 0.13 respectively, while removing pressure led to 0.08 increase. For the GB model, a massive impact was observed: the R2 score dropped to 0.49, 0.30 and 0.04 upon the removal of humidity, temperature and pressure respectively.
    VL  - 11
    IS  - 2
    ER  - 

    Copy | Download

Author Information
  • University Centre of Dori, Thomas SANKARA University, Ouagadougou, Burkina Faso;Laboratory of Materials and Environment (LAME), Joseph KI-ZERBO University, Ouagadougou, Burkina Faso
  • University Centre of Dori, Thomas SANKARA University, Ouagadougou, Burkina Faso;Laboratory of Materials and Environment (LAME), Joseph KI-ZERBO University, Ouagadougou, Burkina Faso

  • Laboratory of Materials and Environment (LAME), Joseph KI-ZERBO University, Ouagadougou, Burkina Faso