Research Article | | Peer-Reviewed

Land Suitability Analysis and Mapping Using Geospatial Technique and Multi Criteria Decision Analysis for Urban Green Area of Goba Town, Oromia, Ethiopia

Received: 15 August 2024     Accepted: 6 September 2024     Published: 23 September 2024
Views:       Downloads:
Abstract

Urban green areas have a significant role in improving human well-being in a variety of ways, providing ecosystem services, optimizing the health of urban residents, and making a great contribution to environmental health. However, there are very limited studies or not yet conducted on urban green area suitability analysis using geospatial technique and MCDA that support decision-makers, urban green area planners, and managements. The objective of this study is to analyze the factors that determine land suitability for urban green areas and to develop an urban green area suitability map for Goba Town using geospatial technique and the MCDA-AHP approach. In this study, GIS-based multi-criteria analysis (MCA) has been adopted to select suitable sites for urban green areas. The methodology involves a structured framework to identify and prioritize areas suitable for urban green development based on six key determinant factors: viz., land use land cover (LULC), elevation, proximity to settlements, distance to main rivers, slope, and distance to roads. The generated suitability map was validated by comparing it to existing green areas and conducting field surveys to verify the model's accuracy. The results of the study revealed that about 877.92 ha (18.31%), 1506.46 ha (31.41%), 1280.76 ha (26.71%), 756.05 ha (15.76%), and 373.71 ha (7.79%) were very low, low, moderate, high, and very high, respectively. The finding of the current study supports, as a baseline, assisting local governments and environmental agencies in sustainable urban development and forming resilient cities in advance of environmentally dynamic dynamics. Inclusion GIS and MCDA-based land suitability analysis provides a comprehensive framework for urban green area planning. Future studies might recommend using ecosystem service valuation as a factor in determining land suitability for green areas. Furthermore, various stakeholders need to work on the management of urban green areas and the community's awareness creation on urban green area ownership.

Published in Landscape Architecture and Regional Planning (Volume 9, Issue 2)
DOI 10.11648/j.larp.20240902.11
Page(s) 25-37
Creative Commons

This is an Open Access article, distributed under the terms of the Creative Commons Attribution 4.0 International License (http://creativecommons.org/licenses/by/4.0/), which permits unrestricted use, distribution and reproduction in any medium or format, provided the original work is properly cited.

Copyright

Copyright © The Author(s), 2024. Published by Science Publishing Group

Keywords

Analytical Hierarch Process, GIS, Suitability Determinant Factors, Urban Green Area

1. Introduction
Urban green areas are part of green infrastructure. They are an important part of the city's public open spaces and shared services and can act as a health-enhancing environment for all members of the urban community, improving quality of life . Comprehensive land use and urban settlement plans are urgently needed, considering the creation and maintenance of urban green areas such as parks, gardens, and street vegetation, to achieve sustainable green urbanization . In Ethiopia, most urban centers fail to meet the WHO’s proposed minimum standard of 9 square meters of urban green space per person . In addition, urban green area components are inaccessible and urban dwellers are reluctant to use them because they are underdeveloped and lack basic facilities .
Urbanization leads to the occupation of green areas and directly contributes to the high degree of fragmentation of urban green areas which in turn causes many socio-economic and ecological problems. Therefore, understanding the links between urban green area patterns and urbanization processes . Numerous studies have been carried out to specifically analyze the characteristics of green areas and their potential locations in European or foreign contexts . Although some green space research has been conducted in developing countries, the available studies focus mainly on the evaluation of urban green areas and less on considering suitability analyses for choosing green areas suitable sites.
Analyzing the suitability of urban green areas determines whether the land resource is suitable for a particular use various factors such as LULC type (land use and land cover), slope, elevation, Select suitable locations, a multi-criteria decision analysis (MCDA) approach integrated into the Geographic Information System (GIS) is used increasingly used . The MCDA methodology has been used in developed and developing countries to select agricultural land and analyze suitability for urban green areas, industrial land, residential land, landfills, wind farms, disaster areas, health centers, and education centers.
Despite the many benefits mentioned above, urban green space is becoming increasingly scarce due to increasing urbanization and unplanned urban growth, lack of proper site selection and planning, and lack of consideration of population criteria. This degrades both the quality and quantity of urban green space and does not meet urban center requirements for living in urban green space. Therefore, sustainably maximizing the value that green space provides to urban residents and their environment, taking into account environmental and socioeconomic factors, must be carefully planned and appropriately managed within the reach of local communities. Therefore, this study amid with the objective to Analysis and Mapping Land Suitability using Geospatial Technique and MCDA for Urban Green Area for Goba Town.
2. Methods and Materials
2.1. Description of the Study Area
The Town of Goba is located southeast of Addis Ababa, about 445 km, or 15 km, from the capital of the Bale (Robe) Zone. Geographically, Goba lies at approximately 6°58'0" to 70'4'30" north latitude and 39°56'0" to 4001'0" east longitude. Therefore, the compactness determined by computing the Town base map is 1.6. This means that the shape of the city does not have the same physical features associated with the presence of rivers, streams, and canyons in different parts of the city (Figure 1).
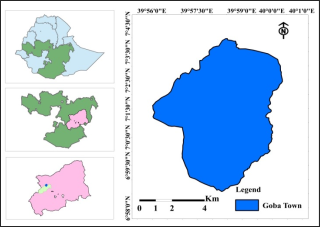
Figure 1. Location Map of Goba Town of Bale Zone, Oromia, Ethiopia.
2.2. Topography
Goba is one of the highland towns at the foot of the Bale Mountains, characterized by rugged landscapes. The southern part is mostly homogeneous, while the eastern and northern parts are rugged terrain and rolling plains. The river sections, especially the Togona, Bamu, and Micha Rivers, are characterized by deeply carved ravines. The undulations of Goba Town lie between 2523 and 2800 m above mean sea level. The highest point is over 2800 meters above sea level at the top of St. Michel's Church in the south of the Town, and the lowest point is 2523 meters above sea level along Robe Street on the northern edge of the Town. The average altitude of the Town is about 2662 m above mean sea level. Based on the Town's topographic maps, the Town was found to be at its highest elevation very close to or below the Bale Mountains. The Town is located at the foot of a mountain, which causes flooding in the Town area.
The slope ranges from 0 to 43.70%, with steep regions of slope over 20 to 43.70%. A typical example of such slopes can be found around the Church of Saint-Michel. Therefore, the area can be considered an excessively sloping area for urban development activities. However, most of Goba Town is located on a slope of 1 to 10° degrees and is suitable for urban development. Rivers and cliffs also have areas used at 10-15°. Best left to forest cover and urban agriculture after providing the necessary buffer.
2.3. Research Methods
Goba Town's green area suitability analysis was analyzed using ArcGIS software, and the multi-criteria decision analysis using the analytical hierarchical process (AHP) method was used using both primary and secondary data sources. Primary data collected directly from primary sources include surveys, questionnaires, interviews, and GPS surveys. Several qualitative and quantitative techniques were used in this study. In addition, primary data sources included key informant surveys of households, professionals, government agencies, and some urban residents. Secondary data sources include population data and topographic maps. Most of the studies were conducted in the city using visual observation methods to confirm satellite imagery information. ArcGIS 10.5 was used to create the urban green area suitability indicator element. After the required covering materials were provided, a questionnaire on urban community agriculture was developed for analysis.
2.4. Research Design
Both quantitative and qualitative data (a mixed approach) were used to address the benefits, drivers, and management of green areas. The reason for using this method is to compare results from two different perspectives, as using only quantitative methods can obscure important facts from qualitative methods . According to , mixed design involves more than just a combination of qualitative and quantitative techniques. The early stages of the design dealt with qualitative data collection and analysis supported by quantitative data collection analysis.
2.5. Data Types and Sources
Land Use/Land Cover (LULC): Satellite imagery (Landsat, Sentinel-8). Digital Elevation Model (DEM): SRTM, ASTER GDEM. Soil Type and Characteristics: FAO Global Soil Map, national soil surveys. Hydrology Data (Water Bodies, Rivers): USGS, local geospatial databases and to analyze proximity to water resources, affecting greening projects (Table 1).
Table 1. Data types and sources.

Data set

Source

Resolution

Purpose

LULC

Ortho-photo

30 m

LULC Map

Digital Elevation

https://earthdata.nasa.gov/

30 m

Slope

GPS field survey

Survey

Ground truth

2.6. Methods of Data Analysis
After collecting data from various sources, the data were analyzed using various software such as ArcGIS 10.5. ArcGIS spatial analysis cross-tabulation was used to drive the change matrix. Data analysis was performed using qualitative and quantitative descriptions. Data were collected through a variety of mechanisms (interviews with key informants, non-quantitative information from open-ended questions, observations, tabulation, analysis, and interpretation performed qualitatively through description).
After the criterion map and weights were developed and established, the decision rule of multiple criterion analysis was used. As pointed out by , common decision rules in the multi-criteria analysis are weighted linear overlays, pairwise comparison matrices, and standardized parameter coefficients for urban green area suitability.
2.7. Multi Criteria Decision Analysis
The analysis studies for green areas require large amounts of spatial and non-spatial data that can be easily and efficiently processed in GIS software. The analysis of factors for green areas can be viewed as a multi-criteria decision analysis (MCDA) process, which when combined with ArcGIS software can be a powerful approach for analyzing suitability for green areas . GIS techniques play an important role in spatial analysis, but MCDA provides an extensive collection of data tools for structuring decision-making problems and evaluating and prioritizing alternative decisions.
2.8. Analytical Hierarchy Process
They were based on multi-criteria decision analysis (MCDA) using the Analysis Hierarchy Process (AHP), and the thematic layer maps were weighted. The GIS software was integrated with an analytical hierarchical process (AHP). The vari1ous thematic layers selected include slope, elevation, LULC, proximity to settlements, proximity to roads and proximity to rivers.
The weighting of these factors were based on the literature review, expert opinion, and multi-discipline field survey local condition experience on urban land managements. Comparisons was made utilizing the 1–9 scale, indicating how often one shift is more important than another shows the scaling used in AHP (Table 2).
If the matrix formed is equal to bij, then aij = wi/wj, where w is the weight of each parameter, the element of all elements of each positive number i, j=1….n and the reciprocal property bnij = i /bij, what is called the matrix inverse.
Table 2. Saatty’s, scale of intensity relative importance.

Intensity of relative important

Definition

1

Equal importance

2

Weak or slight

3

Moderate importance

4

Moderate Plus

5

Strong importance

6

Strong plus

7

Very strong

8

very very strong

9

Extremely importance

The consistency index (CI), which defines the consistency coefficient of the pairwise comparison matrix, was estimated using equation (1).
CI=λmax-nn-1(1)
Calculation of the consistency index relies on the λmax value using Equation (1) . The weights of each factor were calculated by the pairwise comparison matrix and the maximum eigenvalue (λmax) of the normalized matrix was calculated using equation (2).
λmax=1n in=1j=1naijwjwi(2)
A random consistency index (RI) served as a means of determining the degree of consistency, or a consistency ratio (CR) was calculated using (Equation 3 and Table 3).
CR=CIRI(3)
Table 3. Random consistency index.

Matrix size

1

2

3

4

5

6

7

8

9

10

RI

0

0

0.58

0.9

1.12

1.24

1.32

1.41

1.45

1.51

2.9. Weight Assigning and Normalization
Apply the AHP technique to normalize the weights assigned to different thematic layers. As shown in (Table 3), a value of 1 indicates equal importance for the two factors, and a value of 9 indicates that one factor is very important compared to the other. According to , the tolerance/value of CR should be less than 0.1.
2.10. Overlay Weighted Analysis
Urban green area suitability Map were mapped using the weighted index overlay method in ArcGIS 10.3. Weight assignment was done by assigning new weight values to map sub-units (sub-criteria) calculated from the AHP. The reclassified tools in ArcGIS 10.5 Spatial Analyst tools were used for this task. Finally, a map of urban green area suitability was created by overlaying all thematic layers using the weighted overlay analysis tool.
3. Results and Discussions
3.1. Factors for Urban Green Area Suitability
3.1.1. Land Use Land Cover
The result of the study shows that area coverage land uses land cover (LULC) for open shrub land 1186.42 ha (24.76%), Build area 1035.58 ha (21.61%), forest land 1003.14 ha (20.93%), settlement 847.86 ha (17.68%) and cultivated land 721.90 ha (15.06%) occupation. These land suitability analysis classes of LULC of the study area were done in five classes this is very high suitability, high suitable moderate suitability very low suitable, and low suitable (Figure 2 and Table 4). LULC has different components driving forces, change land itself . The driving forces interact like climate change, human activities, urbanization, and population growth, and Government policy influences the green area land use policy, urban utility planning, and resettlement.
Land use and land cover increasingly deal with the problems of uncontrolled development, environmental degradation, and loss of environmental resources. Forest cover, destruction of green spaces, loss of open shrub land and wildlife habitat. Land-use data are necessary for analyzing environmental processes and issues to understand that living conditions and standards need to be improved or maintained at current levels . The land use areas of the city are forests, open shrub land, cultivated land, construction areas, and settlement areas. Parts of the city are designated as urban green spaces, as much of the area is covered with open shrub land. The northeast is important for urban green space, recreation and development, land expansion, and agricultural land reduction, with suburban and urban areas occupying residential areas, green space in the central area declining, and roadsides asphalted.
Table 4. Land use land covers for green area and its level of suitability.

Land use types

Area (ha)

Area (%)

Level of suitability

Value score

Forest Land

1003.14

20.92

Very high suitability

5

Open Shrub land

1186.42

24.74

High suitability

4

Cultivated land

721.90

15.05

Moderate suitable

3

Build Up area

1035.58

21.61

Very low suitable

2

Settlement

847.86

17.68

Low suitable

1

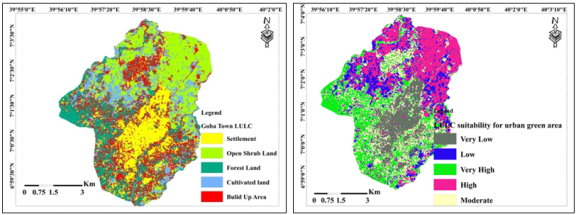
Figure 2. Land Use Land cover and its suitability map for Goba Town.
3.1.2. Proximity to Road
As the results revealed that the road on the bases of the urban green area site suitability analysis classified as per the standard in which distances from 0 – 400 m, 400 – 800 m, 800 - 1000 m, 1000 to 1500 m while >1500 m categorized into very high suitable, high suitable; moderately suitable, low suitable and very low suitable for urban green area, respectively (Figure 3 and Table 5). Likewise, adopted similar classification ranges for road suitability class for urban green area suitability. This shows that the green area site is preferable when it is located at a suitable distance from roads to access transportation and accessed by the community to benefit from it. The roads affect the land suitability analysis of urban green spaces areas with access to local roads such as gravel-soil roads, asphalt, and roads important for urban green area development .
Table 5. Reclassified distance from Road coverage of green area.

Distance from Road

Suitability class

Ranks

0–400 m

Very high suitable

5

400–800 m

High suitable

4

800–1000 m

Moderately suitable

3

1000–1500 m

Very low suitable

2

> 1500

Low suitable

1

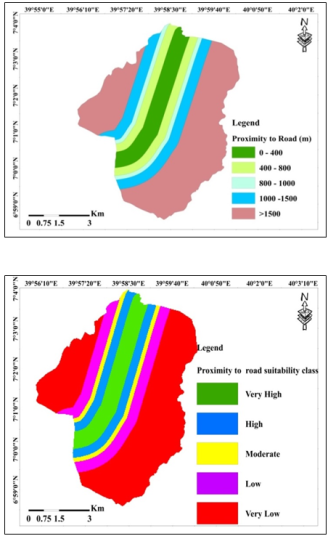
Figure 3. Proximity of the Road suitability map of the town.
3.1.3. Proximity to Water Source
As the results revealed that the proximity to water sources on the bases of the urban green area site suitability analysis classified as per the standard in which distances from 0 – 250 m, 250 - 500 m, 500-1000 m, 1000 – 1500 m and > 1500 m categorized into very high suitable, high suitable; moderately suitable, low suitable and very low suitable for urban green area, respectively (Figure 4 and Table 6). Likewise, adopted similar classification ranges for road suitability class for urban green area suitability. These closest lands to the stream banks get more preferences and it is to maintain the environmental health of the so that taken as suitable site for green area. According to the reclassified data, the central part of the town lands is nearest to the water source which means the river Togona and Bamo are very highly suitable for the urban green area (Figure 4 and Table 6). Similarly, , noted that lands closest to water resources like rivers, lakes, and reservoirs are highly suitable for green area development. Additionally, the nearest to water sources is very important and rich in biodiversity which supports as recreational sites.
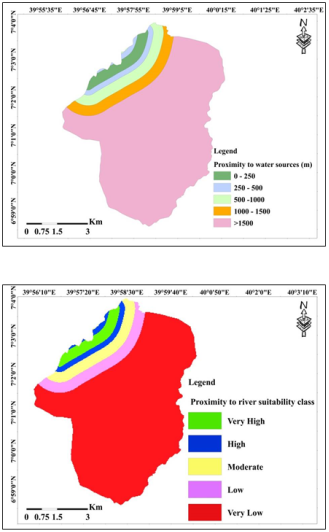
Figure 4. Proximity water source and its suitability map of Goba town.
Table 6. Reclassification Distance from Water Source.

Distance from river

Suitability class

Ranks

>1500 m

Very Low

1

1000-1500 m

Low

2

500 m-1000 m

Moderately suitable

3

250-500 m

High suitable

4

0-250 m

Very high suitable

5

3.1.4. Elevation Classes
The results showed that elevation classes were classified based on urban green area suitability analysis according to the standard 2523-2600 (very high suitable), 2600-2650 (high suitable), 2650-2700 (moderately suitable), 2700-2800 (low suitable), and >2800 (very low suitable) (Figure 5 and Table 7). Likewise, adopted similar classification ranges for road suitability class for urban green area suitability.
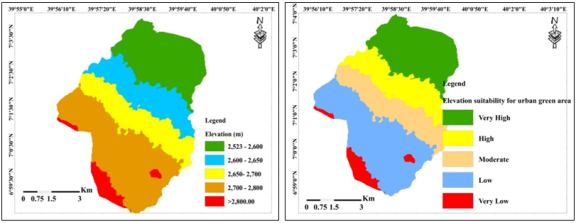
Figure 5. Land suitability analysis elevation factor map of Goba Town.
Table 7. Elevation classes for green area and its level of suitability.

Elevation class (m)

Area (ha)

Area (%)

Level of suitability

Rank

2523-2600

211.56

4.41

Very high suitability

5

2600–2650

1694.42

35.34

High suitability

4

2650–2700

851.41

17.76

Moderate suitable

3

2700–2800

823.06

17.17

Very low suitable

2

> 2800

1214.45

25.32

Low suitable

1

The total area of Goba town, about elevation in the classification area 2523-2600 the cover area is 211.56 ha (4.41%), 2600-2650 elevation cover is 1694.42 ha (35.34%), 2700-2800 total area 851.41 ha (17.76%) and greater than 2800 elevation 1214.45 ha (25.32%) Goba towns the highest elevation low suitable for urban green spaces development (Figure 5 and Table 7). Elevation also plays an important role and should be considered as a major factor when analyzing urban green space suitability .
3.1.5. Slope Factor
The slope value is classified into five classes namely, flat (0 - 5°), gently slopes (5-10°), moderately slope (10-15°), sloppy (15-20°) while step sloppy (20-43.70°) (Figure 6 and Table 8). The gentle slope is more highly suitable than the land with a steep slope. Therefore, this study thesis low suitable 20-43.70° is the highest slope not conservation of green area development. Most of the central as well as the peripheral part of the study area slope is categorized as the suitable class for urban green space development. From the total area around slope class 0-5° for the total area coverage 2121.84 ha (44.25), the highest coverage important for green area development, from the 5-10° slope class 1954.82 ha (40.77%), 10-15° the area coverage 548.99 ha (11.45%), 15-20° in cover 119.02 ha (2.48%) and 20-43.70°, 50.23 ha (1.05%) slope class are low green area development. The low slopes are very highly suitable for developed green areas .
Table 8. Slope classes for green area and its level of suitability.

Slope class (%)

Area (ha)

Area (%)

Level of suitability

Value score

0–5

2121.84

44.25

Very high suitability

5

5–10

1954.82

40.77

High suitability

4

10–15

548.99

11.45

Moderate suitable

3

15–20

119.02

2.48

Very suitable

2

>20 - 43.70

50.23

1.05

Low suitable

1

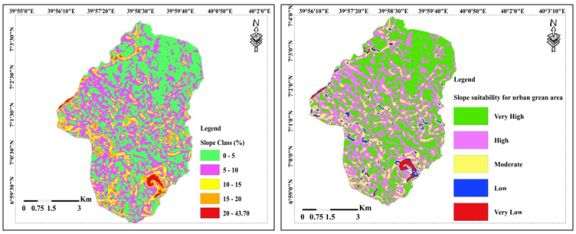
Figure 6. Proximity factor for slope and land suitability map of Goba town.
3.1.6. Proximity to Settlement
In this research, the proximity of the settlement area revealed that <500 m distances (very highly suitable), 500-1000 m (highly suitable), 1000-2000 m (moderately suitable), 2000-3000 (low suitable), and > 3000 m (very low suitable). The total area of the five class’s suitability analysis is very high suitable area and low suitable area coverage distance settlement (Figure 7 and Table 9). Green areas must be accessible to settlement areas in urban green areas since they have numerous ecological, social, and economic benefits . Therefore, the proximity between settlement areas and green areas harmed users, and green areas such as playgrounds, parks, and sports fields closest to settlement areas are the most popular.
Table 9. Reclassified proximity settlement of green area land suitability classes.

Settlement

Suitability class

Ranks

0-500

Very high suitable

5

500-1000

High suitable

4

1000-2000

Moderately suitable

3

2000-3000

Low

2

>3000

Very Low

1

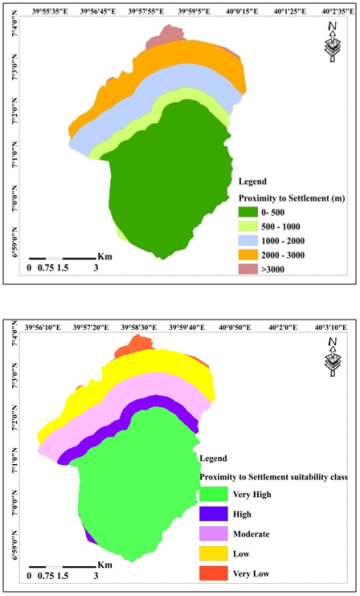
Figure 7. Land suitability analysis factor map for settlement.
3.2. Assigned Weights for Thematic Maps
The result of Analytical Hierarchical Process (AHP) shows that the derived factors have a different degree of influence on urban green spaces. These imply that the higher the weight in the percentage of a factor, the more influence it has in land suitable analysis for urban green spaces (Table 10).
Table 10. Pairwise comparison Matrix.

Criteria

Water source

Proximity to roads

Slope%

LULC

Proximity to settlement

Elevation

Water Sources

1

3

4

5

2

3

Proximity to roads

1/3

1

2

3

1

2

Slope%

¼

½

1

2

1

1

LULC

1/5

1/3

½

1

3

2

Proximity to settlement

½

1

1

1/3

1

2

Elevation

1/3

½

1

½

½

1

Columns total

2.6167

6.3333

9.5000

11.8333

8.5000

11.000

A consistency ratio of 0.1 or less is acceptable to continue the AHP analysis. But if it’s larger than 0.10, then there are inconsistencies in the evaluation process, and the AHP method may not yield a meaningful result. In this study, the consistency ratio or CR of conducted comparisons has obtained 0.09, which is smaller than 0.1, and therefore the comparisons can be acceptable. The computation of the consistency ratio is given in Table 11 below. Based on the result of this study, AHP is a highly efficient instrument for determining factor weights and is more beneficial than alternative approaches since the inconsistency of the factor weights’ pair-wise comparison matrix can be calculated and controlled by the Consistency Ratio (CR). This methods or approach was adopted by for urban green area suitability analysis.
Table 11. Consistence Weight normalized.

Criteria

Ws

PR

Sl

LULC

PS

El

WS

0.38

0.47

0.42

0.4

0.24

0.27

PR

0.13

0.16

0.21

0.25

0.12

0.18

SL

0.1

0.1

0.11

0.2

0.12

0.09

LULC

0.08

0.05

0.05

0.08

0.35

0.18

PS

0.19

0.15

0.11

0.03

0.12

0.18

El

0.12

0.07

0.1

0.04

0.05

0.1

SUM

=

1.00

1.00

1.00

1.00

1.00

Where, WS= Water source, PR= Proximity road, Sl= slope, LULC= land use land cover, PS= proximity settlement, El=elevation
Table 12. Analytical Hierarchical Process.

Criteria

AHP

CA

Lambda

CI

CI/RI

WS

0.368

0.9627

6.721092021

0.1442184

0.116305165

PR

0.175

1.10706

SL

0.110

1.04076

LULC

0.133

1.57968

PS

0.130

1.10766

El

0.084

0.92324

Where, WS= Water source, PR= Proximity road, Sl= slope, LULC= land use land cover, PS= proximity settlement, El= elevation
According to the urban green area suitability analysis, the green area suitability factors are proximity to water resources (36.8%) > proximity to the road (17.5%) > LULC (13.3%) > proximity settlement (13%) > slope (11%), and > elevation (8.4%) (Table 13). Therefore, current research results show that, in addition to natural resources, infrastructure also plays an important role in choosing suitable locations for urban green areas.
Table 13. Factor of land Suitability Analysis.

Criteria

Weight

Weight (%)

Water Sources

0.368

36.8%

Proximity to roads

0.175

17.5%

Slope%

0.110

11.%

LULC

0.133

13.3%

Proximity to settlement

0.130

13%

Elevation

0.084

8.4%

3.3. Urban Green Area Suitability Map
All criteria maps were overlaid to produce the final urban green area suitability map, as indicated by the results of weighting the criteria in terms of their relative importance and suitability for urban green areas. According to the results of a GIS-based multi-criteria analysis, the final suitability map included five classes namely: very low, low, moderate, high, and very high suitable categories.
The extent of area coverage urban green area suitability map class revealed that 877.92 ha (18.31%), 1506.46 ha (31.42%), 1280.76 ha (26.71%), 756.05 ha (15.77%), and 373.71 ha (7.79%) very low, low, moderate, high and very high; respectively. The reason for the low suitability (31.44%) might be due to poor or limited infrastructure in town whereas the high and very high suitable areas are because of high forest cover, proximity to roads, water source, and the likes (Table 14 and Figure 8).
Similar to this study, they examined key factors influencing urban green area suitability and used GIS-based multi-criteria analysis of green area suitability to optimize land use planning and decision support. It can be concluded that it is essential to perform an analysis .
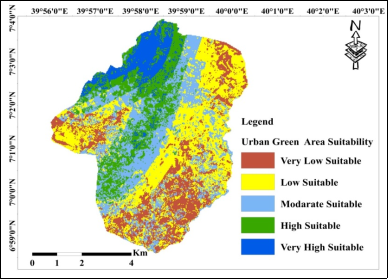
Figure 8. Map overlay urban Green area Land Suitability Analysis.
Table 14. Goba town urban green area suitability class and area coverage.

Urban Green Area Suitability Class

Area (ha)

Area (%)

Very low suitable

877.92

18.31

Low suitable

1506.46

31.42

Moderately suitable

1280.76

26.71

High suitable

756.05

15.77

Very high suitable

373.71

7.79

Overlay of the Excising Urban Green Area and Green Area Suitability Map
The overlay analysis of the suitability of existing urban green area points and the newly created urban green area map shows that the majority of the existing urban green area falls into the very low suitability class (35.28%), followed by low suitability (23.53%) and moderate (23.53%) whereas 17.65% belonged to the high urban green area suitability category, while no selections fell into the very high urban green suitability category (Figure 9). This means that it is very important to select appropriate locations for urban green area based on GIS and MCDA and incorporate them into structural planning.
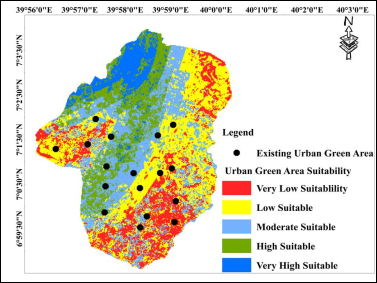
Figure 9. Overlay of the existing urban green area and green area suitability map.
4. Conclusion and Recommendations
In this study, using a GIS-based multi-criteria AHP approach for suitability maps of urban green areas is highly feasible. A total of six green area suitability determinants, viz., proximity to settlements, proximity to water sources, elevation, vegetation cover, slope, and proximity to roads, were used. The Goba town urban green area suitability map revealed that about 877.92 ha (18.32%), 1506.46 ha (31.44%), 1280.76 ha (26.73%), 756.05 ha (15.78%), and 370.62 ha (7.73%) were very low, low, moderate, high, and very high suitability classes, respectively.
It can be concluded that the Goba Town urban green area suitability map developed using GIS and MCDA can support baseline information in structural plans for decision-makers and further future study. Additionally, GIS and MCDA are effective and efficient in preparing factors to determine suitable urban green areas and develop an urban green area suitability map. To create ownership among the community and other stakeholders, different sectors should work on management and awareness creation. This research adopted six factors to make the urban green area suitability analysis and develop a suitability map so that, with relation to urban expansion in the future, further study with other ecological factors and impacts of urbanization on the farming community should be recommended.
Abbreviations

AHP

Analysis Hierarchy Process

GIS

Geographic Information System

MCDA

Multi-criteria Decision Analysis

Acknowledgments
First of all, I give all praise to the most caring, generous, and almighty God, who gives me health and makes all things possible for me. Secondly, I would like to express my deep gratitude to my advisor, Marsha Alem (PhD), for her advice, constructive comments, support, teaching, and encouragement in making this work successful. I would like to thank my family and my wife, Belaynash Fikru, for their invaluable and incredible support in this achievement. I am also very grateful for the support and encouragement of my colleagues at Madda Walabu University, especially the Department of GIS and Land Resource Management.
Conflicts of Interest
The authors declare no conflicts of interest.
References
[1] Abebe, M. T. and Megento, T. L., 2017. Urban green space development using GIS-based multi-criteria analysis in Addis Ababa metropolis. Applied Geomatics, 9, pp. 247-261.
[2] Aldababseh, A., Temimi, M., Maghelal, P., Branch, O. and Wulfmeyer, V., 2018. Multi-criteria evaluation of irrigated agriculture suitability to achieve food security in an arid environment. Sustainability, 10(3), p. 803.
[3] Creswell, J. W. and Tashakkori, A., 2007. Differing perspectives on mixed methods research. Journal of mixed methods research, 1(4), pp. 303-308.
[4] Dağıstanlı, C., Turan, İ. D. and Dengiz, O., 2018. Evaluation of the suitability of sites for outdoor recreation using a multi-criteria assessment model. Arabian Journal of Geosciences, 11, pp. 1-14.
[5] Eshetu, S. B., Yeshitela, K. and Sieber, S., 2021. Urban Green Space Planning, Policy Implementation, and Challenges: The Case of Addis Ababa. Sustainability 2021, 13, 11344.
[6] Ferguson, M., Roberts, H. E., McEachan, R. R. and Dallimer, M., 2018. Contrasting distributions of urban green infrastructure across social and ethno-racial groups. Landscape and Urban Planning, 175, pp. 136-148.
[7] Girma, Y., Terefe, H., Pauleit, S. and Kindu, M., 2019. Urban green spaces supply in rapidly urbanizing countries: The case of Sebeta Town, Ethiopia. Remote Sensing Applications: Society and Environment, 13, pp. 138-149.
[8] Gondo, T., 2012. Spatial planning and open space integration in urban Ethiopia: A sustainable accessibility exegesis. na.
[9] Hailemariam, B. A., 2021. Suitable site selection for urban green space development using geographic information system and remote sensing based on multi criterion analysis. International Journal of Human Capital in urban management, 6(1).
[10] Hersperger, A. M., Gennaio, M. P., Verburg, P. H. and Bürgi, M., 2010. Linking land change with driving forces and actors: four conceptual models. Ecology and Society, 15(4).
[11] James, G. D. and Liebeck, M. W., 2001. Representations and characters of groups. Cambridge university press.
[12] Jiang, H. and Eastman, J. R., 2000. Application of fuzzy measures in multi-criteria evaluation in GIS. International Journal of Geographical Information Science, 14(2), pp. 173-184.
[13] Kuldeep and Garg, P. K., 2014. The role of texture information and data fusion in topographic objects extraction from satellite data. Geodesy and Cartography, 40(3), pp. 116-121.
[14] Li, K., Li, C., Liu, M., Hu, Y., Wang, H. and Wu, W., 2021. Multiscale analysis of the effects of urban green infrastructure landscape patterns on PM2. 5 concentrations in an area of rapid urbanization. Journal of Cleaner Production, 325, p. 129324.
[15] Malczewski, J., 2006. Integrating multicriteria analysis and geographic information systems: the ordered weighted averaging (OWA) approach. International Journal of Environmental Technology and Management, 6(1-2), pp. 7-19.
[16] Malmir, M., Zarkesh, M. M. K., Monavari, S. M., Jozi, S. A. and Sharifi, E., 2016. Analysis of land suitability for urban development in Ahwaz County in southwestern Iran using fuzzy logic and analytic network process (ANP). Environmental monitoring and assessment, 188, pp.1-23.
[17] Mardy, T., Uddin, M. N., Sarker, M. A., Roy, D. and Dunn, E. S., 2018. Assessing coping strategies in response to drought: A micro level study in the north-west region of Bangladesh. Climate, 6(2), p. 23.
[18] Morckel, V., 2017. Using suitability analysis to select and prioritize naturalization efforts in legacy cities: An example from Flint, Michigan. Urban Forestry & Urban Greening, 27, pp. 343-351.
[19] Ramaiah, M. and Avtar, R., 2019. Urban green spaces and their need in cities of rapidly urbanizing India: A review. Urban science, 3(3), p. 94.
[20] Ustaoglu, E. and Aydınoglu, A. C., 2020. Site suitability analysis for green space development of Pendik district (Turkey). Urban Forestry & Urban Greening, 47, p. 126542.
[21] World Health Organization ((WHO). 2017. Urban green space interventions and health: A review of impacts and effectiveness.
[22] Yousif, T. A., Mohamed, A. A. and Ibrahim, E. M., 2014. Land use/land cover change detection due to urbanization case study: southern part of Khartoum. Jour. of Nat. Resour. & Environ. Stu, 3, pp. 1-8.
[23] Saaty T. 1980. The analytic hierarchy process: Planning, priority setting, resource allocation. McGraw-Hill, New York.
[24] Saaty, T. L., 1991. Some mathematical concepts of the analytic hierarchy process. Behaviormetrika, 18(29), pp. 1-9.
Cite This Article
  • APA Style

    Hordofa, T., Alemu, M., Eshetu, M. (2024). Land Suitability Analysis and Mapping Using Geospatial Technique and Multi Criteria Decision Analysis for Urban Green Area of Goba Town, Oromia, Ethiopia. Landscape Architecture and Regional Planning, 9(2), 25-37. https://doi.org/10.11648/j.larp.20240902.11

    Copy | Download

    ACS Style

    Hordofa, T.; Alemu, M.; Eshetu, M. Land Suitability Analysis and Mapping Using Geospatial Technique and Multi Criteria Decision Analysis for Urban Green Area of Goba Town, Oromia, Ethiopia. Landsc. Archit. Reg. Plan. 2024, 9(2), 25-37. doi: 10.11648/j.larp.20240902.11

    Copy | Download

    AMA Style

    Hordofa T, Alemu M, Eshetu M. Land Suitability Analysis and Mapping Using Geospatial Technique and Multi Criteria Decision Analysis for Urban Green Area of Goba Town, Oromia, Ethiopia. Landsc Archit Reg Plan. 2024;9(2):25-37. doi: 10.11648/j.larp.20240902.11

    Copy | Download

  • @article{10.11648/j.larp.20240902.11,
      author = {Tilahun Hordofa and Mersha Alemu and Mulugeta Eshetu},
      title = {Land Suitability Analysis and Mapping Using Geospatial Technique and Multi Criteria Decision Analysis for Urban Green Area of Goba Town, Oromia, Ethiopia
    },
      journal = {Landscape Architecture and Regional Planning},
      volume = {9},
      number = {2},
      pages = {25-37},
      doi = {10.11648/j.larp.20240902.11},
      url = {https://doi.org/10.11648/j.larp.20240902.11},
      eprint = {https://article.sciencepublishinggroup.com/pdf/10.11648.j.larp.20240902.11},
      abstract = {Urban green areas have a significant role in improving human well-being in a variety of ways, providing ecosystem services, optimizing the health of urban residents, and making a great contribution to environmental health. However, there are very limited studies or not yet conducted on urban green area suitability analysis using geospatial technique and MCDA that support decision-makers, urban green area planners, and managements. The objective of this study is to analyze the factors that determine land suitability for urban green areas and to develop an urban green area suitability map for Goba Town using geospatial technique and the MCDA-AHP approach. In this study, GIS-based multi-criteria analysis (MCA) has been adopted to select suitable sites for urban green areas. The methodology involves a structured framework to identify and prioritize areas suitable for urban green development based on six key determinant factors: viz., land use land cover (LULC), elevation, proximity to settlements, distance to main rivers, slope, and distance to roads. The generated suitability map was validated by comparing it to existing green areas and conducting field surveys to verify the model's accuracy. The results of the study revealed that about 877.92 ha (18.31%), 1506.46 ha (31.41%), 1280.76 ha (26.71%), 756.05 ha (15.76%), and 373.71 ha (7.79%) were very low, low, moderate, high, and very high, respectively. The finding of the current study supports, as a baseline, assisting local governments and environmental agencies in sustainable urban development and forming resilient cities in advance of environmentally dynamic dynamics. Inclusion GIS and MCDA-based land suitability analysis provides a comprehensive framework for urban green area planning. Future studies might recommend using ecosystem service valuation as a factor in determining land suitability for green areas. Furthermore, various stakeholders need to work on the management of urban green areas and the community's awareness creation on urban green area ownership. 
    },
     year = {2024}
    }
    

    Copy | Download

  • TY  - JOUR
    T1  - Land Suitability Analysis and Mapping Using Geospatial Technique and Multi Criteria Decision Analysis for Urban Green Area of Goba Town, Oromia, Ethiopia
    
    AU  - Tilahun Hordofa
    AU  - Mersha Alemu
    AU  - Mulugeta Eshetu
    Y1  - 2024/09/23
    PY  - 2024
    N1  - https://doi.org/10.11648/j.larp.20240902.11
    DO  - 10.11648/j.larp.20240902.11
    T2  - Landscape Architecture and Regional Planning
    JF  - Landscape Architecture and Regional Planning
    JO  - Landscape Architecture and Regional Planning
    SP  - 25
    EP  - 37
    PB  - Science Publishing Group
    SN  - 2637-4374
    UR  - https://doi.org/10.11648/j.larp.20240902.11
    AB  - Urban green areas have a significant role in improving human well-being in a variety of ways, providing ecosystem services, optimizing the health of urban residents, and making a great contribution to environmental health. However, there are very limited studies or not yet conducted on urban green area suitability analysis using geospatial technique and MCDA that support decision-makers, urban green area planners, and managements. The objective of this study is to analyze the factors that determine land suitability for urban green areas and to develop an urban green area suitability map for Goba Town using geospatial technique and the MCDA-AHP approach. In this study, GIS-based multi-criteria analysis (MCA) has been adopted to select suitable sites for urban green areas. The methodology involves a structured framework to identify and prioritize areas suitable for urban green development based on six key determinant factors: viz., land use land cover (LULC), elevation, proximity to settlements, distance to main rivers, slope, and distance to roads. The generated suitability map was validated by comparing it to existing green areas and conducting field surveys to verify the model's accuracy. The results of the study revealed that about 877.92 ha (18.31%), 1506.46 ha (31.41%), 1280.76 ha (26.71%), 756.05 ha (15.76%), and 373.71 ha (7.79%) were very low, low, moderate, high, and very high, respectively. The finding of the current study supports, as a baseline, assisting local governments and environmental agencies in sustainable urban development and forming resilient cities in advance of environmentally dynamic dynamics. Inclusion GIS and MCDA-based land suitability analysis provides a comprehensive framework for urban green area planning. Future studies might recommend using ecosystem service valuation as a factor in determining land suitability for green areas. Furthermore, various stakeholders need to work on the management of urban green areas and the community's awareness creation on urban green area ownership. 
    
    VL  - 9
    IS  - 2
    ER  - 

    Copy | Download

Author Information
  • Goba Town Land Administration Office, Goba, Ethiopia

  • Department of GIS and Land Resource Management, Madda Walabu University, Robe, Ethiopia

  • Sinana Agriculture Research Center, Sinana, Ethiopia

  • Abstract
  • Keywords
  • Document Sections

    1. 1. Introduction
    2. 2. Methods and Materials
    3. 3. Results and Discussions
    4. 4. Conclusion and Recommendations
    Show Full Outline
  • Abbreviations
  • Acknowledgments
  • Conflicts of Interest
  • References
  • Cite This Article
  • Author Information