Abstract
Pipeline leak monitoring is an important industrial safety measure designed to ensure the safety of liquids or gases during transportation. Distributed acoustic sensing (DAS) technology is based on the reverse Rayleigh scattering inside the fiber to reflect the change of the measured physical quantity, and has great advantages in monitoring range, environmental adaptability, transmission loss control and system stability. In this paper, the pipeline leakage monitoring technology based on distributed acoustic sensing fiber is used to study the leakage signal of small leak aperture. In order to improve the sensitivity of leakage monitoring, the optical fiber is spiral wound on the pipe section. The identification method of pipeline leakage signal based on fast Fourier transform is proposed. By analyzing the vibration of the optical fiber in the time domain and the frequency domain, the leakage signal can be accurately monitored. Pipeline leakage tests with different leak apertures were carried out, and the leakage locations were studied by energy attenuation and cross-correlation techniques. The experimental results show that the time-domain signal fluctuates obviously and the full-band energy of the frequency-domain signal increases after pipeline leakage. The increase of leakage diameter will gradually increase the signal energy, and the leakage energy will gradually move from high frequency to low frequency. The energy attenuation positioning technique can locate the leakage within the range of a single sensing unit, and determine the leakage location through cross-correlation analysis with an error of less than 3 m.
Keywords
Distributed Acoustic Sensing (DAS), Pipeline Leakage, Time Domain, Frequency Domain, Leakage Location
1. Introduction
Pipeline is an important part of the world's material and energy supply infrastructure, in the five modes of transport, pipeline transport compared with other modes of transport, has significant characteristics and advantages. The pipeline may encounter corrosion, aging, man-made damage and other problems in the transportation process, resulting in pipeline leakage. Due to the long length of pipelines and the fact that they are often placed in places with fewer personnel, the occurrence of leakage accidents is hidden and difficult to detect, which brings many challenges to the early warning of pipeline leakage
| [1] | Adegboye M, Fung W, Karnik A. Recent advances in pipeline monitoring and oil leakage detection technologies: Principles and approaches. Sensors. 2019, 19(11), 2548. https://doi.org/10.3390/s19112548 |
[1]
. With the increase of pipeline length, many shortcomings of traditional monitoring methods are gradually exposed. These problems include relatively simple monitoring parameters, high cost, small detection range and poor accuracy.
In recent years, pipeline leakage incidents occur frequently. The occurrence of these leaks can lead to a series of consequences, resulting in a waste of resources, property damage, and a threat to personal safety. Due to the different characteristics of transportation pipelines with different media, the leakage monitoring methods of pipelines are also different. In order to meet the monitoring requirements of different types of pipelines and ensure the safe transportation of pipelines, a lot of research has been carried out. There are many different techniques available for pipeline leak detection. They can be broadly divided into two categories: internal and external monitoring methods, sometimes referred to as software or hardware based leak monitoring methods, respectively
. Internal systems utilize different calculation methods to infer the occurrence of leaks from internal pipe parameters such as product pressure, temperature, density, or flow. Typically inexpensive and easy to implement, these types of systems can detect possible leaks when measurements deviate from normal parameters, which is the most common way to quickly and reliably identify major leaks from remote locations. External systems rely on the use of additional sensors along the pipe to detect external manifestations of possible leakage, such as acoustic signals, temperature changes, or the presence of chemical leaks
| [3] | Sekhavati J, Hashemabadi S, Soroush M. Computational methods for pipeline leakage detection and localization: A review and comparative study. Journal of Loss Prevention in the Process Industries. 2022, 77, 104771. https://doi.org/10.1016/j.jlp.2022.104771 |
[3]
. External systems typically have higher hardware and installation costs, but may provide more reliable, faster detection and high positioning accuracy, even for smaller leaks.
Distributed acoustic sensing fiber (DAS) monitoring technology offers the possibility of continuous acoustic monitoring of pipelines and remote detection of leaks. DAS system based on Φ-OTDR technology is a kind of sensing technology to realize continuous distributed detection of sound signal by using the interference effect of optical fiber reverse Rayleigh scattering
| [4] | Li Y, Wang Y, Xiao L, Bai Q, Liu X, Gao Y, et al. Phase demodulation methods for optical fiber vibration sensing system: A review. IEEE Sensors Journal. 2021, 22(3), 1842-66. https://doi.org/10.1109/JSEN.2021.3135909 |
[4]
. The low loss characteristics of optical fibers give DAS systems a huge detection advantage, and the length of the sensing fiber can be easily extended to tens of kilometers, so that the detection range of DAS systems is extremely wide. The vibration detection bandwidth of DAS is up to 50 kHz, which allows it to capture subtle changes in the event under test, even if the event is far away from the fiber, which extends the detection capability of DAS technology
| [5] | Rahman M, Taheri H, Dababneh F, Karganroudi S, Arhamnamazi S. A review of distributed acoustic sensing applications for railroad condition monitoring. Mechanical Systems and Signal Processing. 2024, 208, 110983. https://doi.org/10.1016/j.ymssp.2023.110983 |
[5]
. The principle of distributed acoustic sensing fiber is mainly based on the transmission and detection of acoustic signals in the fiber. Its core is to use optical fiber as a sensing element to detect acoustic signals by measuring the changes of optical signals transmitted in optical fibers when they are disturbed by acoustic waves
| [6] | Shang Y, Sun M, Wang C, Yang J, Du Y, Yi J, et al. Research progress in distributed acoustic sensing techniques. Sensors. 2022, 22(16), 6060. https://doi.org/10.3390/s22166060 |
[6]
. Specifically, when a sound wave acts on an optical fiber, the optical signal in the optical fiber will be modulated, including changes in the phase, frequency, intensity and other parameters of the light wave, which are closely related to the characteristics of the sound wave (such as amplitude, frequency and propagation direction). By measuring and analyzing the changes in these optical signal parameters, the detection and positioning of the acoustic signal can be realized
.
Muggleton et al. used the DAS system to monitor the leakage of buried natural gas pipelines
| [8] | Muggleton J, Hunt R, Rustighi E, Lees G, Pearce A. Gas pipeline leak noise measurements using optical fibre distributed acoustic sensing. Journal of Natural Gas Science and Engineering. 2020, 78, 103293. https://doi.org/10.1016/j.jngse.2020.103293 |
[8]
. Stajanca et al. used DAS system based on Rayleigh scattering to monitor gas pipeline leakage
| [9] | Stajanca P, Chruscicki S, Homann T, Seifert S, Schmidt D, Habib A. Detection of leak-induced pipeline vibrations using fiber—Optic distributed acoustic sensing. Sensors. 2018, 18(9), 2841. https://doi.org/10.3390/s18092841 |
[9]
. Hussels et al. investigated different methods of applying DAS fiber to pipelines, using artificial signals to optimize measurement parameters
| [10] | Hussels M, Chruscicki S, Habib A, Krebber K. Distributed acoustic fibre optic sensors for condition monitoring of pipelines. Conference Distributed acoustic fibre optic sensors for condition monitoring of pipelines, Limerick vol. 9916. SPIE, p. 419-22. https://doi.org/10.1117/12.2236809 |
[10]
. However, despite the many advantages of DAS technology, the signal to noise ratio of the leakage signal is low, it is difficult to distinguish the leakage, the ability to monitor the leakage with small leak aperture is poor.
In this paper, the experimental signal is processed by FFT and other methods, and the time-domain waveform and spectrum of each frequency band under different leakage apertures are obtained. The characteristics of leakage signal under different leakage apertures are analyzed. To solve the problem that there are few leak location methods of distributed acoustic sensing fiber, this paper uses two leak location methods to conduct experiments, through which the leak location can be determined within 3 m.
2. Pipeline Leakage Location Methods
2.1. Attenuation of Acoustic Waves
When the acoustic signal propagates along the pipeline, the signal will gradually decay with the increase of the propagation distance. This is because the acoustic signal will be affected by a variety of factors during the propagation process, resulting in the loss of energy. First, the acoustic signal will encounter the reflection and scattering of the pipe wall during the propagation process, which will cause part of the energy to be dispersed and lost. Secondly, there may be other media or obstacles inside the pipeline, which will absorb and scatter the acoustic signal, further reducing the energy of the signal
| [11] | Zhang J, Lian Z, Zhou Z, Xiong M, Lian M, Zheng J. Acoustic method of high-pressure natural gas pipelines leakage detection: Numerical and applications. International Journal of Pressure Vessels and Piping. 2021, 194, 104540. https://doi.org/10.1016/j.ijpvp.2021.104540 |
[11]
. In addition, the structure and material characteristics of the pipeline will also have an impact on the propagation of the acoustic signal, which may lead to the attenuation of the signal
| [12] | Liu C, Li Y, Yan Y, Fu J, Zhang Y. A new leak location method based on leakage acoustic waves for oil and gas pipelines. Journal of Loss Prevention in the Process Industries. 2015, 35, 236-46. https://doi.org/10.1016/j.jlp.2015.05.006 |
[12]
. The attenuation relation of acoustic wave is shown as follows:
is the amplitude of different detection points; is the amplitude of the leak source; is the attenuation coefficient; is the distance between the monitoring point and the leak point.
Using the attenuation characteristic of signal amplitude in the propagation process, the signal amplitude changes in different regions are monitored by the optical fiber arranged on the pipeline. The closer the sensor is to the leak point, the larger the amplitude of the signal measured, and the smaller the amplitude measured by the sensor away from the leak point. Through this rule, we can find the sensor unit with the largest leakage signal amplitude, and analyze the signal amplitude changes of both sensor units to ensure accurate positioning. At the same time, the leakage point of the pipeline can be determined by determining the location of the pipeline where the sensor unit is located. When using traditional sensors for monitoring, more detailed measurement and data analysis are needed to improve the accuracy of leakage source location. This often means that more sensors need to be placed on the pipeline to capture more detail about the changes in the amplitude of the leakage signal. The leak source can be more accurately located by increasing the number of sensors. Therefore, the use of distributed optical fiber can effectively save costs compared to traditional sensors, and has a larger monitoring range
| [13] | Bao X, Wang Y. Recent advancements in Rayleigh scattering-based distributed fiber sensors. Advanced devices & instrumentation. 2021, 2021, 8696571. https://doi.org/10.34133/2021/8696571 |
[13]
.
2.2. Cross-correlation Method
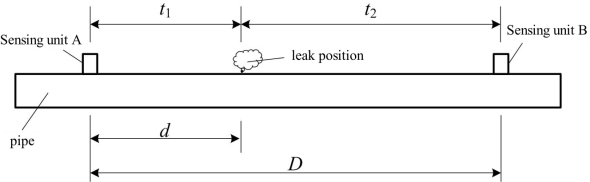
Sensing units A and B of the optical fiber are determined at two detection points A and B. After leakage occurs, acoustic emission waves will be transmitted along the tube wall to the two sensing units, as shown in
Figure 1. The distance
from the leakage point to sensing unit A is as follows:
is the distance between sensor units A and B. is the propagation speed and is the time difference.
Figure 1. The principle of cross-correlation localization.
The cross-correlation function in time between any acoustic signal and an acoustic signal with a delay time of is:
(3)
Discrete form is
(4)
is the number of relevant points.
Signal correlation is actually a measure of how similar two signal waveforms are
| [14] | Nicola M, Nicola C, Vintilă A, Hurezeanu I, Duță M. Pipeline leakage detection by means of acoustic emission technique using cross-correlation function. J Mech Eng Auto. 2018, 8, 59-67. https://doi.org/10.5923/j.jmea.20180802.03 |
[14]
. After the leakage occurs, the vibration generated by the leakage will propagate along the closure, and the signal will first propagate to a point close to the leakage hole and reach another point after a period of time. If the waveform propagation of the signal is relatively stable, it can be considered that the signal transmitted at the two points is similar in waveform. However, this similarity is not entirely consistent, because the signal at point B lags in time relative to the signal at point A. Therefore, by comparing the similarity of the signal at point A and point B, we can analyze the propagation characteristics of the signal and infer the location and characteristics of the leak source accordingly.
3. Experimental System and Optical Fiber Layout Methods
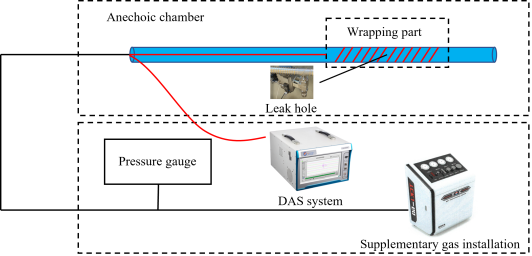
In this study, the feasibility of monitoring small-diameter leakage of pipelines with DAS fiber laid on the surface of pipelines was discussed. The pipeline is located in the facility building, and the total length of the pipeline system is 210 m; The inner diameter of the pipeline is 44 mm, the wall thickness is 3 mm; The material is 316L stainless steel, the minimum curvature radius: 400 mm; Pressure: 12 MPa; Medium flow rate: 0-5 m/s; The entire pipeline system is 14.6 m long and 6.5 m wide and is placed on a steel platform bracket with a height of 0.35 m.
In the pipeline leakage test, all leakage starts and ends are simulated by manipulating the opening and closing of the pneumatic valve, using the perforated adapter inserted into the pneumatic valve as the leakage hole of the pipeline leak. Pipeline corrosion is the main cause of pipeline leakage, second only to external interference, and almost all corrosion failures are pinhole. Therefore, this experiment mainly studies small-caliber leakage. In order to ensure the smoothness of the test fluid flow, the large-arc pipeline curve is specially designed to avoid the movement fluctuation caused by the sudden flow of high-speed fluid to turn, and the impact vibration of the pipeline. The combination of the gradual taper intermediate joint and the special pipe clamp can ensure the smooth flow of internal fluid, and reduce the noise signal caused by fluid flow and other factors to interfere with the leakage signal.
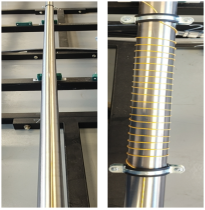
Standard single-mode optical fiber was used in this study. For the laying of optical fiber, two arrangements were used in the experiment. As shown in
Figure 3, the first arrangement was to directly straighten the optical fiber and tightly fit it on the pipeline, fix the optical fiber with pipe clamp, and then use tape to further strengthen the optical fiber, so as to make the optical fiber more sensitive to the pipeline vibration signal. The second method is to tighten and spiral the optical fiber around the main body of the pipe section, and then the tape is also reinforced, and the optical fiber is wrapped on the pipe each circle spacing is relatively small, about 2 cm. Compared with a simple linear arrangement, spiral winding increases the fiber coverage of the pipe, which helps to improve the measurement sensitivity and spatial resolution of potentially weak signals
| [15] | Fu S, Zhang D, Peng Y, Shi B, Yedili N, Ma Z. A simulation of gas pipeline leakage monitoring based on distributed acoustic sensing. Measurement Science and Technology. 2022, 33(9), 095108. https://doi.org/10.1088/1361-6501/ac7633 |
[15]
. Taking into account the outer diameter of the pipe and the application distance of the fiber, the length of each wrapping part is set to 3 m, and 1 m of fiber is also used for winding at both ends of a pipe section near the flange.
Figure 2. Schematic diagram of the experimental pipeline system.
Figure 3. Optical fiber layout method.
The flange position of the pipe cannot be continuously laid fiber, so there is always a short free hanging fiber segment between the pipe segments, and these free hanging fiber sections are prone to record false signals. DAS systems are essentially measuring vibration signals, integrated on fiber lengths proportional to the length of the inquiry pulse used, so using a longer DAS system resolution can lead to false signals affecting the fiber applied on the pipe from the freely hanging portion of the fiber. The wrapping part helps to isolate the rest of the fiber applied to the pipe from the potential signal coming from the free hanging fiber section. This arrangement allows the experiment to evaluate data only from the fiber section applied to the relevant pipe area, while the signal collected from the fiber near the flange is omitted.
4. Experimental Study of Pipeline Leakage
4.1. Leakage Signals Characteristics
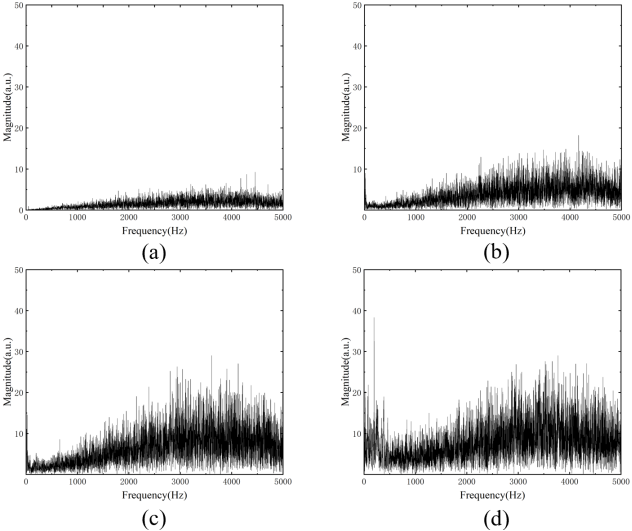
Experiments were carried out on the early leakage conditions of gas pipelines with leakage calibers of 0.5, 1 and 1.5 mm. The pipeline pressure was controlled to be 2 MPa, and the leakage occurred at 5 s. Since the leakage occurred signals were concentrated within 1 s, 10,000 signal points within 5 s to 6 s were selected as data points. After FFT calculation of the time-domain signal, the pipeline leakage signal spectrum with no leakage and 0.5, 1 and 1.5 mm is obtained. As shown in
Figure 5, when the signal does not leak, the signal energy value is significantly smaller than the energy value when the leakage occurs. In the unleaked signal spectrum, there is almost no low-frequency signal, and only some noise signals appear in the high-frequency signal. After leakage, the energy of the leakage signal increases significantly compared with that of the non-leakage state, and the energy of the low-frequency band increases significantly. Continuous excitation peaks appear in the high frequency band. In the actual pipeline monitoring, the leakage can be tested and the signal energy generated by the leakage can be evaluated, and the leakage can be monitored by setting the energy threshold.
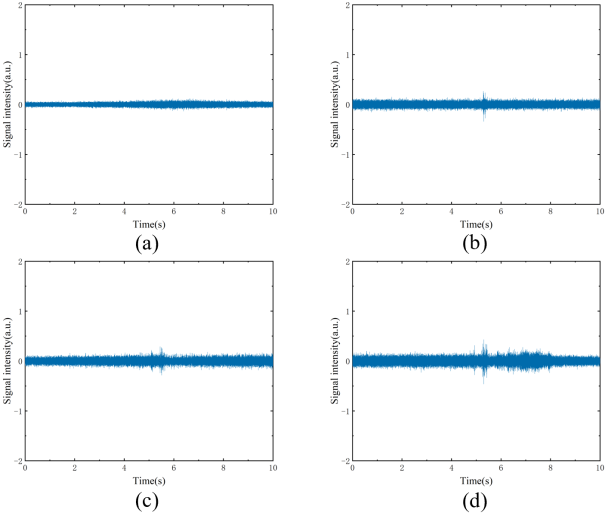
The pipeline leakage signal has the characteristics of continuous distribution in the time domain, and with the increase of the leakage diameter, the maximum signal strength increases from 0.2 to 0.4. In addition to the increase of vibration amplitude, the signal fluctuation degree also increases significantly. The signal of the 0.5mm aperture leakage hole is not obvious during the continuous leakage period, and it only fluctuates significantly when the leakage occurs. After leakage occurs, the energy values of different frequency bands increase significantly. When the leakage diameter of 0.5mm occurs, there is an obvious energy amplitude in the frequency band of 0-50 Hz; when the leakage diameter is 1.5mm, the characteristic frequency band of the low frequency band is widened from 0-300 Hz and an excitation peak with high energy appears near 200 Hz. In the 2000-5000 Hz frequency band, a wide high-amplitude frequency band is formed and multiple peaks appear.
Figure 4. Time domain of wrapping part in different areas (a) No leakage (b) 0.5 mm leakage hole (c) 1 mm leakage hole (d) 1.5 mm leakage hole.
In the frequency domain, with the increase of leakage aperture, the low-frequency energy increases gradually and the frequency range expands. The positions of the peaks stimulated by leakage are not consistent, which makes it difficult to distinguish the vibration signals under different leakage diameters directly from the positions of the energy peaks. The characteristic frequency band is used to observe the signal characteristics. When the leakage diameter is the smallest, the characteristic frequency band is mainly concentrated in the range of 0-50 Hz. When the leakage aperture reaches the maximum, this band expands significantly to 0-300 Hz, and the characteristic band width difference between the maximum and minimum leakage hole is 6 times.
Figure 5. Frequency domain of Wrapping part in different areas (a) No leakage (b) 0.5 mm leakage hole (c) 1 mm leakage hole (d) 1.5 mm leakage hole.
4.2. Leakage Signals in Different Pipeline Areas
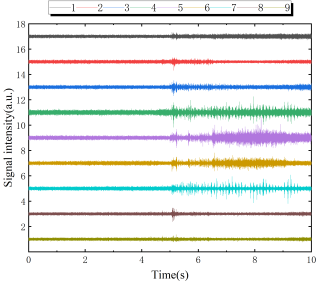
Figure 6 shows the time domain signals of different regions with a pressure of 2 MPa and a leakage hole of 1 mm. Nine wrapping part signals were selected in the experiment, among which wrapping part No. 5 was arranged near the leakage hole. The leakage occurs at fifth second, with the emergence of leakage, the signal amplitude increases significantly, and the sensor near the leakage hole can observe obvious signal vibration amplitude changes. In the absence of leakage, the vibration amplitude of the interference signal caused by external noise and medium flow in the pipeline fluctuates around 0.2, and the signal fluctuates significantly when leakage occurs. After the continuous leakage phase, intermittent high-frequency signals appear.
In order to further determine the location of pipeline leakage points, the cumulative calculation of time-domain signals may lead to data leakage due to the low sampling rate of DAS system, and the method of judging leakage points solely using the maximum value has a high error rate. In order to improve the accuracy of leakage location, the average value of signals whose signal strength exceeds 0.2 within a certain period of time after leakage is calculated. Can reduce the occurrence of errors.
Figure 6. Time domain of wrapping part in different areas.
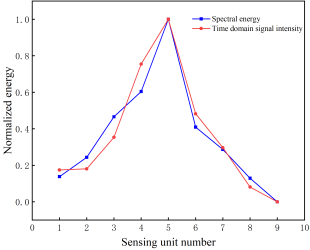
The frequency spectrum of 9 wrapping part can be obtained after the time domain signal is processed by the fast Fourier transform algorithm. The leakage location algorithm of cumulative average in the frequency domain is used to average the DAS signal in the frequency domain to obtain the leakage energy. The results obtained by the two methods are normalized. Among them, the normalization adopts the mapping method to map the energy intensity into the interval [0,1], and the mapping method is as follows:
(5)
Where
is the calculated data,
is the maximum value,
is the minimum value, and
is the result obtained by normalization of the data. The calculation results are shown in
Figure 7.
Figure 7. Normalized energy attenuation of wrapping part in different areas.
Through calculation, the maximum value of the normalized energy of the two methods appears in wrapping part No. 5, which is consistent with the actual leakage position of the pipeline. The energy attenuation amplitude of the two calculation methods in the time domain and the frequency domain is basically the same. It can be seen from the figure that the energy attenuation amplitude at the back of wrapping part No. 5 is greater than that at the front, which may be due to the fact that the pipe behind wrapping part No. 5 becomes bent and the energy attenuation is large. This shows that the DAS system can locate the leakage point of the pipeline through the principle of energy attenuation, and the leakage location algorithm based on the cumulative average in the frequency domain is helpful to improve the location accuracy.
4.3. Cross-correlation Analysis
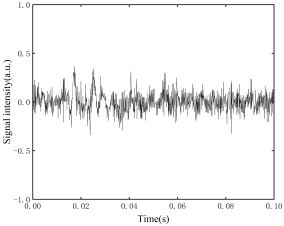
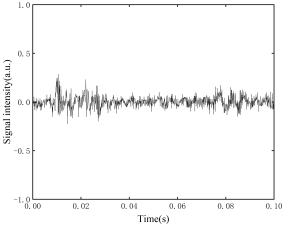
The monitoring signals of one sensor unit on each side of the leakage hole are taken, and A section of 1000 point signal data is selected for each side. The time-domain signals are shown in
Figures 8 and 9, in which sensing unit B is farther from the leakage hole than sensing unit A.
Figure 8. Time domain signal waveform of sensing unit A.
Figure 9. Time domain signal waveform of sensing unit B.
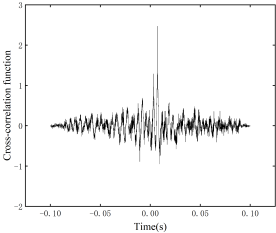
The cross-correlation function of the time domain signals of the two sensing units is calculated according to formula (
4). The correlation function after cross-correlation calculation is shown in
Figure 10: it can be seen that the time of signal transmission to sensor unit A is 0.0068 s earlier than the time of arrival to B. The velocity of sound waves in the stainless steel tube is about v=5200 m/s. By substituting them into equation (
2), it can be calculated that the distance of sensor unit A from the leakage position is 4.82m. The actual position of sensor unit A is 6-7 m away from the leakage point, and the error is less than 3m.
Figure 10. Cross-correlation leakage localization results.
The cross-correlation algorithm is mostly used for point sensors. Since the position of the sensor unit of the optical fiber is affected by the resolution setting of the DAS system, the judgment accuracy of the leak location is low. However, due to the long-distance characteristics of the distributed optical fiber, a large number of sensor units can be collected, a large number of data can be analyzed, and the leakage positioning error can be controlled within 10m. It has certain practical significance in the leakage location of industrial transport pipeline.
5. Results and Discussion
This paper presents a real-time monitoring method for pipelines based on DAS system. Through the pipeline leakage experiment, the feasibility of monitoring pipeline leakage based on DAS technology is discussed. Considering the size of the leak hole, the difference of DAS collected signals is analyzed, and the leak location technology is studied. The experimental results show that:
After pipeline leakage occurs, time domain signal fluctuates obviously, and frequency domain signal energy increases. The low-frequency signal appeared when the leakage occurred, and then the signal gradually attenuated. The energy of the signal in the frequency domain increases significantly in the whole frequency band. For the leakage monitoring, the leakage can be judged by analyzing the energy mutation.
The increase of leakage aperture will gradually increase the signal energy, and the proportion of low-frequency signal energy in the frequency band will increase, and the leakage energy will gradually move from the high frequency band to the low frequency band. At this time, the proportion of low-frequency signal energy will become the key factor in judging the leakage aperture. This analysis is only applicable to the identification of small diameter leakage.
In terms of leakage location, we introduce the location technology based on attenuation of acoustic waves and cross-correlation analysis. The locating method based on attenuation of acoustic waves is to infer the leakage location by measuring the energy attenuation when the leakage signal propagates in the pipeline. The cross-correlation analysis between the leakage signal and different sensors is used to determine the location of the leakage point. These two methods have advantages and disadvantages, and need to be selected and applied according to the actual situation of pipeline layout and optical fiber layout.
6. Conclusion
In view of the existing DAS system for pipeline leakage monitoring of small aperture, this paper studies the pipeline leakage monitoring method based on DAS system, and verifies its feasibility through theoretical and application research, which provides technical support for DAS system in real time monitoring of pipeline leakage and accurate location of leakage points in practical projects.
In practice, the shape of the leak hole is often irregular, which can lead to different and specific signals. In addition, the signals generated by background noise such as traffic, construction, and wind are more complex, which may make it difficult to identify and locate leaks. By simulating multiple leakage points in complex scenarios, we will further explore the performance of DAS technology under different leakage modes in the future, providing more comprehensive and reliable guidance for practical engineering applications.
Abbreviations
DAS | Distributed Acoustic Sensing |
DTS | Distributed Temperature Sensing |
FFT | Fast Fourier Transform |
Φ-OTDR | Phase-sensitive Optical Time-Domain Reflectometer |
Acknowledgments
The authors thank to recent publications on this topic from researchers.
Author Contributions
Shuai Wang: Writing – original draft, Data curation
Dianqiang Xu: Software
Guanbin Liu: Conceptualization
Tian Xue: Methodology
Yu Liu: Resources
Funding
This work is supported by the National Key Research and Development Program of China (Grant 2023YFB4104203), the National Natural Science Foundation of China (Grant U23B2090) and the Liaoning Provincial Science and Technology Plan Project (Science and Technology Research Special Project, Grant 2023JH1/ 10400003).
Data Availability Statement
The data supporting the outcome of this research work has been reported in this manuscript.
Conflicts of Interest
The authors declare no conflicts of interest.
References
| [1] |
Adegboye M, Fung W, Karnik A. Recent advances in pipeline monitoring and oil leakage detection technologies: Principles and approaches. Sensors. 2019, 19(11), 2548.
https://doi.org/10.3390/s19112548
|
| [2] |
Zaman D, Tiwari M, Gupta A, Sen D. A review of leakage detection strategies for pressurised pipeline in steady-state. Engineering Failure Analysis. 2020, 109, 104264.
https://doi.org/10.1016/j.engfailanal.2019.104264
|
| [3] |
Sekhavati J, Hashemabadi S, Soroush M. Computational methods for pipeline leakage detection and localization: A review and comparative study. Journal of Loss Prevention in the Process Industries. 2022, 77, 104771.
https://doi.org/10.1016/j.jlp.2022.104771
|
| [4] |
Li Y, Wang Y, Xiao L, Bai Q, Liu X, Gao Y, et al. Phase demodulation methods for optical fiber vibration sensing system: A review. IEEE Sensors Journal. 2021, 22(3), 1842-66.
https://doi.org/10.1109/JSEN.2021.3135909
|
| [5] |
Rahman M, Taheri H, Dababneh F, Karganroudi S, Arhamnamazi S. A review of distributed acoustic sensing applications for railroad condition monitoring. Mechanical Systems and Signal Processing. 2024, 208, 110983.
https://doi.org/10.1016/j.ymssp.2023.110983
|
| [6] |
Shang Y, Sun M, Wang C, Yang J, Du Y, Yi J, et al. Research progress in distributed acoustic sensing techniques. Sensors. 2022, 22(16), 6060.
https://doi.org/10.3390/s22166060
|
| [7] |
Wang Y, Yuan H, Liu X, Bai Q, Zhang H, Gao Y, et al. A comprehensive study of optical fiber acoustic sensing. IEEE access. 2019, 7, 85821-37.
https://doi.org/10.1109/ACCESS.2019.2924736
|
| [8] |
Muggleton J, Hunt R, Rustighi E, Lees G, Pearce A. Gas pipeline leak noise measurements using optical fibre distributed acoustic sensing. Journal of Natural Gas Science and Engineering. 2020, 78, 103293.
https://doi.org/10.1016/j.jngse.2020.103293
|
| [9] |
Stajanca P, Chruscicki S, Homann T, Seifert S, Schmidt D, Habib A. Detection of leak-induced pipeline vibrations using fiber—Optic distributed acoustic sensing. Sensors. 2018, 18(9), 2841.
https://doi.org/10.3390/s18092841
|
| [10] |
Hussels M, Chruscicki S, Habib A, Krebber K. Distributed acoustic fibre optic sensors for condition monitoring of pipelines. Conference Distributed acoustic fibre optic sensors for condition monitoring of pipelines, Limerick vol. 9916. SPIE, p. 419-22.
https://doi.org/10.1117/12.2236809
|
| [11] |
Zhang J, Lian Z, Zhou Z, Xiong M, Lian M, Zheng J. Acoustic method of high-pressure natural gas pipelines leakage detection: Numerical and applications. International Journal of Pressure Vessels and Piping. 2021, 194, 104540.
https://doi.org/10.1016/j.ijpvp.2021.104540
|
| [12] |
Liu C, Li Y, Yan Y, Fu J, Zhang Y. A new leak location method based on leakage acoustic waves for oil and gas pipelines. Journal of Loss Prevention in the Process Industries. 2015, 35, 236-46.
https://doi.org/10.1016/j.jlp.2015.05.006
|
| [13] |
Bao X, Wang Y. Recent advancements in Rayleigh scattering-based distributed fiber sensors. Advanced devices & instrumentation. 2021, 2021, 8696571.
https://doi.org/10.34133/2021/8696571
|
| [14] |
Nicola M, Nicola C, Vintilă A, Hurezeanu I, Duță M. Pipeline leakage detection by means of acoustic emission technique using cross-correlation function. J Mech Eng Auto. 2018, 8, 59-67.
https://doi.org/10.5923/j.jmea.20180802.03
|
| [15] |
Fu S, Zhang D, Peng Y, Shi B, Yedili N, Ma Z. A simulation of gas pipeline leakage monitoring based on distributed acoustic sensing. Measurement Science and Technology. 2022, 33(9), 095108.
https://doi.org/10.1088/1361-6501/ac7633
|
Cite This Article
-
APA Style
Wang, S., Xu, D., Liu, G., Xue, T., Liu, Y. (2024). Application of Distributed Acoustic Sensing Technology in Pipeline Leakage Monitoring. Journal of Energy and Natural Resources, 13(2), 81-89. https://doi.org/10.11648/j.jenr.20241302.14
 Copy
|
Copy
|
 Download
ACS Style
Wang, S.; Xu, D.; Liu, G.; Xue, T.; Liu, Y. Application of Distributed Acoustic Sensing Technology in Pipeline Leakage Monitoring. J. Energy Nat. Resour. 2024, 13(2), 81-89. doi: 10.11648/j.jenr.20241302.14
Copy
|
Download
-
@article{10.11648/j.jenr.20241302.14,
  author = {Shuai Wang and Dianqiang Xu and Guanbin Liu and Tian Xue and Yu Liu},
  title = {Application of Distributed Acoustic Sensing Technology in Pipeline Leakage Monitoring
},
  journal = {Journal of Energy and Natural Resources},
  volume = {13},
  number = {2},
  pages = {81-89},
  doi = {10.11648/j.jenr.20241302.14},
  url = {https://doi.org/10.11648/j.jenr.20241302.14},
  eprint = {https://article.sciencepublishinggroup.com/pdf/10.11648.j.jenr.20241302.14},
  abstract = {Pipeline leak monitoring is an important industrial safety measure designed to ensure the safety of liquids or gases during transportation. Distributed acoustic sensing (DAS) technology is based on the reverse Rayleigh scattering inside the fiber to reflect the change of the measured physical quantity, and has great advantages in monitoring range, environmental adaptability, transmission loss control and system stability. In this paper, the pipeline leakage monitoring technology based on distributed acoustic sensing fiber is used to study the leakage signal of small leak aperture. In order to improve the sensitivity of leakage monitoring, the optical fiber is spiral wound on the pipe section. The identification method of pipeline leakage signal based on fast Fourier transform is proposed. By analyzing the vibration of the optical fiber in the time domain and the frequency domain, the leakage signal can be accurately monitored. Pipeline leakage tests with different leak apertures were carried out, and the leakage locations were studied by energy attenuation and cross-correlation techniques. The experimental results show that the time-domain signal fluctuates obviously and the full-band energy of the frequency-domain signal increases after pipeline leakage. The increase of leakage diameter will gradually increase the signal energy, and the leakage energy will gradually move from high frequency to low frequency. The energy attenuation positioning technique can locate the leakage within the range of a single sensing unit, and determine the leakage location through cross-correlation analysis with an error of less than 3 m.
},
 year = {2024}
}
Copy
|
Download
-
TY  - JOUR
T1  - Application of Distributed Acoustic Sensing Technology in Pipeline Leakage Monitoring

AU  - Shuai Wang
AU  - Dianqiang Xu
AU  - Guanbin Liu
AU  - Tian Xue
AU  - Yu Liu
Y1  - 2024/06/13
PY  - 2024
N1  - https://doi.org/10.11648/j.jenr.20241302.14
DO  - 10.11648/j.jenr.20241302.14
T2  - Journal of Energy and Natural Resources
JF  - Journal of Energy and Natural Resources
JO  - Journal of Energy and Natural Resources
SP  - 81
EP  - 89
PB  - Science Publishing Group
SN  - 2330-7404
UR  - https://doi.org/10.11648/j.jenr.20241302.14
AB  - Pipeline leak monitoring is an important industrial safety measure designed to ensure the safety of liquids or gases during transportation. Distributed acoustic sensing (DAS) technology is based on the reverse Rayleigh scattering inside the fiber to reflect the change of the measured physical quantity, and has great advantages in monitoring range, environmental adaptability, transmission loss control and system stability. In this paper, the pipeline leakage monitoring technology based on distributed acoustic sensing fiber is used to study the leakage signal of small leak aperture. In order to improve the sensitivity of leakage monitoring, the optical fiber is spiral wound on the pipe section. The identification method of pipeline leakage signal based on fast Fourier transform is proposed. By analyzing the vibration of the optical fiber in the time domain and the frequency domain, the leakage signal can be accurately monitored. Pipeline leakage tests with different leak apertures were carried out, and the leakage locations were studied by energy attenuation and cross-correlation techniques. The experimental results show that the time-domain signal fluctuates obviously and the full-band energy of the frequency-domain signal increases after pipeline leakage. The increase of leakage diameter will gradually increase the signal energy, and the leakage energy will gradually move from high frequency to low frequency. The energy attenuation positioning technique can locate the leakage within the range of a single sensing unit, and determine the leakage location through cross-correlation analysis with an error of less than 3 m.

VL  - 13
IS  - 2
ER  -
Copy
|
Download