Research Article | | Peer-Reviewed

Natural Hydrogen in the Northern Perth Basin, WA Australia: Geospatial Analysis and Detection in Soil Gas for Early Exploration

Received: 21 May 2024    Accepted: 11 June 2024    Published: 25 June 2024
Views:       Downloads:
Abstract

The scope of this work is to empirically check and prove the practical applicability of the Primordially Hydridic Earth (PHE) concept for early exploration of the resources of naturally occurring hydrogen. With the PHE concept postulates interpreted within the local geological, tectonic, petrological and geophysical context, the reconnaissance plan, as well as the field exploration and data acquisition programs, were put together and implemented in the field. The results obtained from the surface (<1m deep) soil gas survey performed in Western Australia (WA) resulted in values of hundreds of ppm H2, including three samples with a concentration of hydrogen exceeding the gas sensor detection limit of 2,000 parts per million (ppm) (the all-Australia record). Similarly, several of the shallow soil samples used for obtaining headspace gas extracts yielded dozens % H2, which was established utilizing Gas Chromatography (GC) technology. The latter tests established the all-Australia record of 58.3% (norm.) H2 concentration from 15 m depth, being the highest reading from the area of research. At one location, a concentration of He exceeding 8,000ppm was detected in a 1m surface soil gas sample analyzed by the independent lab. The most important outcome was finding natural hydrogen where it was expected and predicted. On the other hand, H2 concentrations exceeding the natural background of 1-3ppm were not detected in the soil gas readings outside of the areas identified using the PHE concept as a theoretical foundation. It may be stated that overall, the practical application of the PHE concept along with the thoroughly planned utilization of carefully selected exploration techniques brings satisfactory results.

Published in Journal of Energy and Natural Resources (Volume 13, Issue 2)
DOI 10.11648/j.jenr.20241302.15
Page(s) 90-113
Creative Commons

This is an Open Access article, distributed under the terms of the Creative Commons Attribution 4.0 International License (http://creativecommons.org/licenses/by/4.0/), which permits unrestricted use, distribution and reproduction in any medium or format, provided the original work is properly cited.

Copyright

Copyright © The Author(s), 2024. Published by Science Publishing Group

Keywords

Natural Hydrogen, White Hydrogen, Primordially Hydridic Earth, Clean Energy, Hydrogen Exploration

1. Introduction
Natural hydrogen research methods and exploration techniques are still in their early development phase. Due to the great variety of concepts and opinions on the subject, it is only reasonable to build the exploration strategy on theoretical calculations and experimental work results, rather than on assumptions and conjectures. To date, there is a substantial number of scientific works performed on the subject of deep-seated natural hydrogen formation and degassing processes:
In 1977, Stevenson suggested the iron hydride/s (FeHx) presence in the Earth's core, in an attempt to explain the well-known density discrepancies.
In 2005, Walshe stipulated the core of Earth being considered as a “dominant reservoir of hydrogen”. This conclusion correlates with the PHE model postulating that hydrogen-enriched diapirs get formed within the D”-layer between the lower mantle and the outer core (Figure 1), being further conveyed upwards towards the surface through the rifting zones, e.g., Mid-Ocean Ridges (MORs).
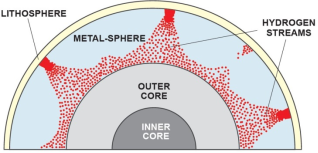
Figure 1. Hydrogen degassing from the core composed of metal hydrides, by Dr. V. Larin, 1993 – 2005. From V. Larin, 2005 . Translated into English by N. Larin, V. Vidavskiy (2020), unpublished.
One of the most significant observations was made by Rohrbach in 2011 , suggesting that the Earth's mantle is saturated with metallic iron at concentrations exceeding 75%.
Lately, there has been a significant influx of experimental data from the fundamental research domain, related to the subject of this paper. In particular, Ikuta et al. of Tohoku University arrived to the conclusion that the core composed of metal hydrides may contain up to 80 times more hydrogen than the entire hydrosphere.
Tagawa made a similar conclusion after conducting a series of lab tests researching hydrogen solubility in metals under extremely high pressures. A year later, the same team performed X-ray diffraction (XRD) and picosecond acoustic measurements and came up with the compressional wave velocity values, suggesting that hydrogen was stored in the Earth's core in the process of its formation.
The latter situation results in changing the nature of bonds between iron and hydrogen atoms in iron hydride FeHx from covalent to ionic. This phenomenon was recently reported by the team from the Chinese Academy of Sciences in Guiyang, China, headed by He who concluded the superionic nature of the matter inside the Inner Core (IC), upon performing the study of seismic velocities and magnetic field within the IC.
Furthermore, the D”-layer of the Earth's core is appeared to be formed by inter-metallic compounds , mostly by the iron (FexSiy) and, to a lesser extent, the magnesium (Mg2Si) silicides. (Notably, normally semi-conductor Si starts behaving like a metal under high pressures. This transition takes place at 10.3GPa, see U. Schwarz . These intermetallic compositions were studied by Lord to identify the reason for the negative Vp and Vs velocity anomalies within the D”-layer. As a result, this research group concluded that due to its properties, FexSiy corresponds best to be appointed as the primary component forming the D”-layer.
Summarizing all the above, it is obvious that all this data has to be conceptually explained. In this regard, the PHE concept, first formalized in last quarter of XX century by V. Larin (), provides logical and scientifically substantiated framework for addressing this challenging task.
Hydrogen gas emissions, or seeps, on the surface appear to be a good starting point for early exploration, provided the locations of these signs are pre-identified properly. The earlier results in the Northern Perth Basin obtained around Lake Dalaroo, 2.5km W of Moora, WA in 2021 showed the certain potential of the area of research in regards to the natural hydrogen manifestations in the soil gas. The results demonstrated by this research group with the H2 readings not exceeding 96ppm were repeated (on the same order of magnitude) by this paper authors (38ppm, see 2.2.4. Geomorphology, Figure 14b) in the course of this research. Apparently, the work by Frery was based on studying the circular depressions, or so-called “fairy circles” (see 2.2.4. Geomorphology), in relation to ultramafic rocks serpentinization, as well as iron-rich rocks and mafic dikes oxidation a.k.a. ferrolysis, viewed as potential sources of hydrogen. However, the authors of this paper, using the different conceptual basis (see above, 1. Introduction), prefer not to fixate on a single geomorphology structure type, since natural hydrogen is known to be detected in multiple terrains and landscapes . As for serpentinization, the authors consider this process being described rather elegantly by Yurkova , suggesting the governing role of chemically reduced H2-rich fluids in it:
2Mg2SiO4(Ol/Fo)+Mg2Si2O6(Px/En)+4СО+12Н2→2Mg3Si2O5(ОН)4(Srp)+4СН4(1)
This view was further developed by other researchers .
The exercise of pre-identifying the areas potentially anomalous in natural H2 was performed by this paper authors based on the extensive study of numerous geologic structures in Australia, where hydrogen emissions have been observed in the past . Then, the structural similarities principle was applied, with the certain extrapolations aimed to absorb the variances in a number of situational parameters. As a result, the primary Areas of Interest (AOI) were identified in the state of WA, broadly corresponding to the western cratonic margin of the Yilgarn Craton, contacting the Pinjarra Orogen zone forming the Perth Basin. The suggested area was researched in depth by performing the extensive desktop study, followed by a series of field data acquisition and sampling campaigns performed in order to confirm the practical applicability of the PHE concept.
2. Desktop Study
This research was conducted using the framework of the PHE concept as the scientific foundation, governing the selection of data sources as well as its synthesis, analysis, and interpretation. Consequently, this data analysis was performed in conjunction with the hydrogen’s known elementary physical and chemical properties.
2.1. Palaeotectonical, Geodynamical and Structural Setting
Deep-reaching structural features such as normal faults, strike-slips and thrust faults, are suggested as probable natural hydrogen degassing conduits . In this regard, the area of interest was studied through the prism of the modern tectonic activity involving the major structural elements. Several areas corresponding to the potential structures a.k.a. “chimneys” conveying hydrogen to the surface, were preliminarily identified as prospective for natural hydrogen.
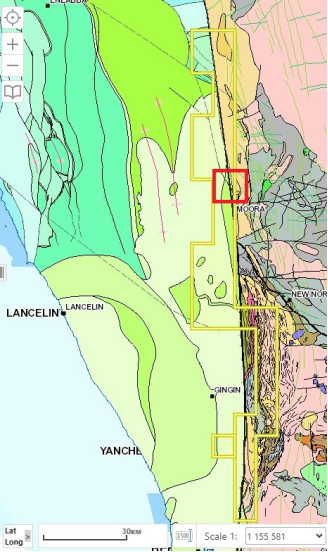
Figure 2. The area of research (yellow polygons), interpreted bedrock geology, and main structural features. The AOI is indicated in red rectangle. From GeoVIEW.WA, 2023 https://geoview.dmp.wa.gov.au/. The legend is available from the source.
The primary AOI is located in Western Australia, along the Darling Fault N-NE Perth, covering the eastern flank of the Northern Perth Basin and the western margin of the Yilgarn Craton (Figure 2).
The local geology appears to have been studied in much detail by several generations of researchers. From the petrology and lithology viewpoints, formations to the east of the Darling Fault are represented by a series of granitoids and greenstone belts of the Yilgarn Craton (Figure 3), while the western flank is formed by the sedimentary sequences of the Perth Basin, aged Permian through Cretaceous.
In terms of its tectonic setting, this area is represented by a typical cratonic margin environment, transiting to a sedimentary basin through a series of asymmetric NW-SE striking normal faults, with quite steep dips and deep throws (Figure 4), indicating that the major faults forming the structural network may detach at greater depths within the basement . In the area of this research, these faults dip in the W – NW – SW direction.
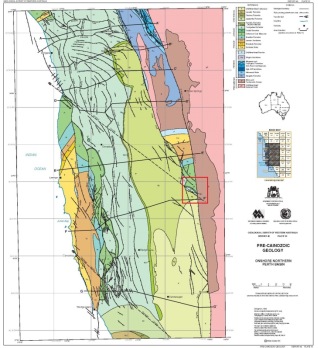
Figure 3. North Perth Basin structural map, Pre-Cainozoic geology. From A. J. Mory and R. P. Iasky, 1996 . The AOI is indicated in red rectangle.
The Darling Fault is the dominating structural element, extending in the general N-S direction for over 1,100 km and separating the Yilgarn Craton to its east from the Perth Basin to its west. Darling Fault is traced to the deep layers of the crust, possibly extending through the Moho into the top lithospheric mantle, approximately at depths about 38-40 km within the area of research. At a depth of about 6km to 7km below the surface, the Proto-Darling Fault structure was identified, being characterized by a zone of poor to no seismic reflection .
On the Perth Basin flank to the west of the Darling fault, the Urella (N Moora) and the Muchea (S Moora) oblique faults (effectively half-grabens) form the Irwin and the Barberton terraces, correspondingly. The Dandaragan Trough is located to the west of Moora, contacting with the Moora Group to the east, on the Eastern (craton) flank of the Darling fault, with the latter forming a volcanic–clastic-carbonate shelf-platform sequence .
The development history of the Perth Basin comprises at least three extension events, followed by the post-rifting sedimentation cycles . The earliest rifting event took place in the Early Permian (ca. 290Ma) and finally resulted in the early Cretaceous (132-140Ma) Gondwana breakup followed by the Greater India sub-continent departure from the Western Australian Craton (WAC) agglomerate.
A comprehensive Perth Basin tectonic structures development synthesis was presented by Harris . According to this research, the system experienced a series of extensional and compressional cycles, alternated by both dextral and sinistral transpressional and transtensional events of a complex geometry.
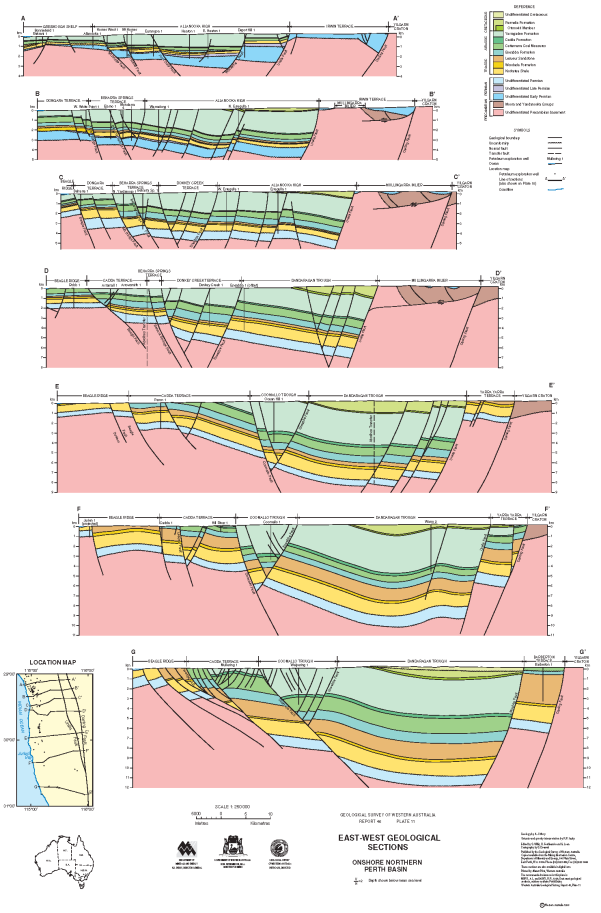
Figure 4. North Perth Basin structural cross-sections. From A. J. Mory and R. P. Iasky, 1996 .
Some researchers believe that the rifting processes are still ongoing in the area , while others directly compare the Darling Fault – Perth Basin structure with the San Andreas fault in California, the USA.
Summarizing, the Darling Fault’s (palaeo)tectonic situation and structural setup allow making several assumptions:
1. The Darling Fault runs very deep into the lower crust and is likely to communicate directly with the top of the lithospheric mantle;
2. The Darling Fault's rifting history accounts for several re-activation cycles, one of those eventually resulted in the Greater India breakup and departure;
3. There might be evidence that nowadays, the Darling Fault is not entirely quiescent, experiencing certain structural activity of the dextral strike-slip nature along its extent.
In regards to the driving forces behind this tectonic activity, there are a number of opinions among the research groups. We tend to support the views expressed by Hoskin et al. (Figure 5 and Figure 7) stipulating that the development model for the Darling Fault zone (DFZ), is best explained by the asymmetric graben structure, a.k.a. the “core complex” (Figure 6) according to Buck . Interestingly, the latter researcher described the conditions necessary for such structure development as resulting “from extension at high strain state over a narrow [<100km wide] region”.
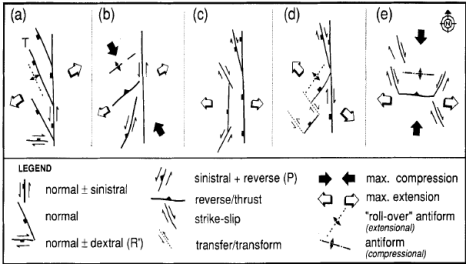
Figure 5. Schematic representation of Late Palaeozoic and Mesozoic structures within the Perth Basin: (a) sinistral transtension due to approximately NE-SW extension between Greater India and Western Australia between the Middle Carboniferous to earliest Triassic; (b) Sinistral transpressional event (latest Early to Middle Triassic); (c) Latest Triassic to Early Jurassic east-west to WNW-ESE extension; (d) NW-SE "break-up" extension in the latest Jurassic to Early Cretaceous; (e) North-south to NNE-SSW compression east-west to WNW-ESE extension, aged Neocomian to ?. From L.B. Harris, 1994 .
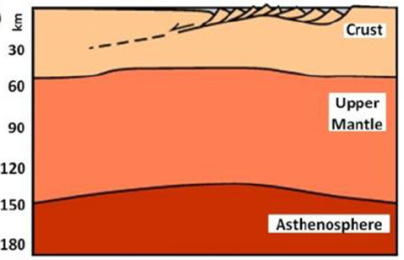
Figure 6. The model for crustal extension (after Buck, 1991 ) best fits the Darling Fault Zone observations.
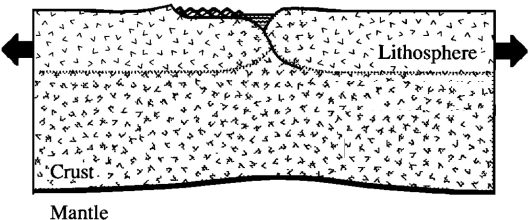
Figure 7. The sketch of the Core Complex mode of lithosphere extension. The crustal thickness is 50km. Modified from W. R. Buck, 1991 .
This crustal structure development mode also corresponds to the “passive” rifting classification (Figure 8) by Merle , who attributed the lithospheric structures’ extension processes to the regional stresses located within the lithosphere, i.e., not involving any mantle “plume” upwelling – as opposed to the “active” rifting requiring such deep activity. Such a “passive” rifting process was dubbed as “lithosphere-activated” by Condie .
However, neither of the paper authors cited above have come up with an explanation of a mechanism that could possibly drive such powerful pulling forces enabling the lithosphere extension. In our opinion, this phenomenon could be rationally described by the planet Earth expansion model, according to V. Larin .
One of the potentially productive structures herein labeled as AOI is located within the northern section of the study area, forming the landscape around the Pinjarrega Lake (Figure 9). Two major faults, Darling to the east and Urella to the west, are intersecting in – or, more accurately, beneath - the Pinjarrega Lake area, forming a unique cluster of tectonic structural elements, which relationship is depicted in Figure 4, section F . The Urella Fault splay sprouting to the east-south-east runs parallel to the Abrolhos Transfer Zone (ATZ) located 3km to 4km to the south. On the eastern flank of the Darling Fault, on the Yilgarn Craton, the NW-SE Yandanooka – Cape Riche Lineament marking the 20-40 mGal step change in gravity roughly aligns with the ATZ on the Perth Basin flank to the east (Figure 9).
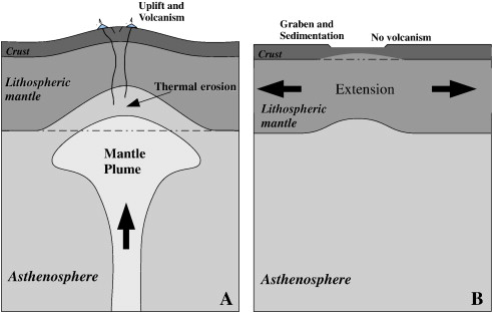
Figure 8. The early stage of the tectonic evolution for “active” (A) and “passive” rifting (B). “Active” rifting displays lithospheric uplift and volcanism resulting from thermal erosion at the base of the lithosphere, whereas “passive” rifting displays graben formation and sedimentation without volcanism as a result of horizontal extension of the lithosphere. From O. Merle, 2011 .
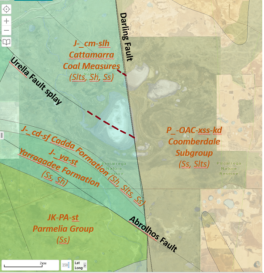
Figure 9. The AOI, Pinjarrega lake, WA interpreted bedrock geology, stratigraphy and structural; tectonic features. Extrapolated fault extensions shown in cherry dotted lines. Modified from GeoVIEW, 2023 https://geoview.dmp.wa.gov.au/. The legend is available from the source.
The Urella fault throw is described as being maximal in the area between 29°40' and 30°05’S latitude . According to Hoskin , the basin subsidence in the Northern part of the Perth Basin was predominantly controlled by the Urella Fault, allowing to suggest the latter’s primary role in tectonic processes, as opposed to the Darling Fault. Both the Darling and the Urella faults are believed to be quiescent since the Early Cretaceous; however, their nowadays re-activation is quite possible, resulting in promotion of natural hydrogen degassing activity along the mantle-reaching conduits associated with them.
2.2. Datasets Used
It is very important to properly select the appropriate datasets for the desktop analysis to be performed for an AOI in order to suggest its natural hydrogen potential and, in the best case, to preliminarily identify potential targets for further research, represented by structures conducting natural hydrogen to the surface.
In the course of this research, the comprehensive study of borehole data available for the territory of the state of WA from the open sources was performed with the purpose of obtaining in-depth lithological, petrological and geochemical data. Several interesting observations were made, although some of these were related to the areas outside the AOI boundaries. This dataset provided extremely valuable information on the local structural relationships and contact depths, mineralogy alteration systems location/depth and degree, as well as exact fault positions and directions. These datasets analysis contributed to the preliminarily identification and prioritization of potentially hydrogen-productive subsurface structures.
2.2.1. Deep Seismic, ANT, MOHO Depth
MOHO depth research data may provide valuable information about the mantle proximity to the surface, since the depth of the Mohorovičić boundary, often referred to as MOHO , may well become one of the parameters potentially indicative of the natural hydrogen degassing activity.
The first extensive deep seismic study across the Darling Fault took place in 1992, the very comprehensive interpretation of which was performed by Middleton . One of the most interesting observations was made in relation to the deeper structural extension of the Darling Fault named the Proto-Darling Fault, which was interpreted as a zone lacking any seismic response. The reasoning for the Proto-Darling Fault’s lack of seismic response was offered based on the current geophysical science views, suggesting either a high degree of structural deformation or the “fault shadow” effect (Figure 10). The extension depth of this structure could not be determined, which allows us to assume that its roots expand deep into the lower crust and/or into the top lithospheric mantle.
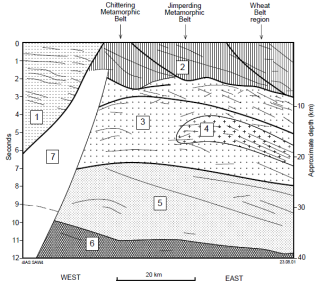
Figure 10. Line diagram of major reflectors from the New Norcia deep seismic traverse: (1) Perth Basin; (2) Western Gneiss Terrane; (3) an intermediate crustal zone within the Yilgarn Craton; (4) a zone of strong reflections within zone 3; (5) a deep crustal zone that contains several easterly dipping reflection events; (6) the Moho Zone; and (7) the "Proto-Darling Fault". From M.F. Middleton, 1995 .
Another set of data applicable and quite useful for the natural hydrogen early exploration is provided by the Commonwealth Scientific and Industrial Research Organisation (CSIRO) in their research of the Earth crust by means of the Ambient Noise Tomography (ANT), involving passive seismic imaging. However, it is crucial to point out that this geophysical method shall be utilized very consciously, by a provider possessing substantial experience with natural hydrogen degassing systems, and with a number of factors taken into account, since the interpretation results greatly depend on a specific tectonic and lithology/petrology context, petrophysical anisotropy, fluidal phases’ contrast, etc.
The analogies from other regions, such as wells Mt Kitty-1, Dukas-1 and especially Magee-1 wells in the Amadeus Basin, the Northern Territory (NT), allow to suggest that along with the Moho proximity depths, the “gradient” of the Moho “hill slope” is quite important, too, see Figure 11.
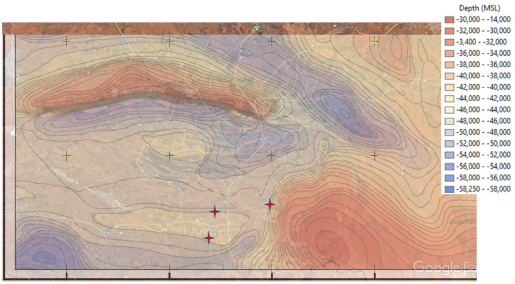
Figure 11. Moho depth E Amadeus Basin, NT. Mt Kitty-1, Dukas-1 and Magee-1 wells indicated in red diamonds. Modified from Debacker .
In this regard, it seemed worthwhile to include the Moho structure data into account while studying natural hydrogen potential within the AOI, at least at the general consideration level. However, the accuracy of the current Moho mapping provided by the GeoVIEW program does not allow turning this parameter into a significant contributor to the decision-making process.
2.2.2. Remote Sensing - Satellite Imagery, ASTER
These datasets improve the identification of potential “hotspots” at the early stages of exploration.
Hydrogen has a strong emission line at 6563 Å which is imaged by the VNIR and SWIR cameras of remote sensing satellites such as Aster, Landsat and Sentinel-2. The Sentinel-2 camera is a pushbroom sensor. The field of view is 10,980 columns which are collected by arrays of sensors finely calibrated for the gas signature to be the same across the image. H2 layers provided by Manatee Ltd. are produced by three complementary algorithms: spectral modelling, spectral un-mixing, and spatial modelling, the latter assuming escaping H2 induces optical turbulence in a scene. The results of these algorithms used for interpretation of Sentinel-2 VNIR and SWIR band imagery are demonstrated in Figure 12a, b, c, d.
Gases’ emanation activity and concentration are estimated using a spatial and two spectral approaches:
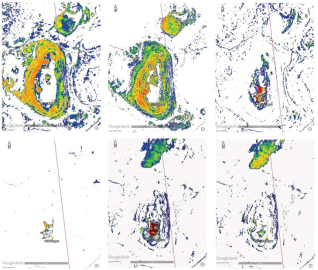
Figure 12. The AOI, Pinjarrega Lake, WA. Satellite imagery: (a) H2 Spectral un-mixing; (b) H2 Synthetic emission spectra; (c) H2 Optical turbulence; (d) “Purified” H2 Optical turbulence; (e) methane CH4; (f) ethane C2H6. H2 readings marked in ppm shown in yellow pins, and Darling Fault shown in a solid pink line. Modified from Google Earth and Manatee Ltd., 2022. Courtesy of Macallum New Energy Ltd.
1. Synthetic emission spectra may be resampled to satellite bandpasses;
2. Optical turbulence: Escaping H2 will cause optical turbulence which may be quantified in an image, and so H2 estimates may be inferred from optical turbulence (OT) rather than direct detection of gas;
3. Spectral un-mixing: Un-mixing into spectral endmembers may be achieved with likely gas spectra identified by their spectra and abundance distribution.
Along with hydrogen projections, other associate gases’ emanation maps appear to be extremely helpful in assessing their degassing activity and the “first choice” areas for initial (preferred) approaching the potentially promising locations:
1. Helium He: this gas very frequently accompanies hydrogen in its surface manifestations, also sharing their de-gassing paths on the way through the top silicate crust to the surface;
2. Ozone O3 Deficiency: According to the researchers , hydrogen turns ozone O3 molecules into oxygen O2 by reacting with a single oxygen atom having a relatively loose bind with the main O2 pair of atoms, with water produced as a by-product. However, the emission line for ozone has a peak absorption at a wavelength of 254 nm, which is located in the ultraviolet (UV) light region of the electromagnetic spectrum and too short for Sentinel-2 sensing;
3. Methane CH4 (Figure 12e): A recent paper available on the Sentinel Copernicus website develops a simple band ratio algorithm to estimate the CH4 gas endmember. From the product supplier statistics, methane manifestations statistically coincide with hydrogen degassing signs in ~83% of cases.
Advanced Spaceborne Thermal Emission and Reflection ASTER dataset assists with the identification of mineral associations (Figure 13) as well as reduction / oxidation (redox) balances. It is supported by a number of platforms. In WA, it is included in the GeoVIEW geoscience platform. ASTER layers offer several types of geochemical and mineralogical data on the Project Area, examples below :
1. Ferrous Iron Index reflects the Fe2+ relative abundancy, which under certain conditions may indicate the degree of chemical reduction possibly due to hydrogen presence, demonstrating the redox balance shift;
2. Opaque Index, which is a combination of the following: (1) magnetite-bearing rocks (e.g., Banded Iron Formations [BIF]); (2) maghemite gravels; (3) manganese oxides; (4) graphitic shales. (1) and (4) above can be evidence for “reduced” rocks when interpreting redox gradients;
3. Ferric Oxide Content: (1) Mapping transported materials (including palaeochannels) characterised by hematite (relative to goethite); and (2) hematite-rich areas in “drier” conditions (e.g., above the water table) whereas goethite-rich in “wetter” conditions (e.g., at/below the water or areas recently exposed);
4. Quartz Index: Use in combination with the Silica index to more accurately map, for example, quartz rather than poorly ordered silica like opal or other silicates like feldspars and (compacted) clays;
5. Silica Index: Broadly equates to the silica SiO2 content though the intensity (depth) of this feature is also affected by particle size <250 microns.
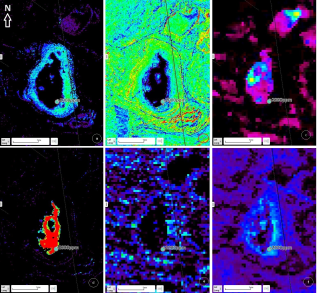
Figure 13. The AOI, Pinjarrega Lake, WA. ASTER imagery layers: (a) Ferrous Iron Index; (b) Ferric Oxide Content; (c) Gypsum Index; (d) Opaque Index; (e) Quartz Index; (f) Silica Index. Darling Fault zone shown in solid black lines. GeoVIEW.WA https://geoview.dmp.wa.gov.au/. The legend is available from the source.
2.2.3. Geomorphology
This dataset is aimed to identify certain terrain features revealing potential hydrogen manifestations and its activity impressions in landscapes: circular depressions, (palaeo)drainage patterns, sand blows/boils a.k.a. injectites , etc.
Geomorphology features are very important for natural hydrogen degassing structures research and exploration. However, this criterion has to be analyzed involving a number of factors, such as:
1. Soil substrate: redox (pH) balances, regolith thickness and, in some cases, agricultural activity level;
2. Surface and bedrock geology context, e.g., cratons vs. basins, as well as sedimentary cover thickness;
3. Tectonic developmental history;
4. Structural features and their relationships;
5. Geochemical parameters;
6. Petrology (both concordant and discordant intrusions), petrochemistry (alterations and their sequences) and mineralogy (typical associations) aspects.
Sometimes, the certain geomorphology features such as circular depressions first noted by V. Larin , sometimes referred to as “fairy circles” by some researchers, may provide the leads to potentially active hydrogen conducting structures. (The “fairy circle” term was originally introduced for the certain flora phenomena described in botanic disciplines. We consider the use of this term to describe natural hydrogen geomorphological manifestations on terrain surfaces as scientifically inappropriate.) However, we would like to warn the researchers from relying too much on this feature alone, because of two reasons:
a) Natural hydrogen is quite often detected at the locations having no circular depressions nearby , and
b) Our field soil gas detection results confirmed that several very distinctive circular depressions earlier described by the other scholars do not yield any significant levels of hydrogen concentrations (Figure 14b), possibly due to the migration of the hydrogen conveying “chimney” away from its previous position as a result of complex geodynamical and tectonic factors.
Within the area of this research, there are several clusters of circular depressions studied in the process, with the following H2 concentrations in the top soil layer (<1m) – see Figure 14:
1. Pinjarrega Lake (Figure 14a)
2. Lake Dalaroo (Figure 14b)
3. Lake Eganu (Figure 14c)
4. Namban lake system
5. Coonderoo lake
6. Nameless circular structures across the research acreage
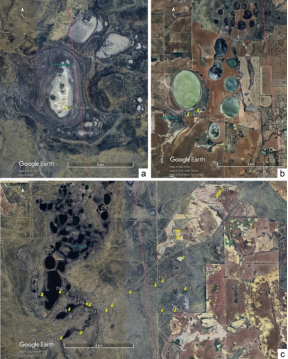
Figure 14. Circular depressions studied in AOI: a. Pinjarrega Lake, b. Lake Dalaroo, c. Lake Eganu. H2 readings marked in ppm shown in yellow pins, Darling Fault shown in solid pink line. Modified from Google Earth, 2023.
Interestingly, several of the local land users note that in some cases, circular depression emergence process dynamics could be watched “in real time”, when the subject land plot is owned by the same land user for long enough. The process is described in the following way:
1. First, the gentle hill appears;
2. Then, the top of the hill develops the “sand blow”, with inevitable soil fertility loss and its consequent erosion;
3. Later, the top of the hill starts caving in, forming the “crater”, with its further subsidence;
4. Finally, this “crater” gets filled with fresh water coming up from the deep;
5. Initially, the water is fresh, with the stock readily drinking from it. Later, within several years to decades, water salinity increases to the undrinkable levels.
This process is described pretty much the same way along the entire strike of the northern part of the Darling Fault within the area of research, allowing to suggest the modern geomorphologic activity, apparently being related to the natural hydrogen degassing processes along this regional tectonic structure.
All the examples above demonstrated significant concentrations of hydrogen in soil gas readings, from several hundred ppm to the excess of 2,000ppm (the MX6 unit detection range limit for H2). The Dalaroo Lake located 2.5km W of the town of Moora makes a significant exception in this regard, with H2 concentrations not exceeding 38ppm, being of the same order of magnitude with the results achieved by Frery .
Other geomorphology features bearing significant meaning in the process of the early exploration for natural hydrogen are represented by gentle hills with sand “blow-outs” and other expressions of collapse on their summits or very close to them. These structures are associated with hydrogen degassing processes causing water interaction with swelling clay beds immediately close to the surface. Some researchers explain the presence of the latter by low temperature metasomatic leaching, dubbing this process as hydrothermal argillization.
Circular sand dunes named “sand boils” in Arkansas, USA (Figure 15), are closely related to seismicity causing liquefaction processes. In the scientific literature, these specific near-surface micro-tectonic and geomorphological features are dubbed as “injectites, a.k.a. “sand dikes”. These structures were studied in the process of conducting this research as well, yielding somewhat significant H2 readings from several dozen ppm up to 1,000ppm from the shallow (<1m deep) holes. However, due to the extremely high mobility of H2, it would be unrealistic to expect high readings through the unconsolidated soils e.g., loose dry sands and loams.
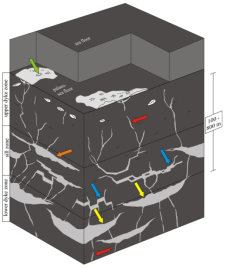
Figure 15. Sand injectite: A synoptic of a sand injectite complex with a tripartite architecture based on outcrop and subsurface observations in host rock (dark grey). Remobilized parent sandstone units (yellow arrows); sandstone dikes (red arrows) and sills (blue arrows); irregular sandstone intrusions (orange arrow); sandstone extrudites (green arrow). From A. Hurst, 2011 .
The list of geomorphology structures studied within this research and mentioned above is not exhaustive; however, the scope of this paper does not allow expanding further on this subject.
2.2.4. SEEBASE
The importance of this source of geological and geophysical data provided by Geognostics (https://www.geognostics.com/) offering a wealth of information about deep layers and structures cannot be overestimated. In 2022, Geognostics issued a new, updated and more detailed report on the Perth Basin structural geology, as well as on its development history. Interestingly, the latter mostly comprises the extensional events, supporting the vision of the Perth Basin posing as a major rifting structure.
The meticulously detailed 3D image of the Perth Basin is shown in Figure 16, allowing to see the relationships between the major tectonic units.
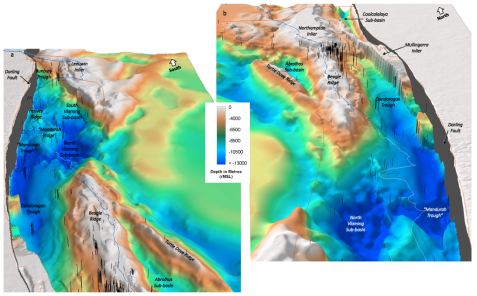
Figure 16. Oblique 3D view of the Perth Basin, (a) North to South; (b) South to North. From Geognostics Australia Pty Ltd. 2022 https://nla.gov.au/nla.obj-3135827579/view.
2.2.5. Conductivity Data
This dataset provides knowledge about the deep structures potentially associated with hydrogen activity.
Electric resistivity/conductivity data plays an important role in natural hydrogen studies . Structurally speaking, conductive protrusions identified by magnetotellurics (MT) electrical resistivity data acquisition may be interpreted as pre-cursors for the early reconnaissance of the natural hydrogen potential. Therefore, positive conductivity anomalies could possibly become the indicators of hydrogen degassing activity nearby and/or of its reactive products’ presence in the system.
In the specialized literature, there is no shortage of attempts to explain the prominence and the existence of highly conductive structures discovered in impressive quantities around the world, with early systematic attempts dating back to early 1990s . Several mechanisms are proposed to explain this phenomenon, every each of them being scrutinized and eventually rejected, for the following reasons:
1. Graphite films binding rock grains: large grain size in the lower crust supporting resistivity ; low mobility of carbon ; lack of possibility to stay interconnected for hundreds of km due to the limited stability of grain-boundary films ; thermal stability of graphite, especially in regards to its irreversible dehydration processes ; tectonic stresses permanently breaking the graphite connection pathways ; higher interfacial energy and larger dihedral angle between graphite and olivine .
2. Mylonite petrology: low frequency of occurrence within the Darling Fault region .
3. Fluids in porous zones: this model requires an unrealistically high percentage of pores, over 10% or even between 10% and 30%, based on the gravity model estimates ; depth constraints posed by the requirement to have permeability pathways, which contradicts the seismic quiescence of the Darling fault estimates .
4. Partial melt: temperature, [shallow] depth and mineralogy constraints
According to the PHE concept, the mantle is composed of inter-metallic substance . In the certain tectono-structural environments, this substance may protrude closer to the surface, resulting in a number of geophysical, geochemical and geomorphological consequences .
These wedge-looking structures formed by intermetallic silicides (Figure 17) shall come up as extremely strong conductors on the resistivity cross-sections. During the past couple of decades, with the massive arrival of fundamental research data, this model of the planet structure and composition was confirmed by a number of independent researchers. In particular, Rohrbach stated that “More than 75 vol.% of the Earth’s present-day mantle is likely to be saturated with metallic iron.”
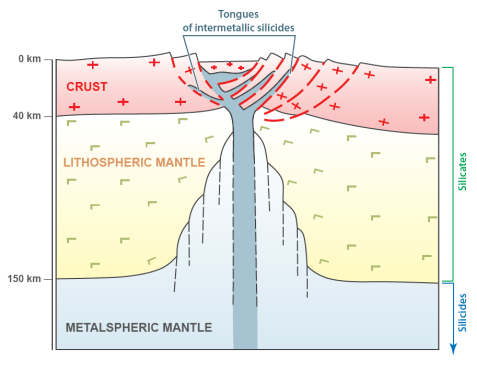
Figure 17. A diapir of the “abnormal mantle” (intermetallic silicides), in the zone of a modern continental rifting. Modified from V. Larin, 2005 (rus). Translation 2020 – unpublished.
Other researchers admit that the presence of hydrogen is likely to increase formations’ conductivity, e.g., through the ionic to proton diffusion transit mechanism in Fe, Mg silicates with depth . The latter perfectly correlates with the PHE concept conclusions in regard to the transit of covalent and ionic bonds between hydrogen and various metals under pressure .
There are two known deep MT transects available for the areas adjacent to the research area:
C.II.6.i. New Norcia (NN) MT Transect , which was run along the earlier deep seismic transect. It was acquired in 2011, running W - E crossing the Darling Fault south of New Norcia. This transect offers a very comprehensive set of data regarding regional structural lineaments, some of them extending into the research area.
Later, this transect was re-interpreted by T. Hoskin for his PhD Thesis . Remarkably, the conductive bodies associated with the main tectonic structural features are still very much recognizable in this latest interpretation.
The conductive zones in the western section of the transect were interpreted to be closely related to the Muchea (UF) and the Darling (DFZ) Faults (stations NN05 and NN06, correspondingly), apparently running upwards towards the surface from the deeper geospheres, while the latter possibly communicate with the mantle beneath the Moho. This explains the role of the Darling Fault serving as a conduit for deep-seated hydrogen, conveying it to the surface.
C.II.6.ii. Coorow – Green Head (CGH) MT Transect, which was shot between 2011 and 2014. Data interpretation was performed immediately upon this project's completion and revealed several conductive structures associated with the deep faults crossed by this transect. Same as for the NN MT transect in C.II.6.i above, the CGH transect originally interpreted in 2015 was also re-interpreted by T. Hoskin in 2017 for his PhD Thesis .
It is well seen that on the craton flank of the Darling Fault (central to eastern part of the transect), deep faults apparently communicating with the lower crust and, most likely, with the upper mantle, quite often demonstrate their affinity with the conductive structures extending to great depths, possibly beyond the Moho. Quite contrary, the very pronounced conductivity anomalies in the Perth Basin (central to western part of the transect) seem to be relatively shallow, not expanding too deep.
2.2.6. Tectonic Stresses, Seismicity; Tectonics, Geodynamics, Petrology
In-situ tectonic stress analysis is essential for understanding the current extension/compression regime/s . It may assist with the task of assessing both regional and local forces acting in the crust, potentially either promoting or inhibiting natural hydrogen and other gases’ migration processes.
For certain reasons, in-situ tectonic stresses in general are mostly studied for the purpose of assessing regional seismicity risks and predicting earthquakes . Therefore, such research is concentrated on the orientation (azimuth) vector as well as on its absolute force and/or its magnitude - but not on the compression/tension regimes, which is quite understandable, with consideration of the main purpose of such studies.
The majority (53%) of reliable data for in-situ tectonic stresses is provided by means of analyzing physical defects occurring in the process of well drilling: break-outs (43%), DITF - drilling-induced tensile fractures (8%), and over-coring processes (2%) . However, it is important to bear in mind that these analyses start bearing sensible meaning below the certain depths – for the wells where such measurements are taken, not being the case for the majority of shallow mining and geotechnical operations. For this reason, the number of analyzed boreholes is limited to deeper (petroleum) wells.
At any rate, the study we conduct on tectonic stresses potentially affecting hydrogen degassing paths through deeper geospheres requires data from much greater depths, currently inaccessible by means of conventional drilling.
The commonly accepted viewpoint suggests mostly compressional stresses for the SW of the Australian continent.
Other researchers who base their conclusions on the practical work results, however, disagree with this mainstream viewpoint, proposing mostly extensional mode for the majority of Australian megastructures. Noticeably, the stipulated stress magnitudes suggest the maximal value of 90 MPa for the Yilgarn Craton, as well as the complete lack of (significant) compression zones for the entire continent.
This latter view agrees with the PHE concept, according to which the majority of global tectonic structures are subjected to the stress modes represented by extension not compression, primarily due to the acknowledgement of the expanding planet model .
The vision of extension tectonic stresses prevailing in the research area is supported by the earlier researchers , at least in its western part – see the Perth Basin (western) flank in Figure 18.
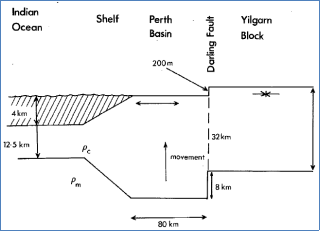
Figure 18. Schematic model of the crust in western Australia across the Perth Basin and Yilgarn Block. The buoyancy force results in uplift of the basin and in tensional stress near the basin surface and compression stress in the Yilgarn Block. From K. Lambeck .
Studying earthquakes epi- and hypocenters allows to assess their relationship with structural features and, potentially, with deep hydrogen-conveying magmatic bodies. For the AOI, the majority of the known earthquakes are concentrated to the east across the Darling Fault (Calingiri, Cardoix) -SE (Meckering), within the Yilgarn Craton terranes. Within the Perth Basin, the seismicity is insignificant, which may be attributed to the crystalline basement rock thicknesses of up to 14,000m; sedimentary basin formations do not transfer the shocks that easily, effectively muffling them to hardly noticeable magnitudes.
This dataset assists with identification of potential hydrogen migration pathways from deeper geospheres towards the surface along the petrophysically weakened irregularities and anisotropy vectors – See Palaeotectonical, Geodynamical and Structural Setting above.
Same as above, intrusive bodies’ contact zones represented by altered mineralogy associations offer a great opportunity for forming natural hydrogen conduits.
2.2.7. Radiometry
The results of the recent work done by a group of European researchers , who noticed a correlation between the natural hydrogen degassing manifestations on the surface and Th and U concentrations in the top soil layers. According to this research, high concentrations of Th and low U/Th ratios correlate with high H2 concentration anomalies.
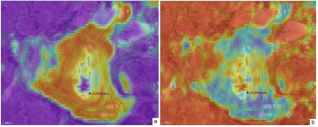
Figure 19. The AOI, Pingarrega Lake: (a) Thorium Th concentrations in ppm; (b) U/Th ratio. Warmer colors represent higher values. H2 reading in ppm. Modified from GA https://portal.ga.gov.au/. The legend is available from the source.
The GA website (https://portal.ga.gov.au/) offers the maps of Th concentrations and U/Th ratio (Figure 19a and Figure 19b, correspondingly). For some locations where H2 presence was detected, these maps demonstrate significant levels of radiometry data correlation with soil gas measurements for the bulk of the structure, whilst there is little or no correlation, at all for others.
Overall, in our opinion, this technique may benefit from conducting further practical research performed in-situ, with comparisons to be made between the desktop studies and the results of the soil gas detection in the field.
2.2.8. Soils
This parameter may be used for determining redox balances and forecasting the field conditions while planning soil gas sampling campaigns.
For Western Australia, we were unable to find this data layer readily available in GeoVIEW or any other system supported by the state, compared to how it is quite comprehensively done in South Australia, being offered through the South Australian Resource Information Gateway (SARIG) platform (https://map.sarig.sa.gov.au/).
Based on data available from the Geoscience Australia (GA) platform (https://portal.ga.gov.au/), the structures emitting H2 confirmed by the surface gas surveys, are characterized by the elevated pH values, thus demonstrating higher chemical reduction potential, see Figure 20.
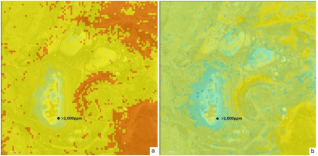
Figure 20. The AOI, Pingarrega Lake, pH in Calcium Chloride of the soil within: (a) 0 – 5 cm depth layer; (b) 100 – 200 cm depth layer. Colder colors represent higher values. H2 reading in ppm. Modified from GA https://portal.ga.gov.au/. The legend is available from the source.
From Figure 20, it is also apparent that the pH values turn becoming more alkaline with depth, which correlates with the view of H2 chemical reduction role. Contrary, closer to the surface, the system behaves as more acid, being influenced by atmospheric oxygen.
Another phenomenon of natural hydrogen interaction with soils is related to the humus degradation, followed by subsequent fertility loss. Being the aggressive chemical reduction agent, hydrogen tears long soil organic acid molecules apart, which results in forming shorter molecular chains. This effectively causes soils’ depletion/dilution, with erosion expanding rather quickly due to the decreased fertility of the humus substrate and consequent vegetation replacement by less demanding species, and/ or its further complete disappearance. From the geochemical aspect, this process correlates with iron chemical reduction from the immobile Fe3+ to the very mobile Fe2+ (see 2.2.2 Remote Sensing – ASTER), with the latter being evacuated by the surface water flows.
These processes were described in detail by Sukhanova , explaining chemical relationships between the natural hydrogen degassing process and soil fertility degradation. Our discussions with the local land users describing the sequence of events in a rather similar way confirm this conceptual view.
Within the area of this study, these processes resulted in poor soil qualities and fast erosion of fertile layers, which in some cases caused the sand blows to form (see 2.2.4 Geomorphology).
2.2.9. Mineral Associations and Alterations
This dataset is useful for identification of natural hydrogen flows’ interaction with the host rocks, as well as for determining its most probable migration paths. However, mineral associations related to hydrogen metasomatism are still poorly understood.
The desk-top study of the mineral associations across the area of research was based on data available from the open sources. GeoVIEW.WA provides quite a comprehensive data set on this subject. Another set of petrology and lithology data is provided by the Western Australia Rocks (WAROX) platform, also available through GeoVIEW.WA.
Several mineralogy aspects were taken into consideration:
(i). Alkali Minerals
In particular, we would like to review the process of mineral phases’ formation with nSiO2⋅mH2O, K, Na, and Ca. It is suggested that excessive chemical elements, such as Si, Ca, Na, and K, vacate the reaction zone of hosting rocks, being assisted by the natural hydrogen degassing streams.
Additionally, iron Fe and magnesium Mg are expelled from the system. This applies primarily to pyroxenes, amphiboles, micas, etc.
Potassium K and sodium Na vacate the reaction zone in the form of soluble compounds, or alkalis (KOH and NaOH). This is why hydrogen is often associated with hyperalkaline water sources (pH > 10) . Ultimately, alkali metals end up as halite (NaCl) and sylvite (KCl) salt deposits in water streams and circular depressions along the river valleys, which quite often are tracked down as permeable zones.
The area of research presents a substantial number of examples of streams and circular depressions, sometimes referred to as playa lakes, demonstrating the abundance of halite NaCl both in water and, when dried, in surface deposits. According to the local land users, in some of the originally fresh lakes, the water turns salty within several years to several decades, as mentioned above (see 2.2.4 Geomorphology).
Calcium Ca, most likely vacating the reaction zone in the form of hydroxide Ca(OH)2, terminates its migration path nearby, depositing in the form of calcite (CaCO3) or gypsum (CaSO4·2H2O). The distribution of the latter is covered quite well on the GeoVIEW. WA ASTER layer.
Within the area of research, there are several occurrences of limestone CaCO3, bentonite (Na, Ca)0.33(Al, Mg)2Si4O10(OH)2·nH2O and saponite Ca0.25(Mg, Fe)3((Si, Al)4O10)(OH)2·n(H2O) actively mined in the area. The example presented in Figure 21 demonstrates the abundance of these minerals in the Pinjarrega area. The reason for this is perfectly explained by redox balances change (pH values drop) from alkaline to more acidic due to their cooling and oxygen saturation while migrating from deeper to shallow depths .
Notably, according to the Watheroo Minerals PTY LTD geochemical assays data , soil samples demonstrate levels of pH in the alkaline range between 8.2 and 9.4.
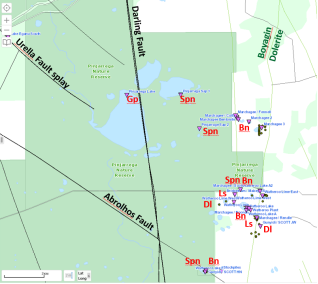
Figure 21. Mineral deposits and occurrences around Pingarrega Lake, AOI. Gp − gypsum, Spn − saponite, Dl − dolomite, Bn − bentonite, Ls − limestone. Mineralization locations shown in reversed magenta triangles, Company Surface Sample Geochemistry locations shown in green dots. Modified from GeoVIEW.WA https://geoview.dmp.wa.gov.au/. The legend is available from the source.
It is important to emphasize that stratigraphically, the carbonate deposits mined by Watheroo Minerals PTY LTD are located on the craton flank of the Darling Fault, therefore it would be rather difficult to link their origin to the sedimentary lithification processes such as diagenesis etc. Apparently, other mechanisms shall be suggested for these deposits’ formation processes.
(ii). Silicon (Si) Minerals
As for Silicon Si, it may migrate from the reaction zone, as we believe, in the form of polysilicic acids of the nSiO2⋅mH2O composition, which decompose with forming an aqueous SiO2 gel, the further fate of which may vary from case to case. This may be explained by the following process: With a decrease in the temperature of hydrothermal solutions, normal quartz often turns into cryptocrystalline and chalcedony, and is often accompanied by the deposition of chalcedony or even opal . Thus, depending on the conditions, the setting silica gel may turn into opals, as in Coober Pedy Opal Fields, where they are closely associated with kaolinite .
In other conditions, hydrous silica gel forms layers, concretions and nodules of chert, often observed at the contact of Cretaceous and Palaeogene rocks, e.g., in the Negev Desert in Israel or on the Sinai Peninsula in Egypt. The appearance of cherts at the turn of geological epochs becomes understandable if we take into account the catastrophic nature of the planet's structure reshaping, which occurred with the active participation of hydrogen, tied with these events’ timelines.
In some cases, Si-gel vacating the hydrogen metasomatism zone crystallizes in the form of small quartz (SiO2) crystals. Sometimes the product sand consists of perfect crystals shaped as semi-rounded transparent or translucent grains of similar sizes, observed in the sand deposits.
In the area of research, Quartz and Silica layers in ASTER demonstrate abundant occurrences of these minerals, for examples in Figure 13e and 13f, correspondingly (see 2.2.3 Remote Sensing – ASTER). Not surprisingly, there is a significant number of mining companies exploring and developing these mineral resources nearby the area of research. One of them, the Moora Mine operated by Simcoa (Figure 22), produces silicone aggregates of the highest purity some 4 to 5 km ENE of the anomalously high soil gas H2 reading.
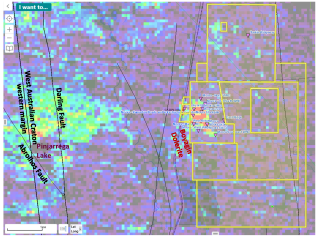
Figure 22. Moora Mine, Simcoa Mines Pty Ltd (Cairn Hills, WA). Mineralization locations shown in reversed magenta triangles, Simcoa tenements shown in yellow rectangles. Modified from GeoVIEW.WA https://geoview.dmp.wa.gov.au/. The legend is available from the source.
We are still a long way from understanding the reasons why silica-gel forms quartz in some settings and chalcedony, opal or chert in others.
2.2.10. Heat Flow Studies
Outside the geothermal energy domain, the heat flow subject is not broadly discussed by the academia and the industry. In our opinion, however, it is closely related to the natural hydrogen degassing process when viewed through the prism of the PHE concept . According to this concept, intermetallic/silicide wedges protruding into the crust through the deep faults and rifting zones (Figure 17) are supposed to be colder than suggested by the existing mainstream model. In this regard, the unconventionally low values of geothermal parameters for Barberton-1 well (Figure 23) may be explained by its proximity to the Darling fault with the latter providing the cooling effect due to the presence of intermetallic silicides approaching the surface through the Proto-Darling palaeo-tectonic structure. A similar effect is observed in other parts of the world. For instance, the Baikal continental rifting system is famous for its extremely low heat flow values, resulting in permafrost zone expanding to the south for significant distances . Another, a very well known, example of the (relatively) low heat flow value is set by Eureka Low area in Nevada, USA, where a <60 mW m-2 to <45 mW m-2 area is sitting right in the middle of the Great Basin province demonstrating the average values between 90 mW m-2 and >100 mW m-2.
Overall, data available for the bulk of the Australian continent is not too convincing in terms of the mainstream model applicability.
A very comprehensive research of the Perth Basin geothermal potential done by Hot Dry Rocks in 2008 demonstrated that the subject modeling performed through the prism of existing mainstream concept is not confirmed by the practical values received from the wells drilled in the area. Specifically, Barberton-1 well which is the closest to the Darling Fault, some 3.5km W of it, was supposed to show the highest geothermal parameters i.e., heat flow and thermal gradient, against the other wells in the Perth Basin. Instead, this well demonstrated “low geothermal gradient for the area, 1.95°C/100m. <…> The geothermal gradient for the Barberton structure compares with approximately 2.41°C/100m for Cypress Hill No.1, 2.06°C/100m for Gingin No.1, 2.37°/100m for Walyering No.l, 2.20°C/100m for Warro No.l, and 2.47°C/100m for Yallallie No.1.” .
According to Mory and Iasky , the thermal gradient for Barberton-1 well is even lower: 1.8°C/100m.
Barberton-1 well geothermal parameters’ comparison with other wells drilled in the Perth Basin are shown in Figure 23.
Figure 23. Geothermal parameters of Barberton-1 well (blue circle) compared to the offset wells drilled in the Perth Basin. Heat flow values in mW/m2 in blue numbers, thermal gradient in °C/100m in red numbers. Data compiled from https://portal.ga.gov.au, Hot Dry Rocks Pty Ltd., 2008 and Mory and Iasky .
The geothermal chart for Barberton-1 well demonstrates the extreme deviation of the actual heat flow value of 64mW/m2 from the modelled ones, see Figure 24. The significant number of geothermal parameter deviations from the model for the area resulted in dubbing this misfit data as “low quality” and therefore disregarding it, see p. 28 of the Hot Dry Rocks Report .
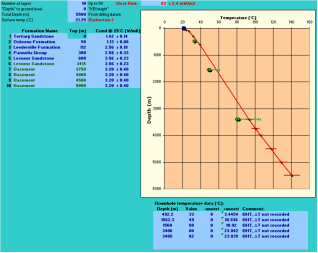
Figure 24. Barberton-1 well heat flow depth chart. The model shown in solid red line, the actual heat flow values in green dots. From Hot Dry Rocks, 2008. https://geodocsget.dmirs.wa.gov.au/api/GeoDocsGet?filekey=1dcd69da-255b-4fef-b741-e274252c02f7-9beg4fuf54nadxivun5ih10l1ogs3wopgiti1yin
Apparently, this list of discrepancies calls for a new approach. In this regard, the PHE concept explains the majority of dilemmas and paradoxes accumulated by fundamental geoscience, which otherwise appear to remain unresolved by means of the existing mainstream model.
3. Instrumentation Used
3.1. Shallow Soil Gas Detection
In this research, Industrial Scientific’s iBRID MX6 https://www.indsci.com/en/gas-detectors/multi/mx6-ibrid portable gas detection unit was used, equipped with the following sensors:
Hydrogen H2 0 - 2,000ppm
Carbon Monoxide CO 0 – 1,000ppm
Methane CH4 0 – 5%vol
Hydrogen Sulfide H2S 0 – 500ppm
MX6 hydrogen sensing technology is based on the electrochemical principle , providing a readily available off-the-shelf solution, offering an easily repairable, standardized gas detection and measurement device for the initial field research. Additionally, hydrogen sensor cross-sensitivity with CO sensor was used to pick up the early signs of hydrogen, especially in the situations when such shows were weak and momentary.
However, with time, our research group realized the need for a more advanced technologies, such as PORTaHY-FR-9%-BNP solid-state based hydrogen detector https://www.multinanosense.com/portahyfr9-portable-hydrogen-detectors, operating within the first digit percent (9.99%), sourced from Multi-Nano Sense Ltd. (Nagpur, India). Later, the company procured the VG-7M Metal-Insulator-Semiconductor (MIS) based hydrogen detector https://sensor.mephi.ru/vg_3x.htm detecting hydrogen within the range of the first digit ppm (X.Xppm) through 1% H2, sourced from the Moscow Engineering Physics Institute (MEPhI) (Moscow, Russia).
Overall, over 1,000 unique soil gas readings were taken from 40 locations within the period of 2021 – 2022 within the area of research.
3.2. Soil Gas Samples - Isotube®
Whenever the field operation situation allowed, soil gas samples were taken into the Isotube® gas tight containers. These samples were tested by the independent lab located in the greater Perth area, Western Australia.
3.3. Soil Gas Extract Headspace Samples - GC
1) Seventeen soil samples were collected from the shallow (9m to 15m deep) mechanically drilled boreholes in order to perform gas chromatography assays. For this purpose, the mobile drilling rig on Hino truck chassis was contracted. Upon shipping to the Company premises, these samples were de-gassed in the Company’s lab using the proprietary gas desorption technique, in order to obtain headspace gas extracts, which were then run through Agilent’s Mobile Micro GC 990 https://www.agilent.com/en/product/gas-chromatography/gc-systems/990-micro-gc-system/990-micro-gc-express calibrated against the standard gas mix containing 2% H2 in atmospheric air.
2) Additionally, sixteen soil samples were collected from the depths between 1m and 2m, from the boreholes drilled with manual cordless electric-powered auger kit. Similarly to 3.3.1., these samples were de-gassed with the headspace gas extracts obtained then run through Agilent’s Mobile Micro GC 990.
4. Results
The results obtained in the course of the AOI study are very much in agreement with the views expressed earlier : natural hydrogen degassing activity is closely related to the major tectonic and structural features, as well as the local plutonic bodies’ contact and alteration zones. The process of searching for these structures conducting natural hydrogen to the surface involves a thorough analysis of the datasets listed above, then prioritizing them in the order of their importance in the context of local geology, petrology, current tectonic activity regime and other factors described in this paper.
4.1. Soil Gas Readings
Out of over 1,000 shallow (<1m) soil gas readings taken in the field, the three exceeded 2,000ppm – the MX6 H2 sensor detection limit, establishing all-Australia records for the soil depths <1m, from the published data available at the time of writing this paper. Other readings in excess of the natural background were registered on almost every location selected for the campaign, which supports the early exploration strategy developed based on the desktop study results. However, the majority of the readings from the locations where natural hydrogen emanations were not expected, based on the results of the preliminary study of the area (see 2. Desktop Study), have shown zero ppm H2, expectedly representing the natural background for the areas with no degassing activity. Similarly, for the locations with loose soil substrates such as unconsolidated sands, the obtained H2 readings were at zero ppm, despite the theoretical probability of degassing potential in place, since hydrogen does not reside in such conditions, instead emitting freely into the atmospheric air.
Soil gas readings represent the level of mobile hydrogen flow through the structure, which tends to fluctuate depending on the time of the day, current moon phase and season of the year . In our case, the presence and the intensity of the detected hydrogen concentrations in the near-surface soil layers directly correlated with:
1. Structural features: systems of faults and shear zones, as per Vidavskiy, Rezaee, 2022
2. Tectonic regime and activity magnitude
3. Crystalline basement proximity
4. Geomorphological features: fault valleys, circular depressions, upwelling hills, sand blows a.k.a. injectites, etc.
5. Soil substrate type and properties, in accordance with micro-lithology, redox balances and pH levels
6. MT data revealing conductive structures nearby
7. Satellite imagery data – to the semi-quantitative levels, i.e., to the order of magnitude.
8. Other factors influencing the process, as described above.
The specific locations and readings for H2 and associated gases are available upon request from Macallum New Energy LTD.
4.2. Isotube® Soil Gas Samples
Several samples were obtained from the soil gas detection stations, where the circumstances allowed. These samples, stored in the Isotube® gas tight containers, were shipped for testing to the Intertek lab in Perth, WA, where they were degassed in the gas chamber and fed into the gas chromatograph Agilent 7890A with 4x columns. In general, the GC test results correlated with the soil gas detection program outcome for each particular area. To our pleasant surprise, one of the samples taken in the area of the first tier deep-reaching fault showed a substantial level of helium exceeding 8,000ppm, which shall be addressed in the course of further research.
The specific locations and readings for H2 and associated gases are available upon request from Macallum New Energy LTD.
4.3. Gas Chromatography
Thirty three soil samples from the depths of 1m to 15m were obtained and analyzed. The specific locations and readings for H2 and associated gases are available upon request from Macallum New Energy LTD.
The results ranged from fractions of per cent to the all-Australia record of 58.27% (norm.) of hydrogen in the gas mix from 15m. The tests are still being conducted.
The background soil sample taken from shallow (<1m) depth outside of the anticipated anomaly area and tested using the same procedure showed zero H2.
The results obtained through the GC tests of the headspace soil gas extracts confirmed the conclusions of the desktop study and the soil gas sampling campaign. As a result, the new structure potentially prospective for natural hydrogen was identified and preliminarily outlined.
The decision is made to continue with the shallow soil sampling exercise at the areas preliminarily selected by means of a thorough study of the datasets.
The H2 anomalies outlined by means of the abovementioned methods are recommended to be included in the Company’s portfolio for future natural hydrogen licensing applications.
5. Conclusions
Based on the extensive research, we come to the conclusion that the Proto-Darling Fault is not just a part of the modern Darling Fault footwall but rather an individual structure of regional proportions, approx. 30km wide . It was established in Neoarchaean some 2.6Ba . However, despite its age, the observed signs of the most recent tectonic activity are directly related with this structure .
This phenomenon has to be assessed as a complex subject. From the MT survey results (see 2.2.6 Conductivity Data), we are aware of the major conductive structure marking the Darling and the Proto-Darling faults (Figs. 21 and 22). On the other hand, Barberton 1 deep well drilled in the close proximity to the Darling Fault demonstrates heat flow values below average for the Perth Basin and, allegedly, the lowest thermal gradient in the entire Perth Basin (Figure 23) – at least from the data available on the date of submitting this paper.
Based on the PHE concept, we may suggest that the Proto-Darling Fault zone is formed by the intermetallic wedge protrusion, in effect causing the loss of seismic signal combined with high conductivity and low values of geothermal parameters.
The manifestations of deep tectonic and geochemical activities associated with the Proto-Darling Fault are expressed through the number of conduits and communication channels, including but not limited to, the major structural features such as the modern Darling Fault and the shear zone associated with it, as well as the Urella and the Muchea faults; certain parts of the Abrolhos and the Cervantes faults; several dykes and other discordant igneous bodies approaching the surface in the area. These manifestations, among others, include the very well pronounced signs of natural hydrogen degassing activity, along with other associated gases: CH4, He, CO, N2, Rn, etc.
The likelihood of finding natural hydrogen manifestations on the surface within such localities is supported by a number of factors justifying their probability, including but not limited to the possible conduit formations’ conductivity, redox balances, geomorphological impressions, geochemical compositions and mineral associations – including those occurring in connection with the original hosting rocks’ alterations. Together, these factors form deep-seated natural hydrogen degassing systems. Indeed, such systems shall be analyzed with consideration of the immediate circumstances at the surface, such as topographical micro-relief and shallow tectonics, soil types and their combinations as well as pH levels, etc. The bottom-up approach shall be combined with the ability to evaluate these systems with the time coordinate involved, including the most recent evolution of landscape, hydrogeology and hydrography.
It is quite obvious from our observations and instrumental readings that the natural hydrogen degassing process is closely – if not directly – associated with structural features and tectonic activity in the area, which very well aligns with our earlier research . First tier structural elements such as deep reaching faults and shear zones, along with intrusive bodies rooting into the deep parts of the lithosphere, are likely to conduct deep-seated natural hydrogen, supposedly from the mantle and/or from the core . Closer to the surface, hydrogen gas tends to be conducted by the most weakened structural elements, e.g., second and third tier faults as well as other confined zones with lower values of lithostatic pressure and steeper dip gradients.
Herewith we stipulate that the outcomes of the Desktop Study based on the Primordially Hydridic Earth concept postulates supported by the fundamental lab research, correlate extremely well with the practical results of both the analytical assays and the field exploration work.
Abbreviations

ANT

Ambient Noise Tomography

AOI

Areas of Interest

ASTER

Advanced Spaceborne Thermal Emission and Reflection

ATZ

Abrolhos Transfer Zone

Ba

Billion Years

BIF

Banded Iron Formation

Bn

Bentonite

°C

Degree Centigrade (Celsius)

CGH

Coorow – Green Head (Magnetotellurics Transect)

CREDIT (taxonomy)

Contributor Roles Taxonomy

CSIRO

The Commonwealth Scientific and Industrial Research Organisation

DFZ

Darling Fault zone

Dl

Dolomite

En

Enstatite

ENE

East North-East

ESE

East South-East

Fo

Forsterite

GA

Geoscience Australia

GC

Gas Chromatography

Gp

Gypsum

H2

Hydrogen Gas (Molecular)

IC

Inner Core

Ls

Limestone

LTD

Limited

Ma

Million Years

MEPhI

Moscow Engineering Physics Institute

MIS

Metal-Insulator-Semiconductor

MOR

Mid-Ocean Ridge

MT

Magnetotellurics

mW/m2

Milli Watt per Square Meter

N

North

NE

North-East

NN

New Norcia (Magnetotellurics transect)

NNE

North North-East

norm.

Normalized

NT

the Northern Territory

NW

North-West

Ol

Olivine

OT

Optical Turbulence

PHE

Primordially Hydridic Earth

PhD

Philosophy Doctor

ppm

Parts Per Million

PTY LTD

Proprietary Limited

Px

Pyroxene

Redox

Reduction / Oxidation

S

South

SARIG

South Australian Resource Information Gateway

SE

South-East

Spn

Saponite

Srp

Serpentine

SSW

South South-West

SW

South West

Th

Thorium

U

Uranium

UV

Ultraviolet

UF

Muchea Fault

USA

United States of America

W

West

WA

Western Australia

WAC

Western Australian Craton

WNW

West North-West

XRD

X-ray Diffraction

WAROX

Western Australia Rocks

Acknowledgments
The authors would like to express their appreciation to the proprietors and managers of Macallum New Energy Ltd., a subsidiary of Macallum Group Limited, a privately funded resources company based in Perth, Western Australia – Without their generosity and credit of trust, this research would be impossible. The authors are grateful to the personnel of the Curtin University headquartered in Bentley, Western Australia, for their support, mind openness towards the variety of scientific concepts, and the ability to establish an atmosphere of free discussion and academic creativity.
Author Contributions
Vitaly Vidavskiy: Conceptualization, Formal Analysis, Investigation, Methodology, Writing – original draft, Writing – review and editing;
Reza Rezaee: Data curation, Project administration, Supervision, Writing – review and editing;
Nikolay Larin: Conceptualization, Formal Analysis, Investigation, Methodology, Writing – original draft, Writing – review and editing;
Rance Dorrington: Resources, Data curation, Project administration, Supervision, Validation;
Martin Spivey: Resources, Visualization, Data curation, Validation;
Vladimir Vidavskiy: Data curation, Visualization
Funding
This work was entirely and exclusively funded by Macallum New Energy Ltd., a subsidiary of Macallum Group Limited, a privately funded resources company based in Perth, Western Australia. The Curtin University of Technology contributed materially through assigning its personnel time and assets available in the process of conducting this research.
Data Availability Statement
All factual and numerical data is available upon request from Macallum New Energy Ltd. https://www.macnewenergy.com.au/, a subsidiary of Macallum Group Limited, a privately funded resources company based in Perth, Western Australia.
Conflicts of Interest
The authors declare no conflicts of interest.
References
[1] Buck, W. R. (1991). Modes of continental lithospheric extension. Journal of Geophysical Research: Solid Earth, 96(B12), 20161–20178.
[2] Condie, K. C. (1982). Plate tectonics and continental drifts. Pergamon Press, Oxford.
[3] Cudahy, T. (2012). Satellite ASTER Geoscience Product Notes for Australia. Citeseer. Retrieved from
[4] Debacker, T., Connors, K., Pryer, L., Blevin, J., Henley, P., & Shi, Z. (2021). Northern Territory SEEBASE® and GIS December. Retrieved from
[5] Dentith, M. C., Bruner, I., Long, A., Middleton, M. F., & Scott, J. (1993). Structure of the Eastern Margin of the Perth Basin, Western Australia. Exploration Geophysics, 24(3–4), 455–461.
[6] Dentith, M, Long, A., Scott, J., & Bruner, I. (1994). The geometry and phanerozoic history of the Darling Fault and associated structures in the Perth Basin. Perth, WA. Retrieved from
[7] Dentith, Mike, Evans, S., Thiel, S., Gallardo, L., Joly, A., & Romano, S. S. (2013). A magnetotelluric traverse across the southern Yilgarn Craton. Geological Survey of Western Australia.
[8] Dutkiewicz, A., Landgrebe, T. C. W., & Rey, P. F. (2015). Origin of silica and fingerprinting of Australian sedimentary opals. Gondwana Research, 27(2), 786–795.
[9] Frery, E., Langhi, L., Mainson, M., & Moretti, I. (2021). Natural hydrogen seeps identified in the North Perth Basin, Western Australia. International Journal of Hydrogen Energy, 46(61), 31158–31173.
[10] Friedlieb, O., Featherstone, W., & Dentith, M. (1997). A WGS84-AHD Profile over the Darling Fault: Western Australia. Geomatics Research Australasia, 67, 17–32. Retrieved from
[11] Geognostics Australia Pty Ltd. (2022). Perth Basin SEEBASE structural study and GIS.
[12] Gorbova, E., Balkourani, G., Molochas, C., Sidiropoulos, D., Brouzgou, A., Demin, A., & Tsiakaras, P. (2022). Brief Review on High-Temperature Electrochemical Hydrogen Sensors. Catalysts.
[13] Harris, L. B. (1994). STRUCTURAL AND TECTONIC SYNTHESIS FOR THE PERTH BASIN, WESTERN AUSTRALIA. Journal of Petroleum Geology, 17(2), 129–156.
[14] Haynes, M. W. (2021). A Bayesian Reappraisal of Australian Crustal Heat Flow and Temperature. The Australian National University (Australia).
[15] He, Y., Sun, S., Kim, D. Y., Jang, B. G., Li, H., & Mao, H. (2022). Superionic iron alloys and their seismic velocities in Earth’s inner core. Nature, 602(7896), 258–262.
[16] Heidbach, O., Rajabi, M., Reiter, K., & Ziegler, M. (2016). World Stress Map 2016. Retrieved from
[17] Hillis, R., & Reynolds, S. (2000). The Australian Stress Map. Journal of the Geological Society, 157(5), 915–921.
[18] Hoskin, T. (2017). Assessment of the North Perth Basin for geothermal resources using an integrated geophysical approach. PhD Thesis, the University of Western Australia.
[19] Hoskin, T., Regenauer-lieb, K., & Jones, A. (2015). A Magnetotelluric survey of the North Perth Basin: A technical case study. ASEG Extended Abstracts, 2015(1), 1–4.
[20] Hoskin, T., Regenauer-Lieb, K., & Jones, A. (2015). Deep conductivity anomaly of the Darling Fault Zone - implications for fluid transport in the Perth Basin. ASEG Extended Abstracts, 2015.
[21] Hot Dry Rocks Pty Ltd. (2008). Geothermal energy potential in selected areas of Western Australia (Perth Basin). Hot Dry Rocks Pty Ltd Melbourne, Australia.
[22] Hurst, A., Scott, A., & Vigorito, M. (2011). Physical characteristics of sand injectites. Earth-Science Reviews, 106(3), 215–246.
[23] Ikuta, D., Ohtani, E., Sano-Furukawa, A., Shibazaki, Y., Terasaki, H., Yuan, L., & Hattori, T. (2019). Interstitial hydrogen atoms in face-centered cubic iron in the Earth’s core. Scientific Reports, 9(1), 7108.
[24] Jones, A. G. (1992). Electrical conductivity of the continental lower crust. Continental Lower Crust, 81–143.
[25] Kennett, B. L. N., Chopping, R., & Blewett, R. (2018). The Australian Continent: A Geophysical Synthesis. ANU Press and Geoscience Australia, Canberra.
[26] Lambeck, K., McQueen, H. W. S., Stephenson, R. A., & Denham, D. (1984). The state of stress within the Australian continent. In Annales geophysicae (1983) (Vol. 2, pp. 723–741). Paris.
[27] Larin, V., & Larin, N. (2007). Hydrogen seeps have been discovered in the central area of the Russian Platform. Retrieved from
[28] Larin, V. N. (1975). Hypothesis of a Primordially Hydridic Earth. Moscow: Academy of Science of the USSR, the Ministry for Geology of the USSR, IMGRE. Retrieved from
[29] Larin, V. N. (1980). Hypothesis of a Primordially Hydridic Earth, 2nd ed. (2nd ed.). Moscow: Nedra. Retrieved from
[30] Larin, V. N. (1993). Hydridic Earth: The New Geology of Our Primordially Hydrogen-Rich Planet. (W. Hunt, Ed.). Calgary: Polar Publishing. ark:/13960/t1ng6db6d ISBN-10: 0969450621, ISBN-13:‎978-0969450627
[31] Larin, V. N. (2005). Our Earth. Moscow: Agar. Retrieved from
[32] Lee, M., Mikula, P., Mollison, L., & Litterbach, J. (2008). Stresses in the Australian continental tectonic plate-variability and likely controls. In Presentation to the Australian Earthquake Engineering Society Annual Meeting, Ballarat, VIC.
[33] Lord, O. T., Walter, M. J., Dobson, D. P., Armstrong, L., Clark, S. M., & Kleppe, A. (2010). The FeSi phase diagram to 150 GPa. Journal of Geophysical Research: Solid Earth, 115(B6).
[34] Merle, O. (2011). A simple continental rift classification. Tectonophysics, 513(1), 88–95.
[35] Middleton, M. F., Wilde, S. A., Evans, B. J., Long, A., Dentith, M., & Morawa, M. (1995). Implications of a geoscientific traverse over the Darling Fault Zone, Western Australia. Australian Journal of Earth Sciences, 42(1), 83–93.
[36] Middleton, M., Wilde, S., Evans, B., Long, A., & Dentith, M. (1993). A Preliminary Interpretation of Deep Seismic Reflection and other Geophysical Data from the Darling Fault Zone, Western Australia. Exploration Geophysics - EXPLOR GEOPHYS, 24.
[37] Miller, H. M., Matter, J. M., Kelemen, P., Ellison, E. T., Conrad, M. E., Fierer, N., Ruchala T., Tominaga M., Templeton, A. S. (2016). Modern water/rock reactions in Oman hyperalkaline peridotite aquifers and implications for microbial habitability. Geochimica et Cosmochimica Acta, 179, 217–241.
[38] Molloy, F. (2023). Velocity models of Australia’s crust – using seismic data to image deeper earth. Retrieved from
[39] Mory, A. J., & Iasky, R. P. (1996). Stratigraphy and structure of the onshore northern Perth Basin, Western Australia (Vol. 46). Geological Survey of Western Australia.
[40] Mory, Arthur, Haig, D., Mcloughlin, S., & Hocking, R. (2005). Geology of the northern Perth Basin, Western Australia. A field guide. Geological Survey of Western Australia Record (Vol. 2005/9). ISBN 1 74168 011 5
[41] Newport, C. (2020). L14 North Perth Basin Farmout & Production Investor Pack. Perth, WA. Retrieved from
[42] Poort, J., & Klerkx, J. (2004). Absence of a regional surface thermal high in the Baikal rift; new insights from detailed contouring of heat flow anomalies. Tectonophysics, 383(3–4), 217–241.
[43] Prinzhofer, A., Rigolett, C., Berthelot, J., & Francolin, J. (2022). Gamma spectrometry as the best proxy for hydrogen exudations. In 1st Natural Hydrogen Worldwide Summit.
[44] Rajabi, M., Tingay, M., Heidbach, O., Hillis, R., & Reynolds, S. (2017). The present-day stress field of Australia. Earth-Science Reviews, 168, 165–189.
[45] Razumova, V. N. (1977). Ancient weathwring rinds and geothermal process. Moscow, Nauka, The Academy of Sciences of the USSR, Issue 303
[46] Reynolds, S., Coblentz, D., & Hillis, R. (2002). Tectonic forces controlling the regional intraplate stress field in continental Australia: Results from new finite element modeling. J. Geophys. Res., 8150.
[47] Rezaee, R. (2021). Assessment of natural hydrogen systems in Western Australia. International Journal of Hydrogen Energy, 46(66), 33068-33077.
[48] Rezaee, R. (2020). Natural Hydrogen System in Western Australia?
[49] Rohrbach, A., Ballhaus, C., Ulmer, P., Golla-Schindler, U., & Schoenbohm, D. (2011). Experimental Evidence for a Reduced Metal-saturated Upper Mantle. J. Petrol., 52, 717–731.
[50] Schwarz, U. (2004). Metallic high-pressure modifications of main group elements, 219(6), 376–390.
[51] Selway, K. (2014). On the Causes of Electrical Conductivity Anomalies in Tectonically Stable Lithosphere. Surveys in Geophysics, 35(1), 219–257.
[52] Shestopalov, V. M., Koliabina, I. L., Ponomarenko, O. M., Lukin, A. Ye., Rud, А. D. (2022). Thermodynamic assessment of the possibility of olivine interaction with deep-seated hydrogen. International Journal of Hydrogen Energy, 47(2022), 7062 - 7071.
[53] Song, T., & Cawood, P. A. (2000). Structural styles in the Perth Basin associated with the Mesozoic break-up of Greater India and Australia. Tectonophysics, 317(1), 55–72.
[54] Stevenson, D. J. (1977). Hydrogen in the Earth’s core. Nature, 268(5616), 130–131.
[55] Sukhanova, N., Larin, N., & Kiryushin, A. (2014). Influence of endogenous hydrogen flux on chemical properties of soil. Geopolitics and Ecogeodynamics of Regions. Periodical Publication of the Taurida National University Named after V.I. Vernadsky, 10(1), 214–220. Retrieved from http://geopolitika.crimea.edu/arhiv/2014/tom10-v-1/036suzanova.pdf
[56] Syvorotkin, V. L. (2013). Ozone Method for Earth Hydrogen Degassing Study (rus). Electronic Scientific Edition Almanac Space and Time, 4(1).
[57] Tagawa, S., Sakamoto, N., Hirose, K., Yokoo, S., Hernlund, J., Ohishi, Y., & Yurimoto, H. (2021). Experimental evidence for hydrogen incorporation into Earth’s core. Nature Communications, 12(1), 2588.
[58] Varon, D. J., Jervis, D., McKeever, J., Spence, I., Gains, D., and Jacob, D. J.: High-frequency monitoring of anomalous methane point sources with multispectral Sentinel-2 satellite observations, Atmos. Meas. Tech., 14, 2771–2785,
[59] Vidavskiy, V., & Rezaee, R. (2022). Natural Deep-Seated Hydrogen Resources Exploration and Development: Structural Features, Governing Factors, and Controls. Journal of Energy and Natural Resources, 11(3), 60–81.
[60] Wakamatsu, T., Ohta, K., Tagawa, S., Yagi, T., Hirose, K., & Ohishi, Y. (2022). Compressional wave velocity for iron hydrides to 100 gigapascals via picosecond acoustics. Physics and Chemistry of Minerals, 49(5), 17.
[61] Walshe, J., Hobbs, B., Ord, A., Regenauer-Lieb, K., & Barmicoat, A. (2005). Mineral systems, hydridic fluids, the Earth’s core, mass extinction events and related phenomena (pp. 65–68).
[62] WAPIMS. (1990). Barberton #1 well completion report. Retrieved from
[63] Watheroo Minerals Pty Ltd. (2010). Annual exploration report for Mining Lease M70/1184; M70/305 for period 8 November 2009 to 7 November 2010.
[64] Wilde, S. A., Nelson, D. R., Australia, G. S. of W., & Resources, W. A. D. of M. and P. (2001). Geology of the Western Yilgarn Craton and Leeuwin Complex, Western Australia: A Field Guide. Geological Survey of Western Australia.
[65] Williams, C. F., & Sass, J. H. (2006). Heat flow in Railroad Valley, Nevada and implications for geothermal resources in the south-central Great Basin. Geothermal Resources Council Transactions, 30, 111–116. ISSN: 0193-5933; ISBN: 0-934412-91-x
[66] Yurkova R. M. (1991) MINERAL TRANSFORMATIONS OF THE OPHIOLITE AND ASSOCIATED VOLCANIC-SEDIMENTARY COMPLEXES IN THE NORTHWESTERN PACIFIC FRINGING. The Academy of Sciences of the USSR, Order of the Red Banner of Labour Geological Institute, Transactions, Vol. 464, ISSN 0002-3272, ISBN 5-02-002159-8. Published by Nauka in Moscow, 1991, 166 pages.
[67] Zgonnik, V. (2020). The occurrence and geoscience of natural hydrogen: A comprehensive review. Earth-Science Reviews, 203(2020),
[68] Zhang, B., & Yoshino, T. (2017). Effect of graphite on the electrical conductivity of the lithospheric mantle. Geochemistry, Geophysics, Geosystems, 18(1), 23–40.
Cite This Article
  • APA Style

    Vidavskiy, V., Rezaee, R., Larin, N., Dorrington, R., Spivey, M., et al. (2024). Natural Hydrogen in the Northern Perth Basin, WA Australia: Geospatial Analysis and Detection in Soil Gas for Early Exploration. Journal of Energy and Natural Resources, 13(2), 90-113. https://doi.org/10.11648/j.jenr.20241302.15

    Copy | Download

    ACS Style

    Vidavskiy, V.; Rezaee, R.; Larin, N.; Dorrington, R.; Spivey, M., et al. Natural Hydrogen in the Northern Perth Basin, WA Australia: Geospatial Analysis and Detection in Soil Gas for Early Exploration. J. Energy Nat. Resour. 2024, 13(2), 90-113. doi: 10.11648/j.jenr.20241302.15

    Copy | Download

    AMA Style

    Vidavskiy V, Rezaee R, Larin N, Dorrington R, Spivey M, et al. Natural Hydrogen in the Northern Perth Basin, WA Australia: Geospatial Analysis and Detection in Soil Gas for Early Exploration. J Energy Nat Resour. 2024;13(2):90-113. doi: 10.11648/j.jenr.20241302.15

    Copy | Download

  • @article{10.11648/j.jenr.20241302.15,
      author = {Vitaly Vidavskiy and Reza Rezaee and Nikolay Larin and Rance Dorrington and Martin Spivey and Vladimir Vidavskiy},
      title = {Natural Hydrogen in the Northern Perth Basin, WA Australia: Geospatial Analysis and Detection in Soil Gas for Early Exploration
    },
      journal = {Journal of Energy and Natural Resources},
      volume = {13},
      number = {2},
      pages = {90-113},
      doi = {10.11648/j.jenr.20241302.15},
      url = {https://doi.org/10.11648/j.jenr.20241302.15},
      eprint = {https://article.sciencepublishinggroup.com/pdf/10.11648.j.jenr.20241302.15},
      abstract = {The scope of this work is to empirically check and prove the practical applicability of the Primordially Hydridic Earth (PHE) concept for early exploration of the resources of naturally occurring hydrogen. With the PHE concept postulates interpreted within the local geological, tectonic, petrological and geophysical context, the reconnaissance plan, as well as the field exploration and data acquisition programs, were put together and implemented in the field. The results obtained from the surface (2, including three samples with a concentration of hydrogen exceeding the gas sensor detection limit of 2,000 parts per million (ppm) (the all-Australia record). Similarly, several of the shallow soil samples used for obtaining headspace gas extracts yielded dozens % H2, which was established utilizing Gas Chromatography (GC) technology. The latter tests established the all-Australia record of 58.3% (norm.) H2 concentration from 15 m depth, being the highest reading from the area of research. At one location, a concentration of He exceeding 8,000ppm was detected in a 1m surface soil gas sample analyzed by the independent lab. The most important outcome was finding natural hydrogen where it was expected and predicted. On the other hand, H2 concentrations exceeding the natural background of 1-3ppm were not detected in the soil gas readings outside of the areas identified using the PHE concept as a theoretical foundation. It may be stated that overall, the practical application of the PHE concept along with the thoroughly planned utilization of carefully selected exploration techniques brings satisfactory results.
    },
     year = {2024}
    }
    

    Copy | Download

  • TY  - JOUR
    T1  - Natural Hydrogen in the Northern Perth Basin, WA Australia: Geospatial Analysis and Detection in Soil Gas for Early Exploration
    
    AU  - Vitaly Vidavskiy
    AU  - Reza Rezaee
    AU  - Nikolay Larin
    AU  - Rance Dorrington
    AU  - Martin Spivey
    AU  - Vladimir Vidavskiy
    Y1  - 2024/06/25
    PY  - 2024
    N1  - https://doi.org/10.11648/j.jenr.20241302.15
    DO  - 10.11648/j.jenr.20241302.15
    T2  - Journal of Energy and Natural Resources
    JF  - Journal of Energy and Natural Resources
    JO  - Journal of Energy and Natural Resources
    SP  - 90
    EP  - 113
    PB  - Science Publishing Group
    SN  - 2330-7404
    UR  - https://doi.org/10.11648/j.jenr.20241302.15
    AB  - The scope of this work is to empirically check and prove the practical applicability of the Primordially Hydridic Earth (PHE) concept for early exploration of the resources of naturally occurring hydrogen. With the PHE concept postulates interpreted within the local geological, tectonic, petrological and geophysical context, the reconnaissance plan, as well as the field exploration and data acquisition programs, were put together and implemented in the field. The results obtained from the surface (2, including three samples with a concentration of hydrogen exceeding the gas sensor detection limit of 2,000 parts per million (ppm) (the all-Australia record). Similarly, several of the shallow soil samples used for obtaining headspace gas extracts yielded dozens % H2, which was established utilizing Gas Chromatography (GC) technology. The latter tests established the all-Australia record of 58.3% (norm.) H2 concentration from 15 m depth, being the highest reading from the area of research. At one location, a concentration of He exceeding 8,000ppm was detected in a 1m surface soil gas sample analyzed by the independent lab. The most important outcome was finding natural hydrogen where it was expected and predicted. On the other hand, H2 concentrations exceeding the natural background of 1-3ppm were not detected in the soil gas readings outside of the areas identified using the PHE concept as a theoretical foundation. It may be stated that overall, the practical application of the PHE concept along with the thoroughly planned utilization of carefully selected exploration techniques brings satisfactory results.
    
    VL  - 13
    IS  - 2
    ER  - 

    Copy | Download

Author Information
  • AVALIO Pty LTD., West Perth, Australia; Western Australian School of Mines, Curtin University of Technology, Bentley, Australia

  • Western Australian School of Mines, Curtin University of Technology, Bentley, Australia

  • Natural Hydrogen Energy Ltd. (NH2E), Denver, USA

  • Macallum New Energy Ltd./ Macallum Group Ltd., Applecross WA, Australia

  • Macallum New Energy Ltd./ Macallum Group Ltd., Applecross WA, Australia

  • Macallum New Energy Ltd./ Macallum Group Ltd., Applecross WA, Australia