Abstract
As an important means of CO2 geological storage leakage monitoring, resistivity monitoring technology is of great significance to the safety and stability of CCUS project. In order to study the electrical signal response rule of the evolution of CO2 saturation in the reservoir, a joint core displacement experiment system of electrochemical impedance analysis and microfocus X-ray CT was designed and constructed to simulate the process of CO2 displacement of brine in Berea sandstone cores under stratigraphic temperature and pressure conditions. The electrochemical impedance characteristics of the core-fluid system are analyzed by electrochemical impedance spectroscopy. The experimental results show that at lower temperature and pressure, it is more difficult for CO2 to invade the pore space occupied by the brine in situ, resulting in drastic changes in CO2 plane saturation along the displacement direction. With the increase of temperature and pressure, the CO2 saturation curve becomes smoother and the migration and displacement front becomes even. The Cole equivalent circuit model is used to describe the conduction mode of AC electrical signals inside the core, and the electrochemical impedance characteristic analysis focusing on the high frequency region shows that the system impedance increases with the increase of CO2 saturation, and decreases with the increase of scanning frequency. In addition, the changes of impedance characteristics in the electrochemical impedance spectroscopy not only reflect the pore structure characteristics of the core, but also reveal the evolution law of CO2 saturation in the porous medium. With the increase of CO2 saturation, the low pore space is gradually occupied by CO2, and the residual brine connectivity of the pore space as a conductive component decreases. The decrease of the internal conductive circuit leads to the rapid increase of the impedance, which is consistent with the change of resistance and capacitance when fitting the Cole equivalent circuit model.
Keywords
Tight Rocks, CO2 Sequestration, CO2 Saturation, X-ray CT, Electrochemical Impedance Spectroscopy
1. Introduction
The monitoring of CCUS is carried out throughout the storage process and after the storage is completed, and it is necessary to ensure the consistency between the injection volume and the storage volume during the injection phase
. After the completion of injection, real-time monitoring of cap closure, reservoir permeability, CO
2 leakage and transportation should also be deployed. Resistivity monitoring technology, as an important means of CO
2 geological storage leakage monitoring, plays a key role in the qualitative evaluation of CO
2 response characteristics within the reservoir. The principle of the resistivity monitoring technique is based on the difference in electrical conductivity of different substances, and the CO
2 injected into the reservoir in the geological storage project is usually regarded as an insulator, so its transport and saturation changes can be monitored by utilizing the property that resistivity is highly sensitive to CO
2-containing reservoirs.
The acquisition and interpretation of resistivity characteristics of reservoir rocks is an essential part of geophysical monitoring. The electrical characteristics of rocks are determined by the relative content of conductive minerals and the fluids contained in the rock body, and the factors affecting the resistivity of the rock body include the nature of the rock and the structure of the rock body, the nature of the fluids, and the pore connectivity. As an important physical property of rocks, with the development of geophysical monitoring technology, the use of rock resistivity inversion to assess rock and fluid properties has been widely used. In order to establish the connection between the resistivity monitoring index and the CO
2 storage state in the deep rock body, so as to facilitate the assessment of the underground CO
2 transport characteristics, scholars at home and abroad have carried out a series of researches on the resistivity characteristics of CO
2 injected into the rock body
| [2] | Caesary D, Kim J, Jang SJ, Quach N, Park C, Kim H-M, et al. Numerical modeling and evaluation of lab-scale CO2-injection experiments based on electrical resistivity measurements. Journal of Petroleum Science and Engineering. 2022, 208, 109788. https://doi.org/10.1016/j.petrol.2021.109788 |
[2]
.
Nakatsuka et al
| [3] | Nakatsuka Y, Xue Z, Garcia H, Matsuoka T. Experimental study on CO2 monitoring and quantification of stored CO2 in saline formations using resistivity measurements. International Journal of Greenhouse Gas Control. 2010; 4(2): 209-16. https://doi.org/10.1016/j.ijggc.2010.01.001 |
[3]
focused on the effect of clay content on the resistivity of CO
2-bearing rocks in their study using Archie's equation with resistivity index (RI) to estimate CO
2 saturation. Alemu
| [4] | Alemu B, Aker E, Soldal M, Johnsen Ø, Aagaard P. Effect of sub-core scale heterogeneities on acoustic and electrical properties of a reservoir rock: A CO2 flooding experiment of brine saturated sandstone in a computed tomography scanner. Geophysical Prospecting. 2013, 61, 235-50. https://doi.org/10.1111/j.1365-2478.2012.01061.x |
[4]
utilized a CT scanning device to perform experimental resistivity monitoring, using 3D volumetric images and fluid CT values to calculate porosity and CO
2 saturation of samples. Abdulrauf et al
| [5] | Adebayo A. An Experimental Investigation of the Use of Combined Resistivity and Temperature Logs for Scale Monitoring In Carbonate Formations During CO2 Sequestration. Journal of Energy Resources Technology, Transactions of the ASME. 2014, 137, 32202-32202. https://doi.org/10.1115/1.4028772 |
[5]
focused on the change in resistivity of formations under static conditions as well as changes in formation resistivity over longer time periods. Borner
| [6] | Börner J, Herdegen V, Repke J-U, Spitzer K. The electrical conductivity of CO2-bearing pore waters at elevated pressure and temperature: A laboratory study and its implications in CO2 storage monitoring and leakage detection. Geophysical Journal International. 2015, 203, 1072-84. https://doi.org/10.1093/gji/ggv331 |
[6]
et al focused on the effect of CO
2 on pore water resistivity at different thermodynamic equilibria in a clay-free environment. Bosch et al. performed laboratory-scale resistivity monitoring of CO
2 injected into a brackish water formation and showed that the increase in resistivity was related to CO
2 enrichment and CO
2 dissolution in low-salinity brines. Nooraiepour et al
| [7] | Nooraiepour M, Bohloli B, Park J, Sauvin G, Skurtveit E, Mondol NH. Effect of brine-CO2 fracture flow on velocity and electrical resistivity of naturally fractured tight sandstones. Geophysics. 2017, 83(1), WA37-WA48. https://doi.org/10.1190/geo2017-0077.1 |
[7]
monitored resistivity by setting up different electrode positions for axial and radial resistivity. Abdulrauf et al
| [8] | Adebayo AR, Kandil ME, Okasha TM, Sanni ML. Measurements of electrical resistivity, NMR pore size and distribution, and x-ray CT-scan for performance evaluation of CO2 injection in carbonate rocks: A pilot study. International Journal of Greenhouse Gas Control. 2017, 63, 1-11. https://doi.org/10.1016/j.ijggc.2017.04.016 |
[8]
measured resistivity continuously in the low frequency range using 2-electrode and 4-electrode arrays. The results indicate that for accurate resistivity measurements the 4-electrode technique should be used. In summary, existing domestic and international studies on rock resistivity characterization in the context of CO
2 geological sequestration mostly focus on verifying resistivity applicability and are devoted to tracking CO
2 migration through the relative relationship between saturation and resistivity as a function of CO
2 sequestration process
| [9] | Bakhshian S, Hosseini SA, Lake LW. CO2-brine relative permeability and capillary pressure of Tuscaloosa sandstone: Effect of anisotropy. Advances in Water Resources. 2020, 135, 103464. https://doi.org/10.1016/j.advwatres.2019.103464 |
[9]
. The estimation of rock CO
2 saturation based on Archie's equation and resistivity index (RI) has been widely used, and studies have been carried out from various perspectives targeting the nature and structure of the rock mass, and the chemical reactions occurring in the CO
2 injected into the rock mass. In order to further improve the accuracy of resistivity monitoring of CO
2 geologic sequestration, it is urgent to conduct in situ observations in combination with visualization experiments to carry out an in-depth study of resistivity and CO
2 saturation characteristics under CO
2 geologic sequestration conditions
| [10] | Wu F, Dai J, Wen Z, Yao C, Shi X, Liang L, et al. Resistivity anisotropy analysis of Longmaxi shale by resistivity measurements, scanning electron microscope, and resistivity simulation. Journal of Applied Geophysics. 2022, 203, 104700. https://doi.org/10.1016/j.jappgeo.2022.104700 |
[10]
.
In this study, resistivity monitoring was combined with microfocus X-ray CT to further investigate the electrical properties of saturated brine Berea sandstone during CO
2 injection
| [11] | Liu Y, Xue Z, Park H, Kiyama T, Zhang Y, Nishizawa O, et al. Measurement of electrical impedance of a Berea sandstone core during the displacement of saturated brine by oil and CO2 injections. Journal of Applied Geophysics. 2015, 123, 50-62. https://doi.org/10.1016/j.jappgeo.2015.09.024 |
[11]
. In the study, a four-electrode structure was used to measure the impedance signal of the core-fluid system, and microfocus X-ray CT was used to continuously scan the core during the displacement experiments to quantitatively visualize the pore fluid saturation. The CO
2 distribution characteristics within the porous medium were analyzed based on the changes in impedance characteristics between the CT images and the displacement process, and the measured impedance data were fitted to an equivalent circuit to evaluate the electrochemical impedance characteristics of the core-fluid system.
2. Archie's Law and Complex Impedance
2.1. Archie's Law
In 1942, Archie
| [12] | Archie G. The Electrical Resistivity Log as an Aid in Determining Some Reservoir Characteristics. Transactions of American Institute of Mining Metallurgical Engineers. 2013, 146, 54-62. https://doi.org/10.2118/942054-G |
[12]
was the first to propose the relationship between resistivity and rock porosity, water saturation, etc. by studying the relationship between resistivity of water-bearing pure rock and hydrocarbon-bearing pure rock, and the relationship between resistivity and rock porosity, water saturation, etc. by utilizing the resistivity of the stratum to approximate the oil and gas saturation of the reservoir. For the system composed of porous medium and pore fluid, its resistivity is affected by the pore space geometry, such as porosity, specific surface area, tortuosity and fluid saturation. For common saturated saline sandstones, the resistivity follows the empirical Archie formula:
where is the formation resistivity factor, is the saturated brine core resistivity, is the brine resistivity, is the core porosity, and m is the core cementation coefficient. For partially brine-saturated sandstone, the resistivity is related to brine saturation as follows:
where is the resistivity index, is the actual measured core resistivity, is the brine saturation, and n is the saturation index. The Archie formula is a relationship between core body resistivity and porosity or water saturation, but it does not explain the microscopic mechanism of the electrical impedance characteristics of the core-fluid system.
2.2. Complex Impedance
Electrochemical impedance spectroscopy (EIS) method is a means of exploring the reaction mechanism of electrochemical systems in depth. The common method of EIS is to apply a small amplitude sinusoidal AC voltage (current) with different frequencies to one side of the electrochemical system as a perturbation signal to act on the electrochemical system, and the complex impedance of the system obtained through the correspondence between the response of the electrochemical system and the perturbation signal as the sinusoidal frequency ω varies. The complex impedance can be expressed as:
where denotes the complex impedance real part and denotes the complex impedance imaginary part. The impedance magnitude is denoted as:
The phase angle is denoted as:
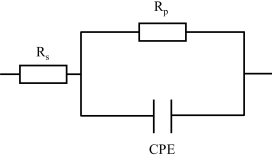
Analyzed from the energy balance point of view, the equivalent circuit of a porous medium usually consists of a resistive (dissipative part) element and a capacitive (storage part) element. The dissipative part results from the current transferring energy out of the circuit, while the storage part results from different polarization effects, including interfacial polarization, bilayer polarization, and membrane polarization. The latter two polarization effects are related to the transport of fluids within the pores of the porous medium. Overall the overall electrochemical properties of the core system can be equivalently described by a circuit that consists of resistive and capacitive elements connected in series and parallel.
Figure 1. Cole equivalent circuit model.
For the displacement system in this study, the Cole equivalent circuit model was selected to evaluate the electrochemical properties of the core and the fluid within the pore space due to the contact resistance between the measurement electrode and the core matrix. The Cole equivalent circuit model is shown in
Figure 1, and the specific form of the circuit is a resistor
connected in parallel with a double capacitive layer CPE and then connected in series to a resistor
.
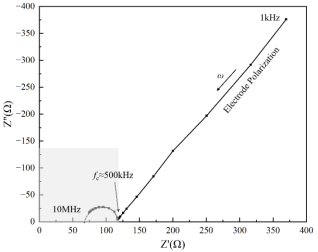
Figure 2. Core - fluid system complete Nyquist diagram.
The Nyquist plot of the Cole circuit is shown in
Figure 2. It consists mainly of an impedance arc in the high frequency region and a linear impedance in the low frequency region. Its complex impedance plot has a very high impedance in the low-frequency region, and the real part of the impedance increases linearly with respect to the imaginary part, indicating that a significant polarization effect occurs in the low-frequency region. This phenomenon is caused by the diffusion of ions near the electrode-electrolyte interface, independent of the fluid distribution inside the porous medium, and is usually described by the Warburg impedance in the equivalent circuit model. The impedance map in the high-frequency region exhibits a semicircular arc of lower impedance, which is directly related to the distribution and change of fluid inside the core pores, and the critical frequency of the two regions is about 500 kHz. Therefore, in order to discuss the electrochemical response law for the evolution and distribution characteristics of CO
2 saturation during CO
2-brine displacement process, the impedance related to the polarization of the electrode is eliminated from the following analysis, and only the impedance in the high-frequency region (500 kHz-10 MHz) electrochemical impedance characteristics. In addition, because of the contact resistance between the measuring electrode and the core matrix, the Nyquist plot in this study does not start from the representation of a semicircular impedance arc starting from the zero point, and the value of the contact resistance is approximately equal to the intersection of the part of the semicircular arc that extends out with the real axis.
The magnitude of the frequency is not directly reflected in the Nyquist plot, but it clearly reflects the electrochemical processes in the experimental material. For series circuits, the total impedance is equal to the sum of the complexes of the impedances of each circuit element, and for parallel circuits, the total impedance is equal to the sum of the reciprocals of the complexes of each impedance. The Bode plot contains two graphs, the horizontal coordinate is a log function of frequency, and the vertical coordinate is the magnitude of the impedance and phase angle , which describes the curves of the change of the magnitude of the impedance and the phase angle at different frequencies.
3. Materials and Methods
3.1. Sample Preparation and Fluid Properties
In this study, the Berea sandstone core was used as the experimental material in the simulated CO
2 geological sequestration and displacement experiments, and its quartz content was about 92%, obtaining a core diameter of 25 mm and a length of 62 mm. the pore volume of the core was measured to be 5.65 mL, the porosity to be 18.57%, and the permeability to be 5.9 μm
2, and the basic parameters of the core samples are shown in
Table 1.
Table 1. Parameters of the Berea sandstone core sample.
Berea Core | Calibre (mm) | Lengths (mm) |
Parameters | 25 | 62 |
Pore Volume (mL) | Porosity (%) | Permeability (mD) |
5.65 | 18.57 | 59 |
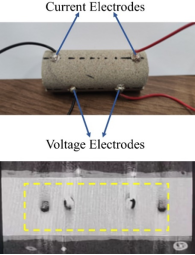
The core sample is shown in
Figure 3. Holes were punched in the core in order to arrange the electrodes, and the measurement electrodes were staggered in a cross shape. The current and voltage electrodes are made of copper violet of grade T1, which contains more than 99.95% copper and has good electrical conductivity. Coaxial cables were connected to the measuring electrodes by welding. Subsequently, the end caps were installed on the top and bottom of the core and coated with a layer of epoxy resin. A fluid deflector was added to one side of the end cap to connect to the core surface, and the other side of the end cap was connected to the fluid line. All of the above components, including the fluid lines, are made of PEEK with insulating properties. The coaxial cable from the measurement electrode is connected to an external impedance analyzer through a through-wall connector of the reactor.
In order to enhance the contrast of the microfocus CT images, KI solution with 12.5% mass fraction was selected as the X-ray contrast agent in this study to enhance the visualization of the pore interiors and to ensure that the greyness value of the brine inside the pores was much larger than that of CO
2. The gases used in the experiments were CO
2 and N
2 with 99.9% purity, and the confining oil used was the dimethylsilicone oil which had good thermal conductivity and insulating properties. The physical parameters of CO
2 and KI solution under different experimental conditions are shown in
Table 2.
3.2. Experimental Instruments
The core equipment of the resistivity sensing-microfocus X-ray CT coupled core experimental system used in this thesis is the inspeXio SMX-225CTX-SV microfocus X-ray CT system from Shimadzu, Japan. The visualized area of CT scanning in the experiment is a cylindrical area with a diameter of 25 mm and a height of 30 mm between the two voltage electrodes, and the CT images obtained from the scanning consist of a stack of 1800 2D images. Considering the lower quality of the CT scan images near the electrodes, which are prone to metal artifacts, 1200 2D slice layer images with better imaging quality were selected from the image stack for specific analysis. The size of each 2D lamellar image was 2048 × 2048 pixels, the duration of each CT scan was 1800 s, the interval between each scan was 200 s. The key parameters of the microfocus CT scanning imaging were set as shown in
Table 3.
In this experiment, the TH2851-050 Precision Impedance Analyzer was used to perform continuous impedance measurements of 500 kHz to 10 MHz for the displacement process using the impedance instrument. A sinusoidal voltage of 10 mV was applied to the current electrode, and the impedance data were recorded using the list scan function of the instrument. To reduce stray capacitance as well as external noise, a BNC connector was used to connect the coaxial lead of the measurement electrode to the measurement path of the impedance analyzer.
Table 2. Experimental fluid physical parameters.
Fluid | Experimental Conditions | Density (g/cm3) | Viscosity (mPa∙s) | Conductivity (S/m) | Dielectric Constant |
KI solution | 10 MPa, 40°C | 1.07 | 0.75 | 8.4 | 73.17 |
10 MPa, 25°C | 1.08 | 1.03 |
5 MPa, 25°C | 1.08 | 1.03 |
CO2 | 10 MPa, 40°C | 0.63 (Sc) | 0.048 | 0 | 1.30 |
10 MPa, 25°C | 0.82 (L) | 0.074 | 1.45 |
5 MPa, 25°C | 0.13 (G) | 0.018 | 1.0 |
Table 3. Microfocus X-ray CT detailed parameter setting.
Parameter Type | Value | Parameter Type | Value |
Voltage | 160 kV | Current | 70 μA |
SOD | 132 mm | SID | 800 mm |
FOV | 30 mm | Image size | 2048×2048 |
Image resolution | 16 μm | Imaging time | 1800 s |
According to the experimental conditions and data acquisition requirements, the high temperature and high pressure reactor was designed to satisfy both resistivity measurement and CT scan visualization. The reactor is designed as a split structure, which uses aerospace alloy materials for the upper and lower parts, and polyether ether ketone PEEK material is chosen for the middle part. This design not only enhances the X-ray penetration ability of the pressure chamber, but also reduces heat loss, thus improving the accuracy of temperature control.
3.3. Experimental Procedure and Calculation Method
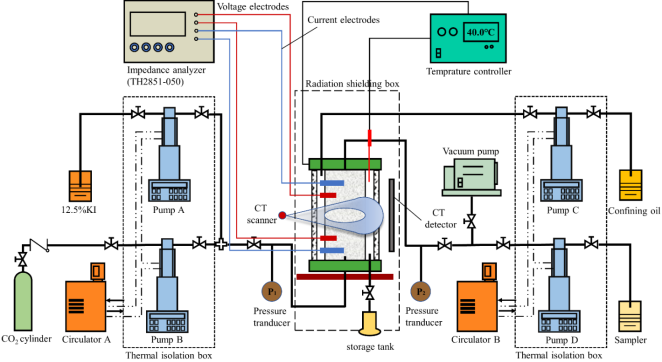
The schematic diagram of the experimental system is shown in
Figure 4. The piping system of the CO
2 displacement monitoring experimental system contains four plunger pumps. After connecting with the high-temperature reactor, it can be used as the experimental fluid injection system and pressure control system. The injection of CO
2 and brine, precise control of pore pressure, surrounding pressure and back pressure are accomplished respectively. The temperature of the piping system is controlled by two water bath circulators, which can ensure the fast temperature conduction of the system and the temperature control of the injected fluid to simulate the environment of the formation. The experimental system uses high-precision pressure sensors and thermocouples to monitor the temperature and pressure of the system, and automatically collects the temperature and pressure data of the experimental process.
The entire experimental system was evacuated for 24 hours using a vacuum pump. The core inside the reactor was injected with 50 PV of a 12.5% mass fraction KI solution via a brine injection pump. The temperature and pressure conditions inside the reactor were set to match those of the displacement process, and the sample was saturated under the experimental conditions. A brine plunger pump was used to continue to inject 100 PV of CO
2-saturated KI solution into the core sample inside the reactor to replace the unsaturated CO
2 KI solution in the pore space of the porous medium. This prevents further dissolution of CO
2 into the KI solution during subsequent displacement. Subsequently, CO
2-brine displacement experiments were carried out at three different pore pressures and temperatures, in which a total of 2 PV of CO
2 was injected into the saturated brine cores, and the specific temperatures and pressures, cumulative injection volumes and CO
2 injection flow rates are shown in
Table 4.
Quantitative analysis of CT images is possible after transforming a series of gray-scale composed CT images into a binarized 2D lamellar image stack. The following is a description of the calculation method for the physical property parameters related to porous media used in this study.
Figure 4. Schematic of the experiment system.
Table 4. Microfocus X-ray CT detailed parameter setting.
Medium | Temperature (°C) | Pore Pressure (MPa) | Confining Pressure (MPa) | Injection Volume (PV) | Injection Rate (mL/min) |
CO2-KI | 40 | 10 | 12 | 0.2, 0.4, 0.6, 0.8, 1.0 | 0.2 |
1.5, 2.0 | 0.5 |
25 | 10 | 12 | 0.2, 0.4, 0.6, 0.8, 1.0 | 0.2 |
1.5, 2.0 | 0.5 |
25 | 5 | 7 | 0.2, 0.4, 0.6, 0.8, 1.0 | 0.2 |
1.5, 2.0 | 0.5 |
Porosity is one of the most fundamental physical parameters in porous media, which describes the percentage of pore space within the core to the volume of the entire porous medium, and is calculated as follows:
Where denotes the absolute porosity, denotes the internal pore volume of the porous medium, and represents the total volume of the core. In this experiment, the porosity of the rock core can be image-operated by the following equation:
(7)
Where is the core image of saturated brine, and is the core image of saturated CO2, and is the CT image of the reactor filled with brine, and is the CT image of the reactor filled with CO2. It should be noted that the above core images need to be scanned under the experimental temperature and pressure conditions, and the key parameters of the microfocus X-ray CT need to be tested and optimized several times before scanning.
Saturation is the ratio of the volume occupied by a certain phase of material inside the core pore space to the total pore volume inside the core. It is an important parameter to measure how much specific material is inside the core, and the saturation evolution of reservoir CO2 during CO2 geological storage is the focus of research. Taking the CO2-brine porous media system studied in this thesis as an example, the formula for calculating the CO2 saturation degree within the pore space of the porous media is as follows:
(8)
where denotes the saturation of CO2 inside the core, denotes the CT image of the core after CO2 displacement during the experiment, denotes the image of the core saturated with brine, and denotes the image of the core saturated with CO2.
4. Results and Discussion
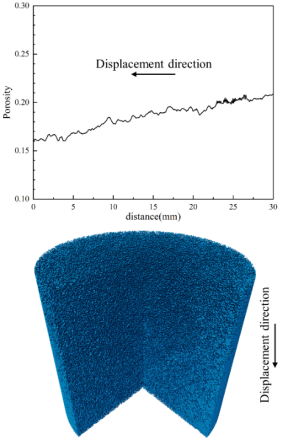
Figure 5. Layer by layer face rate and core pore characteristic structure.
Literature
shows that the porosity distribution within a porous medium has a positive correlation with the distribution of CO
2 saturation in it. Therefore, it is necessary to quantitatively characterize the pore structure characteristic parameters of porous media to study the spatial distribution characteristics of CO
2 during CO
2-brine displacement. The layer-by-layer surface porosity and pore characteristic structure of the core samples are shown in
Figure 5.
The calculated average porosity of the core in the scanned area is 19.13%, while the actual measured porosity of the core is 18.57%, and the error between the two is not more than 5%. Some fluctuations in the porosity distribution of the core along the flow direction were observed in the layer-by-layer surface porosity images. The maximum porosity of the core in the 3D reconstructed area occurs near the beginning of the flow and its value is 20.78%. The minimum porosity occurs near the end of the flow with a value of 16.03%. In the three-dimensional core pore structure distribution rendered by the CT 2D image stack, the core porosity is nonhomogeneous in both axial and radial directions. Such small-scale non-homogeneity will affect the spatial distribution of CO2 saturation during the displacement process.
4.1. Characterization of CO2 Saturation Distribution Within Porous Media Based on CT Images
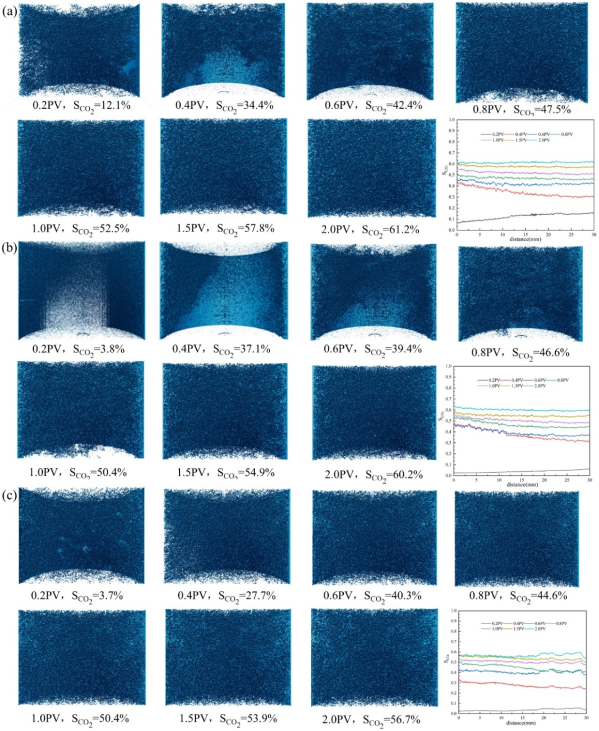
Figure 6 shows the variation and spatial distribution characteristics of CO
2 saturation at three different temperature pressures with two CO
2 injection flow rates, and the variation curves of saturation with the increase of cumulative CO
2 injection are calculated. Where (a) represents 10 MPa, 40°C experimental condition, (b) represents 10 MPa, 25°C experimental condition, (c) represents 5 MPa, 25°C experimental condition.
Under lower temperature-pressure conditions, it is more difficult for CO2 to intrude into the pore space occupied by in-situ brines during the displacement process due to the constraints imposed by capillary forces within the core. The distribution of CO2 planar saturation along the flow direction is more drastic, which is influenced to a greater extent by the porosity distribution and non-homogeneity. With increasing temperature and pressure, the CO2 saturation curve is smoother, the migration front is flatter, and there is no strict correspondence between the saturation change and the pore space.
At lower flow rates and injection volumes, there is a correlation between CO2 saturation distribution and core porosity distribution due to the non-homogeneity of the core. The displacement of CO2 from the top to the bottom of the salty water results in a more uniform distribution of CO2 in the radial direction than in the axial direction due to the suppression of the buoyancy force. Most of the CO2 in the pore space exists as isolated CO2 bubble clusters. A small portion of the CO2 exists as continuous large clusters inside the pore space with high connectivity. Areas of high CO2 saturation coexist with areas of low saturation inside the core. The displacement of CO2 from the top to the bottom of the salty water results in a more uniform distribution of CO2 in the radial direction than in the axial direction due to the suppression of the buoyancy force.
At higher flow rates and injection volumes, the CO2 saturation distributions along the flow direction are more similar in the three experimental conditions, with larger CO2 clusters and denser CO2 distributions inside the pore space. low CO2 saturation regions are gradually covered and high saturation regions are gradually expanded, and the CO2 flow is more along the direction of the displacement, and the CO2 transport front is flatter and the spatial distribution of the gases is more homogeneous.
Figure 6. CO2 distribution and saturation at different temperature pressure and injection volume.
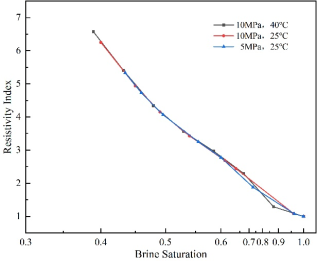
4.2. Brine Saturation and Resistivity Characterization
In this study, the effect of chemical reaction is not considered in the CO
2-brine displacement process, and it is assumed that only two phases, CO
2 and brine, exist inside the core pores. The resistance of the saturated brine core was measured to be 77 Ω at a scanning frequency of 500 kHz before the beginning of the displacement experiment, and then the resistivity of the core with a length of 30 mm between the two voltage electrodes was found to be 2.65 Ω∙m. The cementation coefficient of the core, m, was calculated to be 1.82 by Equation (
1), which is in accordance with the range of values of cementation coefficient of sandstone, m, (1.8 to 2.0). According to the core grayscale image, the brine saturation at different moments of the replacement process was calculated, and the change of resistivity index
with brine saturation for the replacement process at different temperatures and pressures was obtained by bringing it into Equation (
2), as shown in
Figure 7.
Figure 7. Resistivity index under different saline saturation.
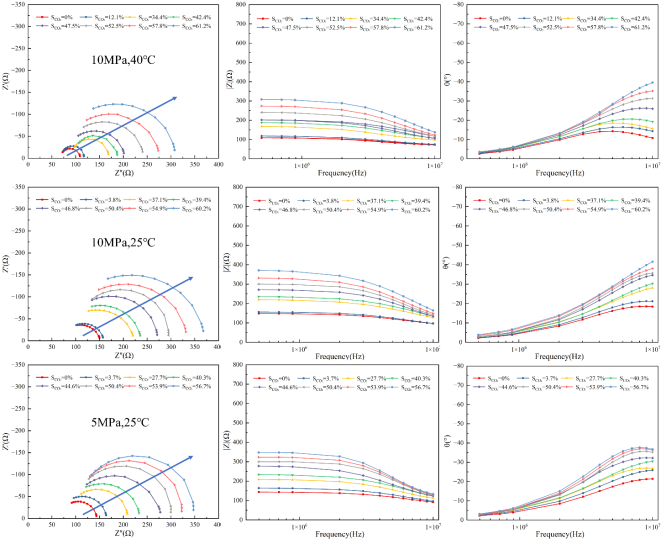
4.3. Electrochemical Impedance Characterization of CO2 Injection
The electrochemical impedance spectra with CO
2 injection at three experimental temperature pressures are presented in
Figure 8. The Nyquist diagram of the Cole equivalent circuit model is affected by the polarization effect in the low frequency region and therefore has a very high impedance, and the real part of the impedance increases linearly with respect to the imaginary part. In the high-frequency region the impedance is directly related to the distribution and variation of the fluid inside the pores of the porous medium, which manifests itself as a semicircular arc of lower impedance. The semicircular arc of impedance in high-frequency region does not start at zero because of the contact resistance between the electrode and the core matrix and pore fluid.
In this study, only the electrochemical impedance characteristics in the high-frequency region are discussed. Overall, the impedance of the core-fluid system is not only closely related to the CO2 saturation, but also affected by the change of scanning frequency. The system impedance increases with increasing CO2 saturation and decreases with increasing scanning frequency. As the scanning frequency increases, the real impedance gradually decreases while the imaginary impedance shows a tendency of first increasing and then decreasing. The impedance characteristics in the electrochemical impedance spectra can intuitively reflect the pore characteristics of the core-fluid system, as well as the distribution characteristics such as the evolution of CO2 saturation in the porous medium.
The impedance amplitude increases with CO
2 saturation in both the low and high frequency regions
| [14] | Kitamura K, Honda H, Nishizawa O, Mitani Y. Impacts of CO2 injection speed on two-phase flow and physical parameters in porous sandstone. International Journal of Greenhouse Gas Control. 2021, 107, 103228. https://doi.org/10.1016/j.ijggc.2020.103228 |
[14]
. This change process can be divided into two stages. In the early stage of CO
2 injection, the high pore space is occupied first, when the residual brine still maintains good conductive connectivity, so the initial increase in CO
2 saturation has a small effect on the system impedance. As the CO
2 saturation continues to increase, the low pore space is gradually filled with CO
2, resulting in a reduction of the conductive circuit within the system, and the impedance therefore begins to increase rapidly. When the Cole equivalent circuit was utilized for fitting, the changes of resistance and capacitance in its circuit corroborated this law.
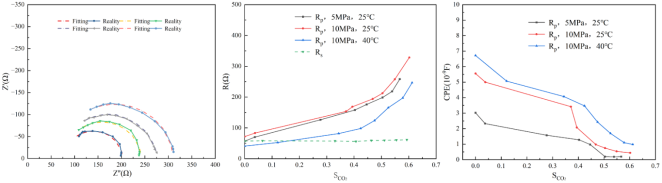
4.4. Equivalent Circuit Fitting
Sandstone was used in this study for the CO2 displacement experiments, and it is generally recognized that there are three types of conduction pathways for AC current in sandstone: the first is a fully connected pore pathway equivalent to a resistor, the second is a partially connected pore pathway blocked by the core matrix, and the third is a pathway composed entirely of sandstone matrix. Due to the strong insulating nature of the sandstone matrix, the conduction channels of the latter two currents are capacitive, which is equivalent to a parallel circuit of resistance and capacitance when the three conductive pathways are operating simultaneously.
The contact resistance between the core sample and the measurement electrodes was present, so the Cole equivalent circuit model was used for electrochemical evaluation of the system
| [15] | Yin D, Xu Q. Investigating the damage evolution of sandstone using electrical impedance spectroscopy. International Journal of Rock Mechanics and Mining Sciences. 2021, 144, 104817. https://doi.org/10.1016/j.ijrmms.2021.104817 |
[15]
. The fitting results obtained using Zview2 software and the variation of each electrical component in the circuit with CO
2 saturation are shown in
Figure 9, and the fitting error of each component in the equivalent circuit is less than 10%.
The contact resistance was measured to be about 57.1 Ω before the start of the displacement experiment, and it did not change significantly with the increase of CO2 saturation. For the three different pressure-temperature conditions, the parallel resistance was maximum at 10 MPa, 25°C working condition. This phenomenon may be related to the percentage of CO2 in the fully connected pore space in the porous medium. During CO2 injection, the shunt resistance increased with the increase of CO2 saturation, and the double electric layer capacitance CPE decreased with the increase of CO2 saturation. The shunt resistance was approximately exponentially related to the CO2 saturation, and the double electric layer capacitance CPE was approximately linearly related to the CO2 saturation.
Figure 8. EIS of CO2 injection process under three experimental conditions.
Figure 9. Fitting results and variation of each electrical component in the circuit with CO2 saturation.
5. Conclusions
Lower temperature pressures make it more difficult for CO2 to displace the pore space occupied by brine, leading to more drastic changes in CO2 planar saturation along the displacement direction. With increasing temperature and pressure, the CO2 saturation curve is smoother and the migration front is flatter. At lower flow rates and injection volumes, the distribution of CO2 is correlated with the porosity distribution, and high and low saturation regions coexist. The distribution of CO2 becomes more uniform with the increase of injection flow rate and volume. The low-saturation region is gradually covered, and the high-saturation region continues to expand. On the Nyquist plot of the core-pore fluid system, the low-frequency region has a high impedance characteristic due to the polarization effect, and the high-frequency region is related to the fluid distribution inside the pore. Electrochemical impedance characterization focusing on the high-frequency region shows that the system impedance increases with increasing CO2 saturation and decreases with increasing scanning frequency. The variation of impedance characteristics in the electrochemical impedance spectra not only reflects the pore structure characteristics of the core, but also reveals the evolution of CO2 saturation inside the porous medium. With the increase of CO2 saturation, the low pore space is gradually occupied by CO2. The residual brine connectivity of the pore space as a conductive component decreases, and the conductive circuits within the system decrease resulting in the impedance starting to increase rapidly.
In this study, only the same core was used for two-phase displacement experiments. There is a big difference with the complex porosity distribution and non-homogeneity of the real reservoir. When the reservoir conditions are not ideal, the pore characterization parameter of the porous medium may lead to a great change in the CO2 transport state inside the reservoir. Follow-up studies will be conducted to further elucidate the spatial distribution of CO2 under different pore characteristics by carrying out a variety of CO2-brine flow experiments in real rock cores.
Abbreviations
PV | Pore Volume |
FOV | Field of View |
SID | Source Image Distance |
Acknowledgments
Thanks to the School of Energy and Power Engineering of Dalian University of Technology for the support of this research work.
Funding
This work is supported by the National Key Research and Development Program of China (Grant 2023YFB4104203), the National Natural Science Foundation of China (Grant U23B2090) and the Special Project for key Research and Development Program of Xinjiang Autonomous Region (Grant 2022B01034-4).
Data Availability Statement
The data is available from the corresponding author upon reasonable request.
Conflicts of Interest
The authors declare no conflicts of interest.
References
| [1] |
Gholami R, Raza A, Iglauer S. Leakage risk assessment of a CO2 storage site: A review. Earth-Science Reviews. 2021, 22, 84-9.
https://doi.org/10.1016/j.earscirev.2021.103849
|
| [2] |
Caesary D, Kim J, Jang SJ, Quach N, Park C, Kim H-M, et al. Numerical modeling and evaluation of lab-scale CO2-injection experiments based on electrical resistivity measurements. Journal of Petroleum Science and Engineering. 2022, 208, 109788.
https://doi.org/10.1016/j.petrol.2021.109788
|
| [3] |
Nakatsuka Y, Xue Z, Garcia H, Matsuoka T. Experimental study on CO2 monitoring and quantification of stored CO2 in saline formations using resistivity measurements. International Journal of Greenhouse Gas Control. 2010; 4(2): 209-16.
https://doi.org/10.1016/j.ijggc.2010.01.001
|
| [4] |
Alemu B, Aker E, Soldal M, Johnsen Ø, Aagaard P. Effect of sub-core scale heterogeneities on acoustic and electrical properties of a reservoir rock: A CO2 flooding experiment of brine saturated sandstone in a computed tomography scanner. Geophysical Prospecting. 2013, 61, 235-50.
https://doi.org/10.1111/j.1365-2478.2012.01061.x
|
| [5] |
Adebayo A. An Experimental Investigation of the Use of Combined Resistivity and Temperature Logs for Scale Monitoring In Carbonate Formations During CO2 Sequestration. Journal of Energy Resources Technology, Transactions of the ASME. 2014, 137, 32202-32202.
https://doi.org/10.1115/1.4028772
|
| [6] |
Börner J, Herdegen V, Repke J-U, Spitzer K. The electrical conductivity of CO2-bearing pore waters at elevated pressure and temperature: A laboratory study and its implications in CO2 storage monitoring and leakage detection. Geophysical Journal International. 2015, 203, 1072-84.
https://doi.org/10.1093/gji/ggv331
|
| [7] |
Nooraiepour M, Bohloli B, Park J, Sauvin G, Skurtveit E, Mondol NH. Effect of brine-CO2 fracture flow on velocity and electrical resistivity of naturally fractured tight sandstones. Geophysics. 2017, 83(1), WA37-WA48.
https://doi.org/10.1190/geo2017-0077.1
|
| [8] |
Adebayo AR, Kandil ME, Okasha TM, Sanni ML. Measurements of electrical resistivity, NMR pore size and distribution, and x-ray CT-scan for performance evaluation of CO2 injection in carbonate rocks: A pilot study. International Journal of Greenhouse Gas Control. 2017, 63, 1-11.
https://doi.org/10.1016/j.ijggc.2017.04.016
|
| [9] |
Bakhshian S, Hosseini SA, Lake LW. CO2-brine relative permeability and capillary pressure of Tuscaloosa sandstone: Effect of anisotropy. Advances in Water Resources. 2020, 135, 103464.
https://doi.org/10.1016/j.advwatres.2019.103464
|
| [10] |
Wu F, Dai J, Wen Z, Yao C, Shi X, Liang L, et al. Resistivity anisotropy analysis of Longmaxi shale by resistivity measurements, scanning electron microscope, and resistivity simulation. Journal of Applied Geophysics. 2022, 203, 104700.
https://doi.org/10.1016/j.jappgeo.2022.104700
|
| [11] |
Liu Y, Xue Z, Park H, Kiyama T, Zhang Y, Nishizawa O, et al. Measurement of electrical impedance of a Berea sandstone core during the displacement of saturated brine by oil and CO2 injections. Journal of Applied Geophysics. 2015, 123, 50-62.
https://doi.org/10.1016/j.jappgeo.2015.09.024
|
| [12] |
Archie G. The Electrical Resistivity Log as an Aid in Determining Some Reservoir Characteristics. Transactions of American Institute of Mining Metallurgical Engineers. 2013, 146, 54-62.
https://doi.org/10.2118/942054-G
|
| [13] |
Zuo L, Benson S. Process Dependent Residual Trapping of CO2 in Sandstone. Geophysical Research Letters. 2014, 41, 2014GL059653.
https://doi.org/10.1002/2014GL059653
|
| [14] |
Kitamura K, Honda H, Nishizawa O, Mitani Y. Impacts of CO2 injection speed on two-phase flow and physical parameters in porous sandstone. International Journal of Greenhouse Gas Control. 2021, 107, 103228.
https://doi.org/10.1016/j.ijggc.2020.103228
|
| [15] |
Yin D, Xu Q. Investigating the damage evolution of sandstone using electrical impedance spectroscopy. International Journal of Rock Mechanics and Mining Sciences. 2021, 144, 104817.
https://doi.org/10.1016/j.ijrmms.2021.104817
|
Cite This Article
-
APA Style
Xue, T., Xu, J., Liu, Y. (2024). Impedance Characteristics of Berea Sandstone Cores in the Process of CO2 Injection Displacement with Saturated Brine. Journal of Energy and Natural Resources, 13(2), 69-80. https://doi.org/10.11648/j.jenr.20241302.13
 Copy
|
Copy
|
 Download
ACS Style
Xue, T.; Xu, J.; Liu, Y. Impedance Characteristics of Berea Sandstone Cores in the Process of CO2 Injection Displacement with Saturated Brine. J. Energy Nat. Resour. 2024, 13(2), 69-80. doi: 10.11648/j.jenr.20241302.13
Copy
|
Download
AMA Style
Xue T, Xu J, Liu Y. Impedance Characteristics of Berea Sandstone Cores in the Process of CO2 Injection Displacement with Saturated Brine. J Energy Nat Resour. 2024;13(2):69-80. doi: 10.11648/j.jenr.20241302.13
Copy
|
Download
-
@article{10.11648/j.jenr.20241302.13,
  author = {Tian Xue and Jintao Xu and Yu Liu},
  title = {Impedance Characteristics of Berea Sandstone Cores in the Process of CO2 Injection Displacement with Saturated Brine
},
  journal = {Journal of Energy and Natural Resources},
  volume = {13},
  number = {2},
  pages = {69-80},
  doi = {10.11648/j.jenr.20241302.13},
  url = {https://doi.org/10.11648/j.jenr.20241302.13},
  eprint = {https://article.sciencepublishinggroup.com/pdf/10.11648.j.jenr.20241302.13},
  abstract = {As an important means of CO2 geological storage leakage monitoring, resistivity monitoring technology is of great significance to the safety and stability of CCUS project. In order to study the electrical signal response rule of the evolution of CO2 saturation in the reservoir, a joint core displacement experiment system of electrochemical impedance analysis and microfocus X-ray CT was designed and constructed to simulate the process of CO2 displacement of brine in Berea sandstone cores under stratigraphic temperature and pressure conditions. The electrochemical impedance characteristics of the core-fluid system are analyzed by electrochemical impedance spectroscopy. The experimental results show that at lower temperature and pressure, it is more difficult for CO2 to invade the pore space occupied by the brine in situ, resulting in drastic changes in CO2 plane saturation along the displacement direction. With the increase of temperature and pressure, the CO2 saturation curve becomes smoother and the migration and displacement front becomes even. The Cole equivalent circuit model is used to describe the conduction mode of AC electrical signals inside the core, and the electrochemical impedance characteristic analysis focusing on the high frequency region shows that the system impedance increases with the increase of CO2 saturation, and decreases with the increase of scanning frequency. In addition, the changes of impedance characteristics in the electrochemical impedance spectroscopy not only reflect the pore structure characteristics of the core, but also reveal the evolution law of CO2 saturation in the porous medium. With the increase of CO2 saturation, the low pore space is gradually occupied by CO2, and the residual brine connectivity of the pore space as a conductive component decreases. The decrease of the internal conductive circuit leads to the rapid increase of the impedance, which is consistent with the change of resistance and capacitance when fitting the Cole equivalent circuit model.
},
 year = {2024}
}
Copy
|
Download
-
TY  - JOUR
T1  - Impedance Characteristics of Berea Sandstone Cores in the Process of CO2 Injection Displacement with Saturated Brine

AU  - Tian Xue
AU  - Jintao Xu
AU  - Yu Liu
Y1  - 2024/06/13
PY  - 2024
N1  - https://doi.org/10.11648/j.jenr.20241302.13
DO  - 10.11648/j.jenr.20241302.13
T2  - Journal of Energy and Natural Resources
JF  - Journal of Energy and Natural Resources
JO  - Journal of Energy and Natural Resources
SP  - 69
EP  - 80
PB  - Science Publishing Group
SN  - 2330-7404
UR  - https://doi.org/10.11648/j.jenr.20241302.13
AB  - As an important means of CO2 geological storage leakage monitoring, resistivity monitoring technology is of great significance to the safety and stability of CCUS project. In order to study the electrical signal response rule of the evolution of CO2 saturation in the reservoir, a joint core displacement experiment system of electrochemical impedance analysis and microfocus X-ray CT was designed and constructed to simulate the process of CO2 displacement of brine in Berea sandstone cores under stratigraphic temperature and pressure conditions. The electrochemical impedance characteristics of the core-fluid system are analyzed by electrochemical impedance spectroscopy. The experimental results show that at lower temperature and pressure, it is more difficult for CO2 to invade the pore space occupied by the brine in situ, resulting in drastic changes in CO2 plane saturation along the displacement direction. With the increase of temperature and pressure, the CO2 saturation curve becomes smoother and the migration and displacement front becomes even. The Cole equivalent circuit model is used to describe the conduction mode of AC electrical signals inside the core, and the electrochemical impedance characteristic analysis focusing on the high frequency region shows that the system impedance increases with the increase of CO2 saturation, and decreases with the increase of scanning frequency. In addition, the changes of impedance characteristics in the electrochemical impedance spectroscopy not only reflect the pore structure characteristics of the core, but also reveal the evolution law of CO2 saturation in the porous medium. With the increase of CO2 saturation, the low pore space is gradually occupied by CO2, and the residual brine connectivity of the pore space as a conductive component decreases. The decrease of the internal conductive circuit leads to the rapid increase of the impedance, which is consistent with the change of resistance and capacitance when fitting the Cole equivalent circuit model.

VL  - 13
IS  - 2
ER  -
Copy
|
Download