
 ,
Adou Koffi Kunindjani,
Gninfanni Silvere Ouattara,
Adouko Edith Agbo,
Christophe Kouame,
Allico Joseph Djaman
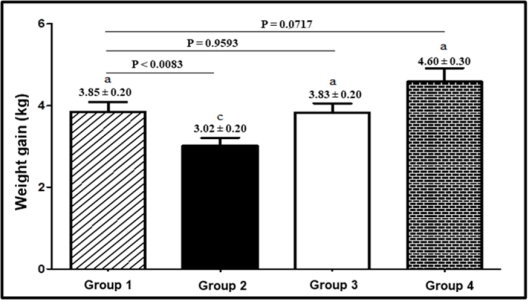
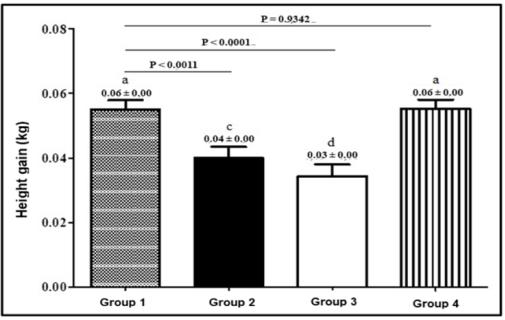
In Cote d’Ivoire, there is a disparity between dietary intake and nutritional needs among school-age children. Studies have shown that dietary diversification could offer a solution. A study was therefore conducted to assess the impact of dietary diversification on the anthropometric and vitamin profiles of students in school cafeterias in the Nawa region. This study took place from October 2017 to May 2018 in school cafeterias in 12 localities in the Nawa region. It included 240 school-aged children aged 6 - 12, divided into four groups of 60 students. Four types of meals were offered to the four groups: rice with tomato sauce and fish, sweet potato stew enriched with green soybeans, sweet potato stew enriched with white cowpeas, and sweet potato stew enriched with cowpeas and soybean balls. Anthropometric measurements were based on the standardized method of the World Health Organization and the United Nations Children’s Fund. Concurrently, blood samples were collected before meal consumption (Phase 0), three (3) months later (Phase 1), and six (6) months later (Phase 2). Blood levels of vitamin A were measured using high-performance liquid chromatography (HPLC). In this study, the mean age ranged from 8.62 to 10.25 years, with a significant difference (p < 0.01) between Group 2 (10.25 years) and Group 1 (8.60 years). An increase in the children’s weight, height, and body mass index was observed six months after food consumption. Before the children began eating school meals (phase 0), adequate vitamin A levels were observed. Vitamin A levels decreased in groups 1, 2, and 3 from phase 0 to phase 2. However, they increased in children in group 4 from 0.5 to 0.8 mg/L. In this study, an increase in weight, height, and body mass index was observed among children who consumed the various meals in the study. Furthermore, an improvement in vitamin A status was more pronounced among children who consumed the meal based on sweet potato, soybeans, and cowpeas. This dish could be selected as a suitable option for dietary diversification in school cafeterias.
| Published in | International Journal of Nutrition and Food Sciences (Volume 15, Issue 6) |
| DOI | 10.11648/j.ijnfs.20261506.12 |
| Page(s) | 324-331 |
| Creative Commons |
This is an Open Access article, distributed under the terms of the Creative Commons Attribution 4.0 International License (http://creativecommons.org/licenses/by/4.0/), which permits unrestricted use, distribution and reproduction in any medium or format, provided the original work is properly cited. |
| Copyright |
Copyright © The Author(s), 2026. Published by Science Publishing Group |
Dietary Diversification, West Africa, School Cafeteria, Vitamin
Parameters | Phases | Group 1 (n = 60) | Group 2 (n = 60) | Group 3 (n = 60) | Group 4 (n = 60) |
|---|---|---|---|---|---|
Age (years) | 8.62 ± 0.32 ns | 10.25 ± 0.24** | 9.43 ± 0.26 ns | 9.23 ± 0.25 ns | |
Weight (kg) | P0 | 25.78 ± 1.30ns | 28.45 ± 0.98 ns | 27.15 ± 1.07ns | 25.95 ± 0.9 ns |
P1 | 28.22 ±1.45 ns | 30.18 ± 1.03 ns | 29.08 ±1.15 ns | 29.13 ±0.94 ns | |
P2 | 29.63 ±1.39 ns | 31.45 ± 1.05 ns | 30.98 ±1.16 ns | 30.55 ±1.00 ns | |
Height (m) | P0 | 1.32 ± 0.02 ns | 1.38 ± 0.02* | 1.34 ± 0.02 ns | 1.31 ± 0.01 ns |
P1 | 1.35 ± 0.02 ns | 1.40 ± 0.02 ns | 1.36 ± 0.02 ns | 1.35 ± 0.01 ns | |
P2 | 1.38 ± 0.02 ns | 1.42 ± 0.02 ns | 1.37 ± 0.02 ns | 1.37 ± 0.01 ns | |
BMI (18,5-25 kg/m2) | P0 | 14.12 ±0.28 ns | 20.35 ±0.50** | 19.90 ±0.52 ns | 14.82 ±0.25 ns |
P1 | 14.82 ±0.36 ns | 21.25 ± 0.49** | 20.95 ± 0.55* | 15.80 ± 0.23* | |
P2 | 15.09 ±0.27 ns | 21.89 ± 0.50** | 22.18± 0.56** | 16.08± 0.24** |
Phases | Group1 (n = 60) | Group 2 (n = 60) | Group 3 (n = 60) | Group 4 (n = 60) |
|---|---|---|---|---|
P0 | 1.0 ± 0.07ns | 0.7 ± 0.06* | 0.8 ± 0.09 ns | 0.5 ± 0.07*** |
P1 | 0.4 ± 0.05 ns | 0.6 ± 0.05** | 0.8 ± 0.18* | 0.7 ± 0.10** |
P2 | 0.6 ± 0.04 ns | 0.6 ± 0.07 ns | 0.7 ± 0.17 ns | 0.8 ± 0.10* |
BMI | Body Mass Index |
WHO | World Health Organization |
UNICEF | United Nations Children's Fund |
COBAS c311 | Comprehensive Biochemical Analysis Clinical 311 |
Mm | Millimeter |
Kg | Kilogram |
µL | Microliter |
| [1] | Pourafshar, S., Rosentrater, K. A., & Krishnan, P. Malnutrition, a global problem. American Society of Agricultural and Biological Engineers. 2010. |
| [2] | UNICEF, World Health Organization, & The World Bank. UNICEF-WHO- World. Bank. Joint Child Malnutrition Estimates: Levels & trends in child malnutrition. Africa. 2012. |
| [3] |
WHO. In Global Nutrition Report 2016: From Promise to Impact: Ending Malnutrition by 2030. Washington, DC. 2016.
https://data.unicef.org/wpcotent/uloads/2016/06/130565-1.pdf (Accessed on February 4, 2020). |
| [4] | Bleyere, M. N., Kokore, B. A., Konan, A. B., & Yapo, P. A. Prevalence of child malnutrition through their anthropometric indices in school canteens of Abidjan (Côte d’Ivoire). Pakistan Journal of Nutrition. 2013, 12 (1): 60-70. |
| [5] | N’go, P., Azzaoui, F., Ahami, A., Aboussaleh, Y., Lachheb, A., & Hamrani, A. Déterminants socioéconomiques, environnementaux et nutritionnels de l’échec scolaire: cas des enfants résidant en zone cacaoyère de Soubré (Côte d’Ivoire). Antropo. 2012, 28: 63-70. |
| [6] | Agbo, E., Mahyao, A., Konan, A. D., Coulibaly, L., Kouassi, A., Kehlenbeck, K. & Kouame, C. Production, consumption, and nutrition survey in a cocoa farming area in the Nawa region. Report. ICRAF, Abidjan, 2014, 137 p. |
| [7] | Agbo, A. E., Kouame, C., N’Doua, N. D., Kouassi, A. & Brou K. Assessment of Cocoa Producers’ Children Nutritional Status in the Nawa Region, Côte d’Ivoire. Journal of Food and Nutrition Research. 2017, 5 (8): 606-613. |
| [8] | Alam, M. K., Sams, S., Rana, Z. H., Akhtaruzzaman, M. & Islam, S. N. Minerals, vitamin C, and effect of thermal processing on carotenoids composition in nine varieties orange-fleshed sweet potato (Ipomoea batatas L.). Journal of Food Composition and Analysis. 2020, 92: 103582. |
| [9] | Sun, H., Mu, T., Xi, L., Zhang, M., & Chen, J. Sweet potato (Ipomoea batatas L.) leaves as nutritional and functional foods. Food Chemistry. 2014, 156: 380-389. |
| [10] | Lokuruka, M. Soybean nutritional properties: The good and the bad about soy foods consumption: a review. African Journal of Food, Agriculture, Nutrition and Development. 2010, 10(4). |
| [11] | Frota, K. D. M. G., Lopes, L. A. R., Silva, I. C. V., & Areas, J. A. G. Nutritional quality of the proteinof Vigna unguiculata L. Walp and its protein isolate. Revista Ciencia Agronomica. 2017, 48 (5): 792-798. |
| [12] | Moloto, M. R., Phan, A. D. T., Shai, J. L., Sultanbawa, Y., & Sivakumar, D. Comparison of phenolic compounds, carotenoids, amino acid composition, in vitro antioxidant and anti-diabetic activities in the leaves of seven cowpea (Vigna unguiculata) Cultivars. Foods. 2020, 9 (9): 1285. |
| [13] | Martin-Hadmas, R. M., Martin, S. A., Romonți, A. & Marginean, C. O. The Effect of Dietary Intake and Nutritional Status on Anthropometric Development and Systemic Inflammation: An Observational Study. International Journal of Environmental Research and Public Health. 2021, 18(11): 5635. |
| [14] | Hosseini-Esfahani, F., Koochakpoor, G., Mirmiran, P., Ebrahimof, S. & Azizi, F. The association of dietary macronutrients with anthropometric changes, using iso-energetic substitution models: Tehran Lipid and Glucose Study. Nutrition & Metabolism. 2019, 16: 83. |
| [15] | Kassie, A. M., Abate, B. B, Kassaw, M. W. & Aragie, T. G. Prevalence of Underweight and Its Associated Factors among Reproductive Age Group Women in Ethiopia: Analysis of the 2016 Ethiopian Demographic and Health Survey Data. Journal of Environmental and Public Health. 2020, 10. |
| [16] | Awuchi, C. G. I., Ikechukwu, V. S. A. & Echeta, C. K. Health benefits of micronutrients (Vitamins and Minerals) and their associated deficiency diseases: A systematic review. International Journal of Food Sciences. 2020, 3: 1-32. |
| [17] | Herrador, Z., Sordo, L., Gadisa, E., Buno, A., Gómez-Rioja, R., Iturzaeta, J. M., Fernandez, De Armas, L., Benito, A., Aseffa, A., Moreno, J., Canavate, C. & Custodio, E. Micronutrient deficiencies and related factors in school-aged children in ethiopia: A cross-sectional study in libo kemkem and fogera Districts, amhara regional State. Plos One. 2014, 9(12): 112858. |
| [18] |
Stevens, G. A., Bennett, J. E., Hennocq, Q., Lu, Y., De-Regil, L. M., Rogers, L., Danaei, G., Li, G., White, R. A., Flaxman, S. R., Oehrle, S. P., Finucane, M. M., Guerrero, R., Bhutta, Z. A., Then-Paulino, A., Fawzi, W., Black, R. E., & Ezzati, M. Trends and mortality effects of vitamin A deficiency in children in 138 low-income and middle-income countries between 1991 and 2013: A pooled analysis of population- based surveys. The Lancet Global Health. 2015, 3 (9): 528-536.
https://doi.org/10.1016/S2214-109X (15)00039-X |
| [19] | FAO, I. F. A. D, UNICEF, W. F. P. & WHO. The State of Food Security and Nutrition in the World 2023. Urbanization, agrifood systems transformation and healthy diets across the rural-urban continuum. 2023. |
| [20] | Xu, Q., Zhong, C., Tan, T., Lin, L., Yang, H., Xu, Z. & Yang, N. The influence of dietary diversity on anthropometric status among young children ages 12 and 24 months in Wuhan, China. Materntal Child & Nutrition. 2024, 20: 13563. |
| [21] | WHO & UNICEF. WHO Child Growth Standards: Interpretation and measurement guidelines. Geneva: WHO. |
| [22] | Zhang, Y., Zhou, W., Yan, WJ., Liu, M., Zhou, Y., Shen, X., Ma, Y. L., Feng, X. S., Yang, J. & Li, G. A Review of the Extraction and Determination Methods of Thirteen Essential Vitamins to the Human Body: An Update from 2010. Molecules. 2018, 23: 1484. |
| [23] | Sombie, O. O., Zeba, A. N., Some, J. W., Kazienga, A., Grahn, M., Tanumihardjo, S. A., Henauw, S. D. & Abbeddou, S. A comparative study on indicators of vitamin A status and risk factors for sensitivity and specificity of the methods to detect vitamin A deficiency. Nutrition & Metabolism. 2023, 20: 49. |
| [24] | Akpole, J. K., Bleyere, M. N. & Yapo, P. A. Low Anthropometric Indices of Malnutrition in children of school canteen located in Cocody (Abidjan/Cote d’Ivoire). International Journal of Science and Health Care Research. 2016, 1: 1-12. |
| [25] | Amidu, N., Owiredu, W. K. B. A., Saaka, M., Quaye, L., Wanwan, M., Kumibea, P. D., Zingina, F. M. & Mogre V. Determinants of childhood obesity among basic school children aged 6 - 12 years in Tamale Metropolis. Journal of Medical and Biomedical Sciences. 2013, 2: 26-34. |
| [26] | Karki, A., Shrestha, A. & Subedi, N. Prevalence and associated factors of childhood overweight/obesity among primary school children in urban Nepal. BMC Public Health. 2019, 19: 1055. |
| [27] | Saltzman, E., Schlossman, N., Brown, C. A., Balan, I., Fuss, P., Batra, P., Braima, A., Shea, M. K., Pruzensky, W. M., Bale, C. & Roberts, S. B. Nutrition status of primary school students in two rural regions of Guinea-Bissau. Food and nutrition bulletin. 2017, 38: 103-114. |
| [28] | Abizari, A. B., Azupogo, F. & Brouwer, I. D. Subclinical inflammation influences the association between vitamin A- and iron status among schoolchildren in Ghana. Plos one. 2017, 12: 170747. |
| [29] | Imdad, A., Yakoob, M. Y., Sudfeld, C., Haider, B. A., Black, R. E. & Bhutta, Z. A. Impact of vitamin A supplementation on infant and childhood mortality. BMC Public Health. 2011, 11: 20. |
| [30] | Burri, B. J., Chang, J. & Neidlinger, T. B-Cryptoxanthin and a-carotene rich foods have greater apparent bioavailability than b-carotene rich foods in Western diets. British journal of Nutrition. 2011, 105: 212-219. |
| [31] | Tatarowska, B., Milczarek, D., Wszelaczynska, E., Jarosław Poberezny, J., r Keutgen, N., Keutgen, A. J. Bogdan Flis, B. Carotenoids Variability of Potato Tubers in Relation to Genotype, Growing Location and Year. American Journal of Potato Research. 2019, 96(5): 493-504. |
| [32] | Bohn, T. Carotenoids, chronic disease prevention and dietary recommendations. International Journal for Vitamin and Nutrition Research. 2017, 87(3-4): 121-130. |
| [33] | Verger, E. O., Le Port, A., Borderon, A., Bourbon, G., Moursi, M., Savy, M., Mariotti, F. & Martin-Prevel, Y. Dietary Diversity Indicators and Their Associations with Dietary Adequacy and Health Outcomes: A Systematic Scoping Review. Advances in Nutrition. 2021, 12(5), 1659-1672. |
| [34] | Trono, D. Carotenoids in cereal food crops: Composition and retention throughout grains torage and food processing. In Plants. 2019, 8(12): 551. |
APA Style
Allico, M. J. M., Kunindjani, A. K., Ouattara, G. S., Agbo, A. E., Kouame, C., et al. (2026). Impact of Dietary Diversification on the Anthropometric and Vitamin Status of School-Age Children in the Nawa Region (Cote d’Ivoire). International Journal of Nutrition and Food Sciences, 15(6), 324-331. https://doi.org/10.11648/j.ijnfs.20261506.12
ACS Style
Allico, M. J. M.; Kunindjani, A. K.; Ouattara, G. S.; Agbo, A. E.; Kouame, C., et al. Impact of Dietary Diversification on the Anthropometric and Vitamin Status of School-Age Children in the Nawa Region (Cote d’Ivoire). Int. J. Nutr. Food Sci. 2026, 15(6), 324-331. doi: 10.11648/j.ijnfs.20261506.12
AMA Style
Allico MJM, Kunindjani AK, Ouattara GS, Agbo AE, Kouame C, et al. Impact of Dietary Diversification on the Anthropometric and Vitamin Status of School-Age Children in the Nawa Region (Cote d’Ivoire). Int J Nutr Food Sci. 2026;15(6):324-331. doi: 10.11648/j.ijnfs.20261506.12
@article{10.11648/j.ijnfs.20261506.12,
  author = {Mousso Jean Maurel Allico and Adou Koffi Kunindjani and Gninfanni Silvere Ouattara and Adouko Edith Agbo and Christophe Kouame and Allico Joseph Djaman},
  title = {Impact of Dietary Diversification on the Anthropometric and Vitamin Status of School-Age Children in the Nawa Region (Cote d’Ivoire)},
  journal = {International Journal of Nutrition and Food Sciences},
  volume = {15},
  number = {6},
  pages = {324-331},
  doi = {10.11648/j.ijnfs.20261506.12},
  url = {https://doi.org/10.11648/j.ijnfs.20261506.12},
  eprint = {https://article.sciencepublishinggroup.com/pdf/10.11648.j.ijnfs.20261506.12},
  abstract = {In Cote d’Ivoire, there is a disparity between dietary intake and nutritional needs among school-age children. Studies have shown that dietary diversification could offer a solution. A study was therefore conducted to assess the impact of dietary diversification on the anthropometric and vitamin profiles of students in school cafeterias in the Nawa region. This study took place from October 2017 to May 2018 in school cafeterias in 12 localities in the Nawa region. It included 240 school-aged children aged 6 - 12, divided into four groups of 60 students. Four types of meals were offered to the four groups: rice with tomato sauce and fish, sweet potato stew enriched with green soybeans, sweet potato stew enriched with white cowpeas, and sweet potato stew enriched with cowpeas and soybean balls. Anthropometric measurements were based on the standardized method of the World Health Organization and the United Nations Children’s Fund. Concurrently, blood samples were collected before meal consumption (Phase 0), three (3) months later (Phase 1), and six (6) months later (Phase 2). Blood levels of vitamin A were measured using high-performance liquid chromatography (HPLC). In this study, the mean age ranged from 8.62 to 10.25 years, with a significant difference (p < 0.01) between Group 2 (10.25 years) and Group 1 (8.60 years). An increase in the children’s weight, height, and body mass index was observed six months after food consumption. Before the children began eating school meals (phase 0), adequate vitamin A levels were observed. Vitamin A levels decreased in groups 1, 2, and 3 from phase 0 to phase 2. However, they increased in children in group 4 from 0.5 to 0.8 mg/L. In this study, an increase in weight, height, and body mass index was observed among children who consumed the various meals in the study. Furthermore, an improvement in vitamin A status was more pronounced among children who consumed the meal based on sweet potato, soybeans, and cowpeas. This dish could be selected as a suitable option for dietary diversification in school cafeterias.},
 year = {2026}
}
TY  - JOUR
T1  - Impact of Dietary Diversification on the Anthropometric and Vitamin Status of School-Age Children in the Nawa Region (Cote d’Ivoire)
AU  - Mousso Jean Maurel Allico
AU  - Adou Koffi Kunindjani
AU  - Gninfanni Silvere Ouattara
AU  - Adouko Edith Agbo
AU  - Christophe Kouame
AU  - Allico Joseph Djaman
Y1  - 2026/11/12
PY  - 2026
N1  - https://doi.org/10.11648/j.ijnfs.20261506.12
DO  - 10.11648/j.ijnfs.20261506.12
T2  - International Journal of Nutrition and Food Sciences
JF  - International Journal of Nutrition and Food Sciences
JO  - International Journal of Nutrition and Food Sciences
SP  - 324
EP  - 331
PB  - Science Publishing Group
SN  - 2327-2716
UR  - https://doi.org/10.11648/j.ijnfs.20261506.12
AB  - In Cote d’Ivoire, there is a disparity between dietary intake and nutritional needs among school-age children. Studies have shown that dietary diversification could offer a solution. A study was therefore conducted to assess the impact of dietary diversification on the anthropometric and vitamin profiles of students in school cafeterias in the Nawa region. This study took place from October 2017 to May 2018 in school cafeterias in 12 localities in the Nawa region. It included 240 school-aged children aged 6 - 12, divided into four groups of 60 students. Four types of meals were offered to the four groups: rice with tomato sauce and fish, sweet potato stew enriched with green soybeans, sweet potato stew enriched with white cowpeas, and sweet potato stew enriched with cowpeas and soybean balls. Anthropometric measurements were based on the standardized method of the World Health Organization and the United Nations Children’s Fund. Concurrently, blood samples were collected before meal consumption (Phase 0), three (3) months later (Phase 1), and six (6) months later (Phase 2). Blood levels of vitamin A were measured using high-performance liquid chromatography (HPLC). In this study, the mean age ranged from 8.62 to 10.25 years, with a significant difference (p < 0.01) between Group 2 (10.25 years) and Group 1 (8.60 years). An increase in the children’s weight, height, and body mass index was observed six months after food consumption. Before the children began eating school meals (phase 0), adequate vitamin A levels were observed. Vitamin A levels decreased in groups 1, 2, and 3 from phase 0 to phase 2. However, they increased in children in group 4 from 0.5 to 0.8 mg/L. In this study, an increase in weight, height, and body mass index was observed among children who consumed the various meals in the study. Furthermore, an improvement in vitamin A status was more pronounced among children who consumed the meal based on sweet potato, soybeans, and cowpeas. This dish could be selected as a suitable option for dietary diversification in school cafeterias.
VL  - 15
IS  - 6
ER  -
Nutrition Research Centre, National Institute of Public Health, Abidjan, Cote d’Ivoire
Nutrition Research Centre, National Institute of Public Health, Abidjan, Cote d’Ivoire
Department of Biochemistry and Genetics, Peleforo Gon Coulibaly University, Korhogo, Cote d’Ivoire
Food Science and Technology Department, Nangui ABROGOUA University, Abidjan, Cote d’Ivoire;Agricultural Science, International Center of Agroforestry Research, Abidjan, Cote d’Ivoire
Agricultural Science, International Center of Agroforestry Research, Abidjan, Cote d’Ivoire
Health and Biology, Félix Houphouët-Boigny University, Abidjan, Cote d’Ivoire;Fundamental and Medical Biochemistry, Pasteur Institute of Cote d'Ivoire, Abidjan, Cote d'Ivoire

Information


 Share This Article
 Twitter
 Linked In
 Facebook

 Copy
 Download