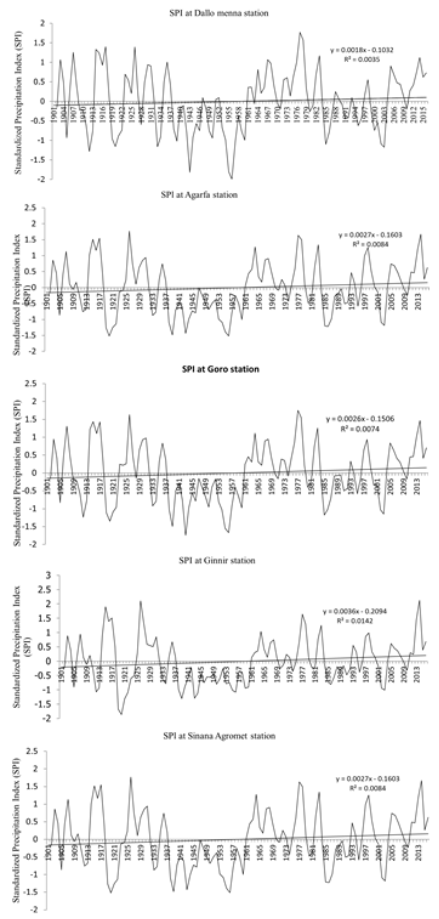
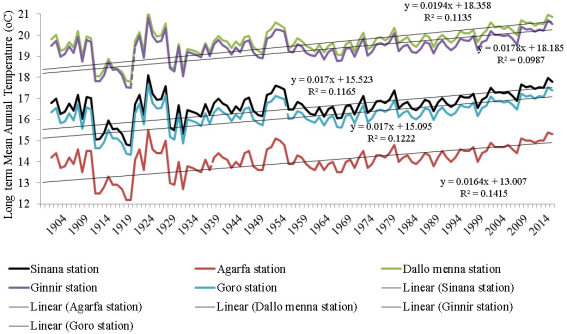
Trend analysis for the long-term average temperature and precipitation of Bale and East Bale Zones during 1901 to 2016 has been performed for selected 5 stations to understand the pattern of these important meteorological features under climate change. The precipitation characterizations viz. standardized Precipitation Index has been considered for Sinana, Goro, Ginnir, Dallo menna and Agarfa stations. This study was aimed to analysis ‘’long term historical climate analysis selected stations in Bale and East Bale zones’’. The study considered station nearby kebeles was selected purposively from highland, midland and lowland districts. Standardized Precipitation Index drought index method was used to classify drought condition of the area. The findings showed that, the average temperature of the district showed an increased in the past three decades whereas the annual precipitation of the districts showed a decreasing trend with some variation from the mean in the period 1901- 2016 which was validated with 1984 – 2016 observed data. In line with this, representative respondents were considered from lowland, highland and midland agro-ecologies. Long term annual mean temperature showed increase trends by 0.17°C per decade at Sinana, Goro, Ginnir and Agarfa stations. Additionally, it was revealed more increment by 0.19°C per decade at Dallo menna station. From long term climate data analysis, it was indicated that extremely wet recorded in 1903, 1914, 1917, 1926, 1977 and 2013, while extremely dry conditions were recorded in 1919, 1938 and 1943 annual precipitation recorded for the whole period has been calculated and interpreted.
| Published in | International Journal of Atmospheric and Oceanic Sciences (Volume 8, Issue 1) |
| DOI | 10.11648/j.ijaos.20240801.12 |
| Page(s) | 24-29 |
| Creative Commons |
This is an Open Access article, distributed under the terms of the Creative Commons Attribution 4.0 International License (http://creativecommons.org/licenses/by/4.0/), which permits unrestricted use, distribution and reproduction in any medium or format, provided the original work is properly cited. |
| Copyright |
Copyright © The Author(s), 2024. Published by Science Publishing Group |
Long-Term, Standardized Precipitation Index, Precipitation, Trend and Variability
EPCC | Ethiopian Panel on Climate Change |
ENSO | ElNino Southern Oscillation |
IOD | Indian Ocean Dipole |
SPI | Standardized Precipitation Index |
DrinC | Drought Indices Calculator |
| [1] | Pal, A. B., Khare, D., Mishra, P. K., & Singh, L. (2017). Trend analysis of precipitation, temperature and runoff data: a case study of Rangoon watershed in Nepal. Int. J. Stud. Res. Technol. Manag. 5, 21-38. ISSN 2321–2543, 5(3), 21–38. |
| [2] | Panda, A., Sahu, N., (2019). Trend analysis of seasonal precipitation and temperature pattern in Kalahandi, Bolangir and Koraput districts of Odisha. India. Atmos. Sci. Lett. 20 (10), e932. |
| [3] | Praveen, B., Talukdar, S., Mahato, S., Mondal, J., Sharma, P., Islam, A. R. M., Rahman, A., (2020). Analyzing trend and forecasting of precipitation changes in India using nonparametrical and machine learning approaches. Sci. Rep. 10 (1), 1–21. |
| [4] | Karmeshu Supervisor Frederick Scatena, Neha N. (2015): “Trend Detection in Annual Temperature & Precipitation Using the Mann Kendall Test – A Case Study to Assess Climate Change on Select States in the Northeastern United States.” Mausam 66, no. 1: 1–6. |
| [5] | Ali, Rawshan, Alban Kuriqi, Shadan Abubaker, and Ozgur Kisi. (2019): “Long-Term Trends and Seasonality Detection of the Observed Flow in Yangtze River Using Mann-Kendall and Sen’s Innovative Trend Method.” Water (Switzerland) 11, no. 9: 18–55. |
| [6] | Noori, Roohollah, Fuqiang Tian, Ronny Berndtsson, Mahmud Reza Abbasi, Mohammadreza Vesali Naseh, Anahita Modabberi, Ali Soltani, and Bjørn Kløve. (2019). “Recent and Future Trends in Sea Surface Temperature across the Persian Gulf and Gulf of Oman.” PLoS ONE 14, no. 2: 2. |
| [7] | Niang, I., O. C. Ruppel, M. A. Abdrabo, A. Essel, C. Lennard, J. Padgham, and P. Urquhart (2014): Africa. In: Climate Change 2014: Impacts, Adaptation, and Vulnerability. Part B: Regional Aspects. Contribution of Working Group II to the Fifth Assessment Report of the Intergovernmental Panel on Climate Change [Barros, V. R., C. B. Field, D. J. Dokken, M. D. Mastrandrea, K. J. Mach, T. E. Bilir, M. Chatterjee, K. L. Ebi, Y. O. Estrada, R. C. Genova, B. Girma, E. S. Kissel, A. N. Levy, S. MacCracken, P. R. Mastrandrea, and L. L. White (eds.)]. Cambridge University Press, Cambridge, United Kingdom and New York, NY, USA, pp. 1199-1265. |
| [8] | Tierney, J. E., Ummenhofer, C. C. & deMenocal, P. B. (2015). Past and future precipitation in the Horn of Africa. Sci. Adv. 1, e1500682–e1500682. |
| [9] | Fer, I., Tietjen, B., Jeltsch, F. & Wolf, C. (2017). The influence of El Niño–Southern Oscillation regimes on eastern African vegetation and its future implications under the RCP8.5 warming scenario. Biogeosciences 14, 4355–4374. |
| [10] | Mpelasoka, F., Awange, J. L. & Zerihun, A. (2018). Influence of coupled ocean-atmosphere phenomena on the Greater Horn of Africa droughts and their implications. Sci. Total Environ. 610–611, 691–702. |
| [11] | Endris, H. S. et al. (2013). Assessment of the Performance of CORDEX Regional Climate Models in Simulating East African Precipitation. J. Clim. 26, 8453–8475. |
| [12] | Endris, H. S. et al. (2015). Teleconnection responses in multi-GCM driven CORDEX RCMs over Eastern Africa. Clim. Dyn. 46, 2821–2846 Wolf, C. et al. (2011). Reduced Interannual Precipitation Variability in East Africa During the Last Ice Age. Science 333, 743–747. |
| [13] | Endris, H. S. et al., (2018). Future changes in precipitation associated with ENSO, IOD and changes in the mean state over Eastern Africa. Clim. Dyn, |
| [14] | Yayeh D, Walter L (2017) Farmers perceptions of climate variability and its adverse impacts on crop and livestock production in Ethiopia. Journal of Arid Environments 140: 20-28. |
| [15] | Martel, J.-L., A. Mailhot, F. Brissette, D. Caya, J.-L. Martel, A. Mailhot, F. Brissette, and D. Caya, 2018: Role of natural climate variability in the detection of anthropogenic climate change signal for mean and extreme precipitation at local and regional scales. J. Climate, 31, 4241–4263, |
| [16] | Deser, C., A. S. Phillips, M. A. Alexander, and B. V. Smoliak, 2014: Projecting North American climate over the next 50 years: Uncertainty due to internal variability. J. Climate, 27, 2271– 2296, |
| [17] |
Schneider, T., and I. M. Held, 2001: Discriminants of twentiethcentury changes in Earth surface temperatures. J. Climate, 14, 249–254,
https://doi.org/10.1175/1520-0442(2001)014 0249: LDOTCC.2.0. CO; 2. |
| [18] | Tsakiris, G., Vangelis, H.: (2004). Towrds a drought watch system based on spatial SPI Water Resource Management: 18(1) 1-12. |
| [19] | Ethiopian panel on Climate Change (2015). First Assessment Report, Working Group I Physical Science Basis, Published by the Ethiopian Academy of Sciences. |
APA Style
Tufa, Z. D., Bekele, W., Abebe, H., Bultuma, B., Mengistu, B. (2024). Long Term Historical Precipitation and Temperature Trend Analysis for Selected Stations in Bale and East Bale Zones of Southeastern Ethiopia. International Journal of Atmospheric and Oceanic Sciences, 8(1), 24-29. https://doi.org/10.11648/j.ijaos.20240801.12
ACS Style
Tufa, Z. D.; Bekele, W.; Abebe, H.; Bultuma, B.; Mengistu, B. Long Term Historical Precipitation and Temperature Trend Analysis for Selected Stations in Bale and East Bale Zones of Southeastern Ethiopia. Int. J. Atmos. Oceanic Sci. 2024, 8(1), 24-29. doi: 10.11648/j.ijaos.20240801.12
AMA Style
Tufa ZD, Bekele W, Abebe H, Bultuma B, Mengistu B. Long Term Historical Precipitation and Temperature Trend Analysis for Selected Stations in Bale and East Bale Zones of Southeastern Ethiopia. Int J Atmos Oceanic Sci. 2024;8(1):24-29. doi: 10.11648/j.ijaos.20240801.12
@article{10.11648/j.ijaos.20240801.12,
  author = {Zerihun Dibaba Tufa and Wondmagegn Bekele and Hirpa Abebe and Bacha Bultuma and Bikila Mengistu},
  title = {Long Term Historical Precipitation and Temperature Trend Analysis for Selected Stations in Bale and East Bale Zones of Southeastern Ethiopia
},
  journal = {International Journal of Atmospheric and Oceanic Sciences},
  volume = {8},
  number = {1},
  pages = {24-29},
  doi = {10.11648/j.ijaos.20240801.12},
  url = {https://doi.org/10.11648/j.ijaos.20240801.12},
  eprint = {https://article.sciencepublishinggroup.com/pdf/10.11648.j.ijaos.20240801.12},
  abstract = {Trend analysis for the long-term average temperature and precipitation of Bale and East Bale Zones during 1901 to 2016 has been performed for selected 5 stations to understand the pattern of these important meteorological features under climate change. The precipitation characterizations viz. standardized Precipitation Index has been considered for Sinana, Goro, Ginnir, Dallo menna and Agarfa stations. This study was aimed to analysis ‘’long term historical climate analysis selected stations in Bale and East Bale zones’’. The study considered station nearby kebeles was selected purposively from highland, midland and lowland districts. Standardized Precipitation Index drought index method was used to classify drought condition of the area. The findings showed that, the average temperature of the district showed an increased in the past three decades whereas the annual precipitation of the districts showed a decreasing trend with some variation from the mean in the period 1901- 2016 which was validated with 1984 – 2016 observed data. In line with this, representative respondents were considered from lowland, highland and midland agro-ecologies. Long term annual mean temperature showed increase trends by 0.17°C per decade at Sinana, Goro, Ginnir and Agarfa stations. Additionally, it was revealed more increment by 0.19°C per decade at Dallo menna station. From long term climate data analysis, it was indicated that extremely wet recorded in 1903, 1914, 1917, 1926, 1977 and 2013, while extremely dry conditions were recorded in 1919, 1938 and 1943 annual precipitation recorded for the whole period has been calculated and interpreted.
},
 year = {2024}
}
TY  - JOUR
T1  - Long Term Historical Precipitation and Temperature Trend Analysis for Selected Stations in Bale and East Bale Zones of Southeastern Ethiopia

AU  - Zerihun Dibaba Tufa
AU  - Wondmagegn Bekele
AU  - Hirpa Abebe
AU  - Bacha Bultuma
AU  - Bikila Mengistu
Y1  - 2024/09/20
PY  - 2024
N1  - https://doi.org/10.11648/j.ijaos.20240801.12
DO  - 10.11648/j.ijaos.20240801.12
T2  - International Journal of Atmospheric and Oceanic Sciences
JF  - International Journal of Atmospheric and Oceanic Sciences
JO  - International Journal of Atmospheric and Oceanic Sciences
SP  - 24
EP  - 29
PB  - Science Publishing Group
SN  - 2640-1150
UR  - https://doi.org/10.11648/j.ijaos.20240801.12
AB  - Trend analysis for the long-term average temperature and precipitation of Bale and East Bale Zones during 1901 to 2016 has been performed for selected 5 stations to understand the pattern of these important meteorological features under climate change. The precipitation characterizations viz. standardized Precipitation Index has been considered for Sinana, Goro, Ginnir, Dallo menna and Agarfa stations. This study was aimed to analysis ‘’long term historical climate analysis selected stations in Bale and East Bale zones’’. The study considered station nearby kebeles was selected purposively from highland, midland and lowland districts. Standardized Precipitation Index drought index method was used to classify drought condition of the area. The findings showed that, the average temperature of the district showed an increased in the past three decades whereas the annual precipitation of the districts showed a decreasing trend with some variation from the mean in the period 1901- 2016 which was validated with 1984 – 2016 observed data. In line with this, representative respondents were considered from lowland, highland and midland agro-ecologies. Long term annual mean temperature showed increase trends by 0.17°C per decade at Sinana, Goro, Ginnir and Agarfa stations. Additionally, it was revealed more increment by 0.19°C per decade at Dallo menna station. From long term climate data analysis, it was indicated that extremely wet recorded in 1903, 1914, 1917, 1926, 1977 and 2013, while extremely dry conditions were recorded in 1919, 1938 and 1943 annual precipitation recorded for the whole period has been calculated and interpreted.

VL  - 8
IS  - 1
ER  -
Oromia Agricultural Research Institute, Sinana Agricultural Research Center, Bale-Robe, Ethiopia
Research Fields: Climate data preparation, Precipitation trend analysis, Temperature trend analysis, Climate variability analysis, standardized Precipitation Index
Information