2. Materials and Methods
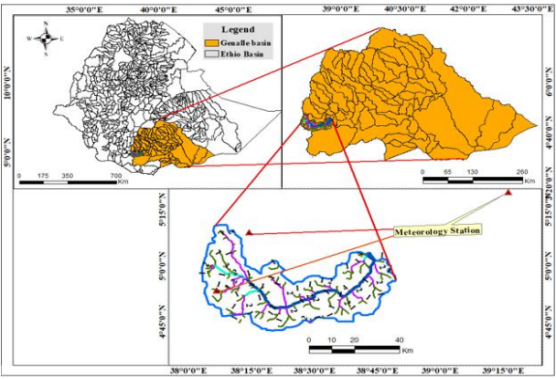
2.1. Description of the Study Area
The location of the Dawa River watershed is 38
0 2' 48' to 41
0 2' 34''E and 4
0 5'8'' to 6
0 27' 18''N (
Figure 1) It makes up a portion of Ethiopia's southeast highlands and is located 567 kilometers southwest of Addis Ababa. The Dawa River Sub-watershed is located in East Africa and flows through Kenya, Ethiopia, and Somalia, with 81% falling into Ethiopian territory.
Figure 1. Location Map of the Study area (Source: Ethiopian Geospatial Map, 2016).
Table 1. Summary of the meteorological stations.
Station name | Data Length | Elevation (m) | Latitude (o) | Longitude (o) | Rainfall (mm) | Temp. (°C) | Missed (%) | Remark |
Yabello | 1990-2020 | 1729 | 4.89 | 38.10 | 651 | 19.8 | 8.47 | Filled |
Hageremariam | 1990-2020 | 1729 | 5.15 | 38.23 | 947 | 19.5 | 5.55 | Filled |
Kibre Mengist | 1990-2020 | 1861 | 5.86 | 38.96 | 1673 | 19.4 | 7.56 | Filled |
Negalle | 1990-2020 | 1439 | 5.33 | 39.26 | 710 | 20.9 | 6.54 | Filled |
Oda Shakiso | 1990-2020 | 1620 | 5.83 | 38.96 | 1020 | 18.5 | 9.45 | Filled |
Mega | 1990-2020 | 1607 | 4.03 | 38.33 | 720 | 19.5 | 7.54 | Filled |
2.2. Generation of Climate Data
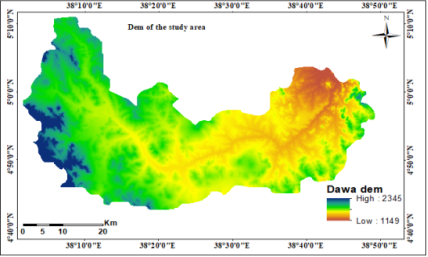
To investigate the catchment-drainage networks, the DEM was used to provide a variety of data that helped produce a map of the landforms, soil types, and hydrologic information. The topography of the study areas is typically represented by a 12.5m by 12.5m Digital Elevation Model (DEM) acquired from the SRTM.
Figure 2. DEM of study area.
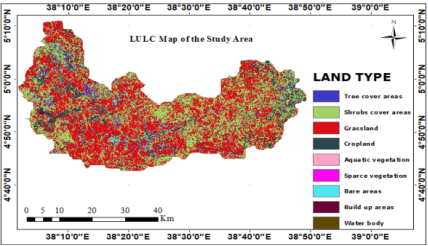
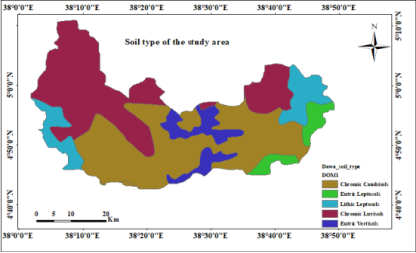
Table 2. LULC and soil classification and area covered by watershed.
LULC | Soil |
LULC type | Area (ha) | Area (%) | Soil type | Code | Area (ha) | Area (%) |
Tree cover | 10112 | 4.3 | Chromic Cambisols | CMx | 98032 | 41.5 |
Shrubs cover | 86543 | 36.7 | Chromic Luvisols | LXx | 85854 | 36.3 |
Grassland | 110428 | 46.9 | Lithic Leptosols | LPq | 24630 | 10.4 |
Cropland | 24863 | 10.6 | Eutric Vertisols | VRe | 17408 | 7.4 |
Flooded | 4.54 | 0.002 | Eutric Leptosols | LPe | 10506 | 4.4 |
Sparse vegetation | 62.95 | 0.03 | | | | |
Bare areas | 3518 | 1.5 | | | | |
Build up areas | 204 | 0.1 | | | | |
Waterbody | 30 | 0.01 | | | | |
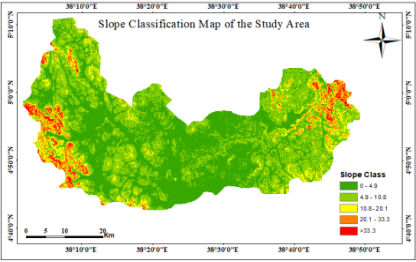
Figure 5. Slope classification study area.
Slope and Elevation Zone
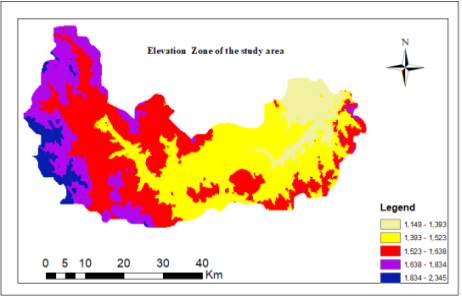
The slope has demonstrated this in many ranges in the study region. It covers a wide range of values throughout the entire research watershed. The elevation zone has demonstrated this in many ranges in the study region. It covers a wide range of values in the entire watershed.
Table 3. Division of watershed into different elevation zones.
| Elevation ranges (m) | |
Zone | Min | Max | Elevation |
1 | 1149 | 1393 | 574.5 |
2 | 1393 | 1523 | 761.5 |
3 | 1523 | 1638 | 1535.5 |
4 | 1638 | 1834 | 1736 |
5 | 1834 | 2345 | 2089.5 |
Figure 6. Elevation of study area.
2.3. Methods and Analysis of Data Collection
The base period of required meteorological data of daily precipitation and maximum and minimum temperature was collected from the NMA office and downloaded from the CORDEX East Africa database using an ensemble of RCM model output. Observation data for the modelling of the work, such as monthly meteorological data over 30 years from 1976 to 2020 obtained from NMSA. Historical precipitation and temperature data for the same period (1976 2005) were retrieved from an ensemble of RCM GCMs. The RCM GCM simulations run in the framework of the Coordinated Regional Climate Downscaling Experiment (CORDEX Africa, https://cordex.org/. Future temperature and precipitation projections for the period 2020 (2025 2054) and 2050 (2055 2084) were retrieved from the same RCM GCM combinations. The Representative Concentration Pathways RCP 4.5 and RCP 8.5
| [23] | Richard H. Moss, Jae A. Edmonds, Kathy A. Hibbard, Martin R. Manning, Steven K. Rose, Detlef P. van Vuuren, Timothy R. Carter, Seita Emori, Mikiko Kainuma, Tom Kram, Gerald A. Meeh, John F. B. Mitche, Nebojsa Nakicenovic, Keywan Riahi, Steven J. Smith, Ronald J. Stouffer, Allison M. Thomson, John P. Weyant & Thomas J. Wilbanks 2010 “The next generation of scenarios for climate change research and assessment,” Nature, 463(7282), pp. 747 756. https://doi.org/10.1038/nature08823 |
[23]
were used for future scenarios for the study areas. Most of the models were limited to the simulation of local precipitation, although other variables, such as temperature, humidity, and wind are usually required for hydrological simulations. Long-term precipitation patterns in Ethiopia are difficult to determine due to high unpredictability; nonetheless, an overall drop was recorded in the last three to four decades, with significant year-to-year fluctuation.
2.4. Models and Software Used
ArcGIS 10.4 version used for extracting study area, LULC, soil type, elevation and Ensembles of RCM model output for impact assessment, CMhyd software for both extraction and bias correction of CORDEX climate data, and XLSTAT for homogeneity test used to achieve the study's goal. In addition to the model two scenarios, RCP4.5 and RCP 8.5 used. This is due to RCP4.5 as a medium stabilization scenario and RCP8.5 as a pessimistic and the latest climate scenario. The maximum and minimum temperatures were interpolated using liner interpolation and the arithmetic mean method for precipitation data. As a result, future climate change scenarios, an ensemble of RCM model output retrieved via two emission scenarios RCP4.5 and RCP8.5 from Cordex Africa. As cited by Gebrie Geremew and Engida Agizew (2015) the grounds for choosing these two scenarios are that RCP4.5 presents an intermediate emission scenario and RCP8.5 shows a high emission scenario of GHG concentrations, and most previous research has been done using these scenarios, for example
| [12] | Gebrie Geremew and Engida Agizew (2015) Climate Modeling of the Impact of Climate Change on Sugarcane and Cotton for Project on ‘a Climate Resilient Production of Cotton and Sugar in Ethiopia’ By Geremew Sahilu Gebrie (PhD) Addis Ababa, Ethiopia. Addis Ababa. |
[12]
. Thus, in this work, the ensemble of RCM model output is used to generate future scenarios utilizing RCP4.5 and RCP8.5 scenarios.
2.5. Goodness of Fit Tests
The goodness of fit test is a statistical technique used to determine whether sample data fits a distribution from a certain population. It evaluates how well-observed data align with the expected values from a statistical model. A high goodness of fit indicates that the observed values are close to the model’s expected values; while a low goodness of fit shows that, the observed values are relatively far from the expected values. A goodness of fit measure summarizes the size of the differences between the observed data and the model’s expected values, and a goodness of fit test determines whether the differences are statistically significant
| [14] | Gunavathi S (2021) ‘Assessment of Various Bias Correction Methods on Precipitation of Regional Climate Model and Future Projection’. |
[14]
.
2.6. Root Mean Square Error
The optimal bias Correction techniques were determined using statistical GOF tests. Here is a list of the terms used to describe RMSE and PBIAS GOF tests: Yt and Ft represent observed and simulated climatology at time unit t, Y and F represent the mean of observed and simulated climatology over the entire period, and n represents the total number of years in the dataset. It is the most commonly used error statistics test. The RMSE value closer to zero indicates better performance of the model. The RMSE value is given by the following equation:
(1)
Where n is the total number of years in the dataset, and Yt and Ft stand for observed and simulated climatology at time unit t.
2.7. Percent of Bias and Bias Correction Methods
It provides a hint as to the error's general propensity in the simulated data. The accuracy of the model simulation increases with the magnitude of PBIAS's distance from zero. Positive.
PBIAS values imply an underestimation of model bias, whereas negative values denote an overestimation of bias. The PBIAS result is presented as a percentage and as follows:
(2)
The formulas used for rainfall and temperature bias correction are indicated in the Equations below respectively
Where Pbc is bias-corrected future rainfall amount in mm, PP is predicted future rainfall amount in mm, Po is the mean of observed rainfall amount in mm, and Pr is the mean of computed downloaded rainfall during the observation period in mm. Tbc is the bias-corrected future temperature in°C; Tp is the predicted future temperature (°C); To is the mean of observed temperature in°C; Tr is the mean of computed downloaded temperature during the observed period in°C. Furthermore, correction factors for both precipitation and temperature were computed for each month using the Mean Absolute Error (MAE) method. A positive difference means that the downloaded value is wetter /warmer than the observed precipitation/temperature values for that specific locality. The average monthly precipitation and temperature difference between the observations and the simulation given by the equation:
(5)
(6)
where, MAE = Mean Absolute Error; N = the number of months; Psimu, i = the precipitation for projection at month i and; Pobs, i = the precipitation for the observations at month i; Tsimu, i = temperature for projection at month i and; Tobs, i = temperature for the observations at month i.
2.8. Coefficient of Variation
To assess the inter-annual variability of seasonal and annual rainfall, the CV was used to determine the rainfall variability for the meteorological station:
Where, CV= coefficient of variations, δ = standard deviation, and ẋ= mean. When CV < 20% indicates low rainfall variability, CV between 20%to 30% indicates moderate rainfall variability, CV > 30% indicates high rainfall variability, CV > 40% very high rainfall variability, and CV >70% indicates extremely high rainfall inter-annual variability of rainfall as used by
| [8] | Duba, G. W., Demissie, S. T., & Emiru, T. S. (2021). Meteorological Droughts from 1987–2017 in Yabello and El-Woye Areas of Borana, Oromia Region, Ethiopia. Ethiopian Journal of Social Sciences, 7(1). |
[8]
.
3. Results and Discussions
3.1. Data Quality Control and Adjustments for Further Investigations
Homogeneity Test
Table 4. Summary Statistics of Standard Normal Homogeneity Test.
Station | Variable | Observation | Mean | Standard deviation | Statistics derives | Alpha | P-value |
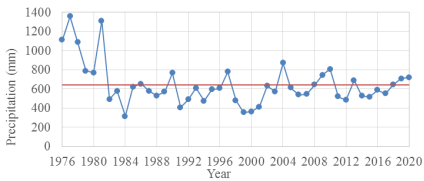
Yabello | Rainfall | 45 | 644.3 | 133.5 | 4.90 | 0.05 | 0.219 |
Figure 7. Homogeneity test for Yabello rainfall stations.
Before the climatic data used for further use and research, the missing data filled in utilizing a variety of ways before employing meteorological stations for additional research, it is essential to evaluate the homogeneity. Using the XLSTAT 2022 program, the Standard Normal Homogeneity test (SNHT) was used to evaluate the homogeneity of annual rainfall data for a station. According to the table below, the bigger p-value from significance level alpha and the red horizontal broken line in the figure reflect rainfall station homogeneity.
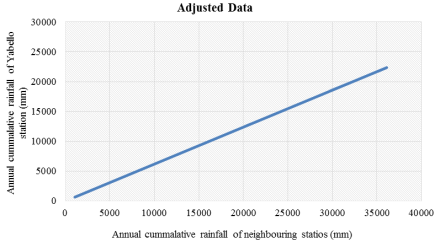
Consistency Test
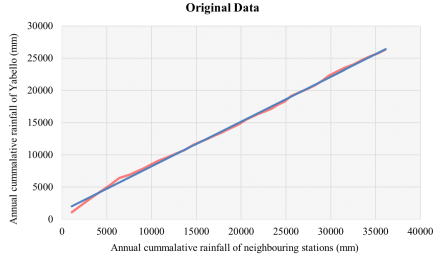
Figure 8. Graph of consistency test of the stations before correction.
Figure 9. Graph of consistency test of the stations after correction.
The consistency of selected rainfall stations was used as a two-fold/double mass curve analysis approach to check. To test the consistency of the meteorological data with neighboring meteorological stations and to see the uniformity, it was checked with double mass curve analysis (Subramanian, 1998). The accumulated totals of the gauge in question are compared with the corresponding totals for a group of nearby gauge stations. If a significant change in the regime of the curve is observed, it has to be corrected. For this study, the collected data was inconsistent as depicted in
Figure 8 and adjusted as shown in
Figure 9 before further investigations.
Criteria for Bias Correction Methods
The results of the determination of the percent of biases and RMSE for precipitation and temperature are shown in
Tables 5. The difference between the observed and the adjusted control data was calculated by RMSE. According to the data, Delta change strategy appears to have no mistake with observed data, although the Power transformation of precipitation and Linear scaling approaches have considerably lower deviations of 0.032 and 0.078, respectively. Contrarily, the Distribution mapping method has a low variance, whereas the Precipitation local intensity scaling approach has a relatively high deviation of 98.94. Therefore, it may concluded that the Power transformation of the precipitation bias correction method outperforms others. This result is agreed with the findings of
| [14] | Gunavathi S (2021) ‘Assessment of Various Bias Correction Methods on Precipitation of Regional Climate Model and Future Projection’. |
[14]
. In light of the aforementioned findings, the Delta change technique should not employed for this work because it equalized the observation data with the present state. It has been shown in almost all of the investigations that the linear scaling and PT techniques have good agreement with the observed data. Although mean biases are taken into account by linear scaling, variance biases are not addressed. It is therefore possible to conclude that the Power transformation of the precipitation technique can used to change the study's future estimations for rainfall. This work is supported by
| [14] | Gunavathi S (2021) ‘Assessment of Various Bias Correction Methods on Precipitation of Regional Climate Model and Future Projection’. |
[14]
. The amount of rainfall decreased by 0.066 mm using the linear scaling approach and by 0.082 mm using the power transformation of precipitation, which demonstrates negative bias. The amount of rainfall had decreased by 85.83 mm by the Precipitation local intensity scaling approach, which likewise has a large negative bias. The amount of rainfall was increased by 36.31 mm by the Distribution mapping approach, which produces a high positive bias. According to the bias calculation, the Power transformation of the precipitation approach and the Linear scaling method are thought to be the best agreements for temperature fit and bias correction, respectively. The same procedure for the temperature linear scale was selected with an RMSE of 0.051 and PBIAS was 0.035. This result agreed with the findings of
| [14] | Gunavathi S (2021) ‘Assessment of Various Bias Correction Methods on Precipitation of Regional Climate Model and Future Projection’. |
[14]
are used to describe RMSE and PBIAS. The Power Transformation of the Precipitation Method for Precipitation and Linear Scaling Methods for Temperature selected based on GOF test criteria as
Table 5.
Table 5. RMSE and PBIAS for bias correction methods for Precipitation.
Bias correction Methods | Precipitation | Temperature |
RMSE | PBIAS | RMSE | PBIAS |
Linear scaling (multiplicative) | 0.078 | -0.066 | 0.051 | -0.035 |
Precipitation local intensity scaling | 98.94 | -85.83 | 75.85 | -64.5 |
Power transformation of precipitation | 0.032 | -0.082 | 35.8 | 45.6 |
Distribution mapping of prec. and temp. | 28.92 | 36.31 | 0.091 | -0.065 |
Delta change correction | 0.0 | 0.0 | 0.0 | 0.0 |
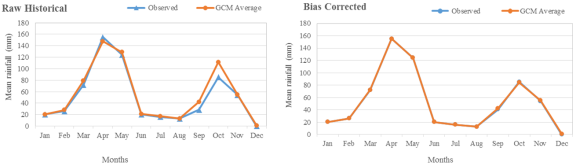
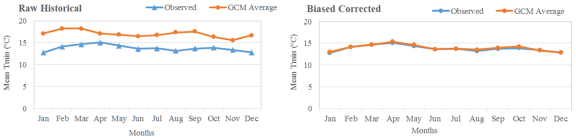
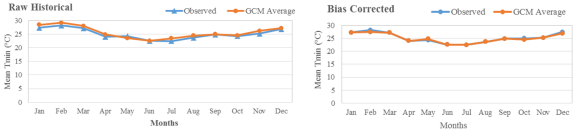
3.2. Regional Climate Model Improvements with Bias Correction
When compared to the average mean monthly rainfall and temperatures (
Figure 10 on the left panel), the outputs of the raw regional climate models underestimate and overestimate the mean monthly rainfall and temperatures, respectively. The Power Transformation of Precipitation Method for Precipitation and Linear Scaling Methods for Temperature in
Figures 11 and 12 on the right exhibit good agreement and provide suitable correction for these outputs respectively. This suggests that the model's bias-corrected output accurately depicts the research area's representativeness. This work complies with an agreement with
| [5] | Boru, G. F. and Regassa, F. D. (2020) ‘Impact of Climate Change on Irrigated Crop Water Use of Selected Major Grown Crops and Water Demand for Irrigation: a Case of Anger Sub-Basin, Nile Basin of Ethiopia’, International Journal of Engineering Applied Sciences and Technology, 04(09), pp. 452–464. Available at: https://doi.org/10.33564/ijeast.2020.v04i09.062 |
[5]
.
Figure 10. A comparison of the simulated and observed mean monthly rainfall before and after bias adjustment can be seen on the left and right.
Figure 11. Comparison of bias-corrected mean monthly Tmin before (left side) and after (right side) simulation and observation.
Figure 12. Comparison of bias-corrected simulated and observed mean monthly Tmax before (left side) and after (right side).
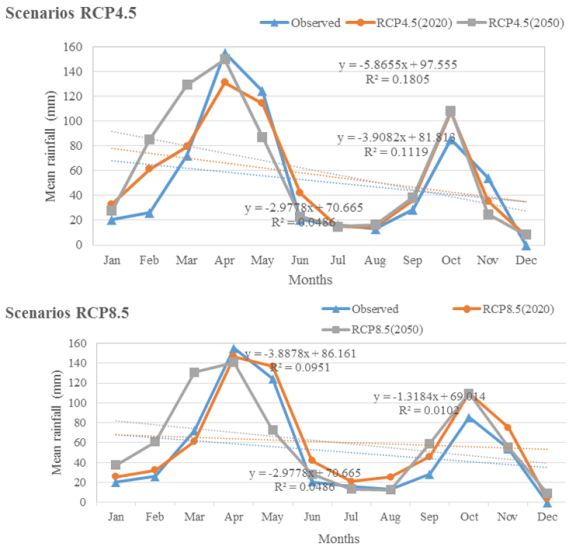
3.3. Predicted Future Rainfall with Comparison to the Baseline Period
Rainfall was calculated using bias-corrected future climate data for the base period and the 2020 and 2050 climate scenarios (
Figure 13). The outcome demonstrates that rainfall ranges between 0 to 155, 7.58 to 131.1, and 8.3 to 149.8 mm per month for the base period, RCP4.5 (2020) and 2050, with the lowest and highest values recorded in December and April, respectively. Similarly, for the same above base period, RCP8.5 (2020) and 2050, respectively, range from 3.9 to 146.5, and 9.2 to 140.8 mm/month.
Figure 13. Rainfall at base period, 2020 and 2050 scenarios periods in the study area.
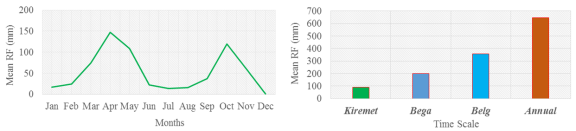
3.4. Variability and Trends of Monthly, Seasonal and Annual Observed Rainfall
Rainfall varies greatly on a yearly and monthly basis, with six months mean January, February, June, July, August, and December out of the twelve months receiving less than 20 mm per month on average from 1991-2020. On the other side, April, followed by October, is the month with the highest mean rainfall (147.2 mm), during the same period (119.6 mm). This works concedes with work of
| [30] | Worku, M. A., Feyisa, G. L. and Beketie, K. T. (2022a) ‘Climate trend analysis for a semi-arid Borana zone in southern Ethiopia during 1981–2018’, Environmental Systems Research, 11(1). Available at: https://doi.org/10.1186/s40068-022-00247-7 |
[30]
. Rainfall in Yabello is highly variable, as indicated by the computed CV value of 34.45%, while the coefficient of variation for all months spans between 49.4 to 387.5%. Particularly, the CV values that exceed 100% for the research area's months of January, February, March, June, July, August, and December show that rainfall has an exceptionally high inter-annual variability due to CV>70% These findings are consistent results with those reported by
| [8] | Duba, G. W., Demissie, S. T., & Emiru, T. S. (2021). Meteorological Droughts from 1987–2017 in Yabello and El-Woye Areas of Borana, Oromia Region, Ethiopia. Ethiopian Journal of Social Sciences, 7(1). |
[8]
. During March, October, and November, the rainfall trend significantly increased (P-value > 0.05) (
Figure 14). The slope estimations for March, October, and November showed 0.46, 0.3, and 0.46 respectively. These months show the largest changes in magnitude. For the remaining months over the research years, there is no monotonic trend (P
value > 0.05) except for January, February August and October. This discovery is consistent with those that have been reported by
| [19] | National meteorological Agency, (NMA) (2005) ‘National meteorological services agency agrometeorological bulletin seasonal agro meteorological bulletin’, 15(3), pp. 1–19. |
[19]
. The seasonal distribution of rainfall reveals that
Birra/Belg (February to May), which recorded a mean precipitation of 355.9 mm, is followed by
Bona (October to January), which experienced a mean record of 198.4 mm. However,
Ganna (June to September) was the period for the lowest with 89.9mm.
Figure 14. Mean monthly, seasonal and annual observed RF in Yabello.
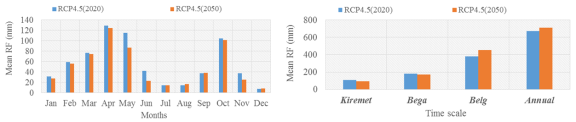
3.5. Variability and Trends of Predicted Monthly, Seasonal and Annual Rainfall
Rainfall varies monthly, with July, August, and December receiving less than 20 mm per month on average for both RCP (4.5) 2020 and 2050. On the other side, April is the month with the highest mean rainfall 131.1 and 149.8 mm respectively for both scenarios. Rainfall is highly variable, as indicated by the computed CV value of 31.4% on an annual basis, while the coefficient of variation for all months spans between 49.7 to 183.4% for RCP4.5 (2020) and the computed CV value of 27% is moderate rainfall variability and coefficient of variation for all month’s spans 54.8 to 214.2 for RCP4.5 (2050). Particularly, the CV values that exceed 100% for January, February, July, August, November and December show that rainfall has an exceptionally high inter-annual variability due to CV>70% for both scenarios (
Figure 15).
Figure 15. Mean monthly, Seasonal and Annual rainfall in the study area.
The amount of rainfall varies seasonally and geographically throughout the area. The seasonal distribution of rainfall reveals that
Belg (February to May), which recorded a mean rainfall of 386.3mm, is followed by
Bega (October to January), which experienced a mean record of 182.8 mm. However,
Kiremt (June to September) was the period for the next 2020 with 107.8mm (
Figure 16). As a result, there are three different seasons in the study area, and the rainfall that occurs throughout these seasons had brought on by southeasterly winds delivering moisture from the Indian Ocean. On the other hand, despite.
Arfasa season (33.8%) has a significant variability of rainfall, while
Ganna (64.7%) and
Bona (47.5%) have higher variability.
Ganna season followed by
Bona was the lowest/driest season in the study area and rainfall is highly variable during
Ganna exhibited the highest coefficient of variation respectively. The Mann–Kendall (MK) statistical test shows a statistically significant trend during the
Arfasa season for both scenarios.
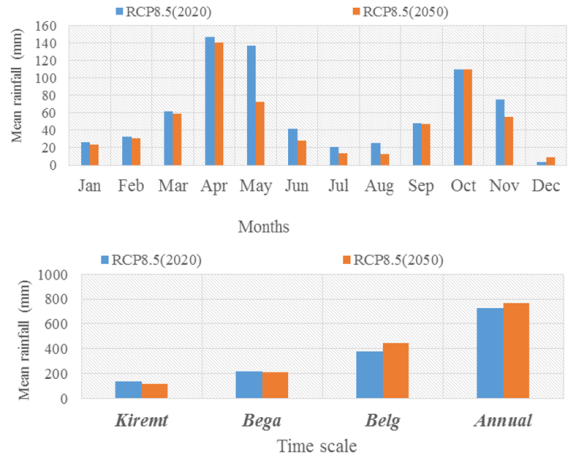
The second rainy season in Ethiopia is known as the
Belg. The western and southern regions of the country receive more than 300mm of seasonal total rainfall, whereas the rest of the country has dry conditions
| [20] | NMA (2022) Climate Diagnostic Bulletin of Belg (February to May) 2022. Addis Ababa. |
[20]
. From 2021 and 2050, the study region experienced a mean annual rainfall of 676.9 mm, with the peak rainfall occurring in 2038 (1220.8 mm). In 2027 (1120.3 mm) and in 2043 came next (965.4 mm). On the other hand, 2034, with 330 mm annually, was the lowest one. Throughout the examined period, there was somewhat high variable rainfall with a 31.4% coefficient of variation (
Figure 16) for RCP4.5 (2020). Rainfall is highly variable, with a computed CV value of 37.3% on an annual basis, while the coefficient of variation for all month’s spans between 37.7 to 293.7% for RCP8.5 (2020) and the computed CV value of 45.5% is very high rainfall variability and coefficient of variation for all months’ spans between 29.1 to 256.1for RCP8.5 (2050).
Figure 16. Monthly, Seasonal and Annual rainfall distribution in the study area (2021-2080).
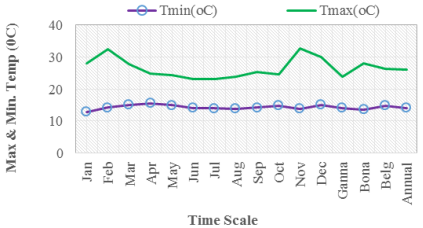
3.6. Variability and Trends of Monthly, Seasonal and Annual Maximum and Minimum Observed Temperature
According to the mean T
max data, the highest month was February (32.4°C), which was followed by January (29.9°C) and March (29.8°C), while the lowest mean T
max was recorded in July (23°C). T
max exhibits a significant upward trend at the 5% level of significance (P-value 0.05). In the research area, every month displays an upward trend (
Figure 17). On the other side, for the entire period, February had the highest mean T
min (16.2°C), followed by March (15.9°C). Aside from this, July had the lowest mean T
min (13.9°C). The MK test result showed that T
min had a significant increasing positive trend (P-value 0.05) in March, April, May, June, July, August, September, October, and November, with a change in magnitude that was roughly comparable (
Figure 17).
Figure 17. Mean monthly Tmax and Tmin in the study area (1991–2020).
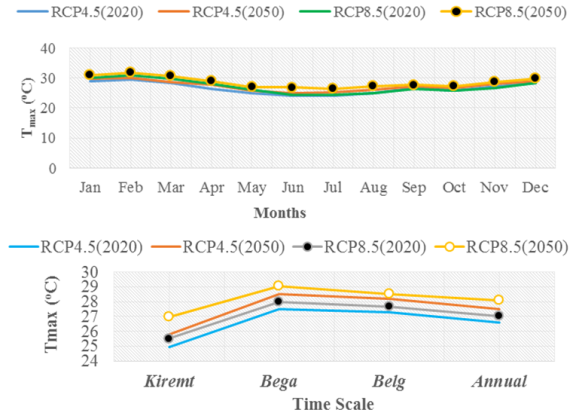
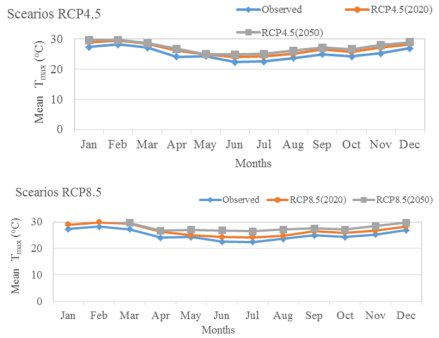
3.7. Variability and Trends of Monthly, Seasonal and Annual Predicted Maximum Temperature
Figure 18 for mean T
max shows that February was the highest month (29.4°C) followed by January (29°C) and March (28.5°C) whereas the minimum mean T
max was observed during July (24.2°C) for RCP4.5 (2020) (
Figure 18). On the other hand, the highest mean T
max for RCP4.5 (2050) was observed in February (30°C) followed by January (29.6°C) during the entire period. Apart from this, the lowest mean T
max was estimated in June (24.8°C). The MK test result revealed all months have shown a significant increasing trend (P-value < 0.05) except in October for RCP4.5 (2050). The increase in the next months showed a monotonic trend. The results for mean T
max show that February was the largest (30.8°C) followed by January (29.9°C) and March (29.8°C) whereas the lowest mean T
max was observed during July (26.4°C) for RCP8.5 (2020) (
Figure 18). On the other hand, the highest mean Tmax for RCP8.5 (2050) was observed in February (31.7°C) followed by January (30.8°C) during the entire period. Apart from this, the lowest mean T
max was recorded in July (26.4°C). The MK test result revealed that all months have shown a significant increasing trend (P
value < 0.05) for both RCP8.5 scenarios. An increasing monotonic trend was detected during the rest of the months.
Bona (winter
) is the season with the most warmth in the research area is mean T
max of 27.5°C and 28.5°C whereas
Ganna (summe
r) is characterized by a relatively lowest mean of 25°C and 25.8°C for RCP4.5 (2020) and RCP4.5 (2050) respectively. Similarly, the mean T
max for RCP8.5 (2020) and RCP8.5 (2050) for
Bona was 28 and 29°C respectively and for
Ganna 25.5 and 27°C respectively. The mean T
max observed is relatively the highest and followed by
Birra were (27.3 and 28.2°C) for RCP4.5 (2020) and RCP4.5 (2050) respectively and for RCP8.5 (2020) and RCP8.5 (2050) was (27.6 and 28.5°C) respectively as shown in
Figure 18.
Figure 18. Mean monthly Tmax in Yabello station (2021-2080).
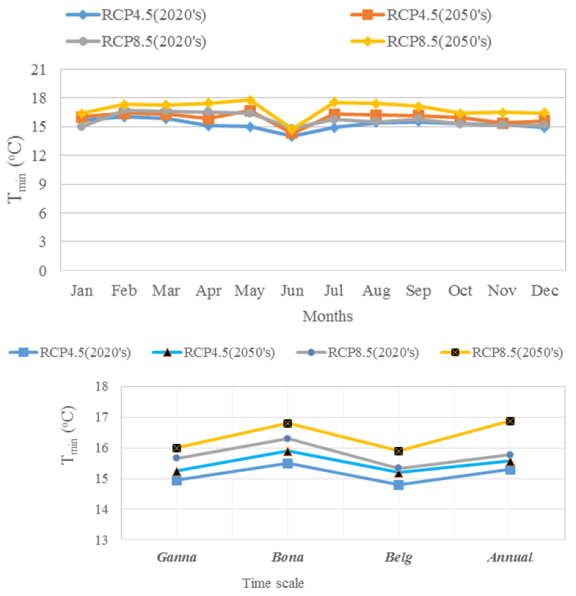
3.8. Variability and Trends of Monthly, Seasonal and Annual Predicted Minimum Temperature
The results for mean T
min show that February was the highest month (16°C) followed by March (15.8°C) whereas, the lowest mean T
min was observed during July (14°C) for RCP4.5 (2020). T
min demonstrates a strong upward trend (P value 0.05) at a 5% level of significance. All months show an increasing trend in the study area (
Figure 19). On the other hand, the highest mean T
min for RCP4.5 (2050) was observed in February (16.4°C) followed by March (16.3°C) for the full-time period. In addition, the lowest mean T
min value was noted in June (14.3°C). The MK test result revealed all months have shown a significant increasing trend (P-value<0.05) except in October for RCP4.5 (2050). The results for mean T
min show that February was the highest month (16.7°C) followed by January (16.6°C) whereas the lowest mean T
min was observed during June (14.8°C) for RCP8.5 (2020). T
min shows a significant increasing trend (P-value<0.05) at a 5% level of significance. All months show an increasing trend in the study area. On the other hand, the highest mean T
min for RCP8.5 (2050) was observed in February (19.3°C) followed by January (17.2°C) for the full period. In addition, the lowest mean T
min was noted in June (14.7°C). The MK test result revealed that all months have shown a significant increasing trend (P
value < 0.05) for RCP8.5 (2050).
The study area's warmest season,
Bega (Bona), has a mean T
min of 15.5°C and 15.9°C whereas
Ganna (Kiremt) is characterized by a relatively lowest mean of 14.9°C and 15.3°C for RCP4.5 (2020) and RCP4.5 (2050) respectively. Similarly, the mean T
min for RCP8.5 (2020) and RCP8.5 (2050) for
Bona was 16.3 and 16.8°C respectively and for
Ganna 15.7 and 15.8°C respectively. The mean T
min observed is relatively the highest and followed by
Belg (Arfasa) were (14.8 and 15.3°C) for RCP4.5 (2020) and RCP4.5 (2050) respectively and for RCP8.5 (2020) and RCP8.5 (2050) was (15.4 and 16.4°C) respectively as shown in
Figure 19. Figure 19. Mean monthly Tmin in Yabello station.
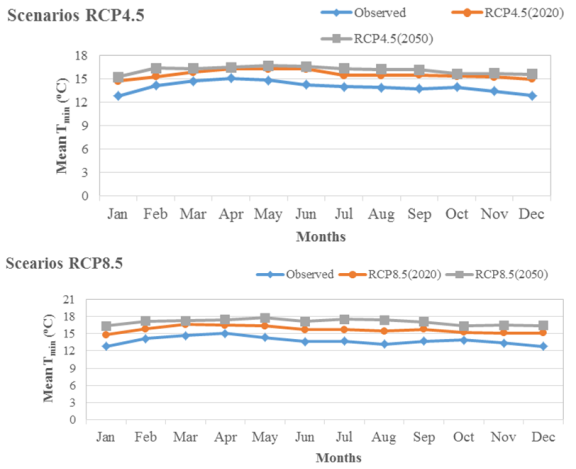
3.9. Comparison of Predicted Maximum and Minimum Temperature with the Baseline Period of RCP4.5 and RCP8.5
By using bias-corrected, future climate data, the temperature was calculated for the base period and the future climatic scenarios periods 2020 and 2050 (
Figures 20 & 21). The outcome reveals that for the T
max, baseline period, RCP4.5 (2020) and 2050 respectively fluctuate in the range of 22.5 to 28.2, 24.07 to 29.43 and 24.84 to 29.68°C/month. As well as T
max RCP8.5 (2020) and 2050 was 24.23 to 29.83 and 26.44 to 30.8°C/month. Similarly, T
min RCP4.5 (2020) and 2050 respectively range from 12.78 to 15.06, 14.79 to 16.6, and 16.36 to 17.77°C/month, and T
min RCP8.5 (2020) and 2050 range from 14.66 to 16.28 and 15.23 to 16.25°C/month. The T
max steadily rises until it reaches its peak value in February is around 28.2°C/month for the base period, 29.43°C/month for RCP4.5 (2020), and 29.68°C/month for RCP4.5 (2050). Moreover, T
max peaks at 29.83 for RCP8.5 (2020) and 30.74°C/month for RCP8.5 (2050) in the same months. Then, for the base period, RCP4.5 (2020), and 2050, respectively, in June month, and for the base period, RCP8.5 (2020), and 2050, respectively, in July months, its minimum value is 22.4, 24.04, and 24.84°C/month and 24.23°C/month and 26.44. This finding is similar to those reported by
. Similar to how T
min rises gradually, it reaches its peak values in April, March, and May of the following values 15.06°C for the base period, 16.6°C for RCP4.5 (2020), and 17.77°C for RCP4.5 (2050). Moreover, T
min with peak values in April of 16.28 for RCP8.5 (2020) and 16.43°C/month for RCP8.5 (2050). Then, for the base period, RCP4.5 (2020), RCP4.5 (2050), RCP8.5 (2050), and RCP8.5 (2050), respectively, its minimum value is 12.78, 14.79, 16.39, 14.66 and 15.23°C/month.
Figure 20. Minimum temperature at base period, the 2020s and 2050s scenarios periods.
Figure 21. Maximum temperature at base period, the 2020s and 2050s scenarios periods.
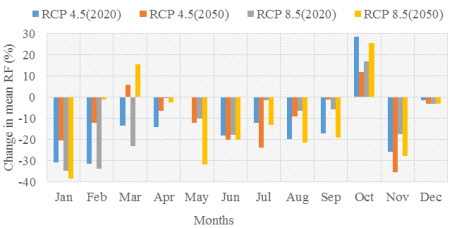
3.10. Monthly and Seasonal Projected Rainfall
The percentage change of mean monthly and annual rainfall is shown in this section for two scenarios and time horizons of RCP 4.5 (2020) and RCP 8.5 (2050) scenarios. The Power Transformation of the precipitation method was used to rectify the biases in the scenario data for RCP 4.5 and 8.5 based on the criteria of goodness of fit tests. After that, they were divided into two periods the 2020s (2025-2054) and 2050s (2055-2084). The mean monthly rainfall scenarios in 2020 and 2050 under RCP 4.5 and RCP 8.5 are shown in
Figure 22. Monthly mean rainfall in the RCP 4.5 (2020) showed a reduction in January, Feb, March, April, May, June, July, August, September, November and December, while it increased in March, September and October for different scenarios
Figure 22. January and November were the months with the greatest decrement with values of 38.49% and 35.63% for RCP8.5 (2050) and RCP4.5 (2050) respectively. March and October are also the months with the greatest increment with values of 15.52% and 28.41% for RCP 8.5 (2050) and RCP4.5 (2020) respectively.
The 2020 RCP 4.5 mean rainfall also decreased and increased in the months of that RCP’s (2050) except for March and October. The reduction in mean rainfall ranged from -0.1% to -31.44%, while the increment in mean rainfall ranged to +28.41% for RCP4.5 (2020) and the decrement ranges from -1.06% to -35.63% and the increment ranges from +5.81 to +11.73% respectively for RCP4.5 (2050). In addition, the mean rainfall decrement -0.47% to -35.05% and the increment was +16.86% for RCP8.5 (2020) and the mean rainfall decrement -1.2% to -38.49% and the increment was +15.52% to +25.51% RCP8.5 (2050) respectively. March shows the smallest increment and May shows the smallest decrement with values of 5.81% in RCP 4.5 (2050) and -0.1% in RCP 4.5 (2020) respectively. The same result for October was the highest increment and decrement was January with a value of +28.41% for RCP4.5 (2020) and -38.49% for RCP8.5 (2050) respectively.
Figure 22. Monthly percent changes in rainfall under both scenarios and periods.
Furthermore, the RCP 8.5 forecast for the 2020s showed a drop in mean rainfall in the months of all except October months. In addition, the 2050 RCP 8.5 simulation revealed a rise in March and October and a drop in the rest of the months. In October and January, respectively, the greatest increment and decline were seen. According to the findings, there is a decreased pattern in precipitation change for both scenarios and future periods, and the change fluctuates from month to month except for March and October. This result is in agreement with the findings of
. The "
Bega/Bona" season one of three displayed in the study areas. It is characterized by periods of sunny, dry weather mixed with sporadic falls or irregular/random from October until January. On the other hand, under typical circumstances, the southern and southeastern lowlands only see a brief rainy season. The
‘Arfasa" small rainy season, which lasts from February to May and covers the southern, central, eastern, and northeastern parts of the country. "
Kiremt/Ganna" main rainy season, which lasts from June to September for most of the country except for the southeastern lowlands, causes cooler mornings and nights and warmer days during the season
| [12] | Gebrie Geremew and Engida Agizew (2015) Climate Modeling of the Impact of Climate Change on Sugarcane and Cotton for Project on ‘a Climate Resilient Production of Cotton and Sugar in Ethiopia’ By Geremew Sahilu Gebrie (PhD) Addis Ababa, Ethiopia. Addis Ababa. |
| [1] | Abebe, D. (2010) ‘Future climate of Ethiopia from PRECIS Regional Climate Model Experimental Design’, (November). |
[12, 1]
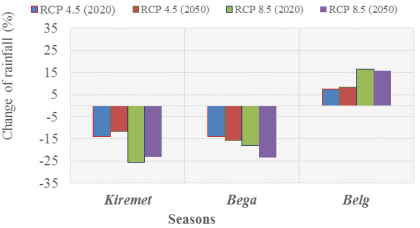
. As shown in
Figure 23, the
Ganna and
Bona seasons showed that there is a decreasing change in precipitation for both scenarios along with two time horizons from the base periods except for the
Belg season. The precipitation changes in the
Ganna season ranged from -11.56% to -25.55%, with RCP8.5 (2020) revealing the greatest decrease and RCP 4.5 (2050) the smallest. About -14.15% to -23.48% change in
Bona precipitation was detected in the relatively minimum decrement estimated in RCP 4.5 (2020) and the maximum observed in RCP 8.5 (2050).
Furthermore, in both scenarios,
Belg seasons exhibited an increment trend in study areas. It changes by approximately +7.47% to +16.38%. The greatest growth change was found under RCP8.5 (2020), while the lowest was in RCP4.5 (2020). According to these findings, the
Belg seasons were expected to face medium precipitation and the
Ganna and
Bona seasons were expected to face lower precipitation changes. These findings are consistent results with those reported by
| [19] | National meteorological Agency, (NMA) (2005) ‘National meteorological services agency agrometeorological bulletin seasonal agro meteorological bulletin’, 15(3), pp. 1–19. |
[19]
. According to
| [6] | David P. Rowell (2012) Sources of uncertainty in future changes in local precipitation. https://doi.org/10.1007/s00382-011-1210-2 |
| [36] | Kebede, A. (2013) Downscaling Climate Model Outputs for Estimating the Impact of Climate Change on Water Availability over the Baro-Akobo River Basin, Ethiopia. Doctoral Dissertation, Bonn University, Germany. |
[6, 36]
Forecasts for precipitation are less certain than forecasts for temperatures and more spatially, and seasonally dependent than temperature projections. According to
| [16] | IPCC, 2014 (2014) Climate Change 2014 Synthesis Report. |
[16]
, Global temperature increases of ~4°C or more above late 20
th century levels combined with increasing food demand, would pose large risks to food security globally with high confidence.
Figure 23. Seasonal projected change of rainfall from the base period.
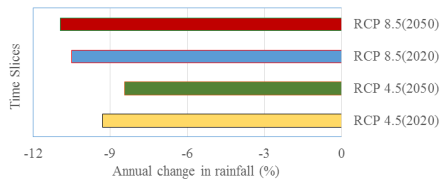
3.11. Projected Annual Rainfall
Figure 24 shows the percentage change in mean annual rainfall for RCP4.5 (2020), RCP4.5 (2050), RCP8.5 (2020), and RCP8.5 (2050). From the annual rainfall analysis, the results revealed a decreasing trend from base periods through both the RCP 4.5 and RCP 8.5 scenarios for each period. There is a -9.5% and -8.45% decrease in mean annual rainfall from the base periods to RCP4.5 (2020) and RCP4.5 (2050) respectively, and about -10.5% and -10.95% in RCP8.5 (2020) and RCP8.5 (2050) respectively. Generally, in this work, Five GCM-RCM (CanESM2, EC-EARTH, HadGEM2-ES, MIROC5, and MPI-ESM-MR) driven by the RCP4.5 and RCP8.5 emission scenarios were selected to project the future precipitation. Considering the ensemble mean of five GCMs, the future changes in precipitation concerning the baseline period were presented. These findings are consistent with those reported by
| [21] | Phillips, T. J., Bonfils, C. J. & Zhang, C. 2019. Model consensus projections of US regional hydro climates under greenhouse warming. Environmental Research Letters 14 (1), 014005. |
[21]
. According to these findings, in the stations under study, yearly rainfall shows a trend toward decline.
Figure 24. Projected percentage change in annual rainfall from the baseline period.
3.12. Projected Monthly, Seasonal and Annual Maximum Temperature
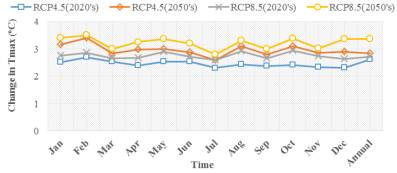
The mean monthly, seasonal and annual temperature exhibits distinct upward trends for almost all months, seasons and years, as well as for both periods.
Figure 25 shows the change in mean monthly maximum temperature in the 2020 and 2050 periods under RCP4.5 and RCP8.5. In 2020, the RCP4.5 simulations revealed a 2.3°C to 2.7°C increase in mean maximum temperature. February shows the most significant increase, whereas July shows a much smaller increase. The RCP4.5 (2050) also showed an increase from the baseline period in all months. The simulation suggested an increase in the range of 2.59°C to 3.4°C with the maximum increase projected in February and the minimum observed in July. Also, both RCP8.5 (2020) and RCP8.5 (2050) simulations showed a rise in the mean maximum temperature with values of 2.6°C to 2.93°C and 2.8°C to 3.5°C, respectively. The largest change was simulated in October, whereas the smallest was simulated in July under RCP8.5 (2020), and the highest and the lowest increases were detected in February and July under RCP8.5 (2050), respectively. In terms of the mean annual maximum temperature the change in mean annual maximum temperature under RCP4.5 (2020) and RCP4.5 (2050) ranges from 2.61°C to 2.83°C, with the highest change predicted for RCP4.5 (2050’s) and the lower reported for RCP4.5 (2020). While its values range from 2.71°C to 3.36°C under RCP8.5, the largest was found under RCP8.5 (2050) and the smallest was found under RCP8.5 (2020) respectively
| [7] | Declan Conway, E. Lisa F. Schipper 2010. Adaptation to climate change in Africa: Challenges and opportunities identified from Ethiopia. |
| [17] | Menale Kassie, Moti Jaleta, Bekele Shiferaw, Frank Mmbando, Mulugetta Mekuria 2013. Adoption of interrelated sustainable agricultural practices in smallholder systems: Evidence from rural Tanzania. |
[7, 17]
found similar results. According to
| [17] | Menale Kassie, Moti Jaleta, Bekele Shiferaw, Frank Mmbando, Mulugetta Mekuria 2013. Adoption of interrelated sustainable agricultural practices in smallholder systems: Evidence from rural Tanzania. |
[17]
, the average temperature in Ethiopia will climb by 0.8°C in the 2020s and 1.2°C in the 2050s. It also predicted that relative to 1961 to 1999, the average temperature change in Ethiopia’s central region would be in the range of 1.0°C to 1.1°C by 2020s and in the range of 1.82°C by the 2050s. This result is in agreement with the findings of
| [25] | Stocker, T. F., D. Qin, G. K. Platter, M. Tignor, S. K. Allen, J. Boschung, A., Nauels, Y. Xia, V. e. and P. M. M. (2013) ‘Climate change 2013: The physical science basis, in contribution of Working Group I (WGI) to the Fifth Assessment Report (AR5) of the Intergovernmental Panel on Climate Change (IPC...’, (September 2014). |
[25]
. According to this conclusion increase of global mean surface temperatures for 2081–2100 relative to 1986–2005 is projected to likely be in the ranges derived from the concentration-driven CMIP5 model simulations, that is, 1.1°c to 2.6°c for RCP4.5, and 2.6°c to 4.8°c for RCP8.5.
Figure 25. Change in mean monthly and annual Tmax from baseline period to future scenarios.
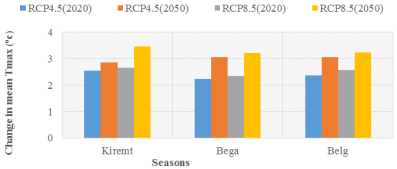
All
Kiremet, Bega, and
Belg seasons indicate a growing change from the base period through both RCP4.5 and RCP8.5 across time horizons as shown in
Figure 26.
Ganna's mean maximum temperature variations in both scenarios revealed an increase from the baseline periods across both time horizons. The greatest change (3.45°C) was seen in RCP8.5 (2050), and the smallest (2.22°C) was obtained in RCP4.5 (2020). In both periods, a maximum temperature change of about 2.55°C to 3.45°C was obtained throughout the
Bona seasons in both scenarios. RCP8.5 (2050) had the biggest temperature change whereas RCP4.5 (2020) had the lowest. Moreover, the maximum temperature change ranged from 2.37°C to 3.23°C in the
Belg season, in which the highest change was observed in RCP8.5 (2050) and the lowest obtained in RCP4.5 (2020) respectively. According to the
| [16] | IPCC, 2014 (2014) Climate Change 2014 Synthesis Report. |
[16]
, Global temperature increases of ~4°C or more above late 20
th century levels combined with increasing food demand, would pose large risks to food security globally with high confidence. In comparison to a baseline, it anticipated that climate change resulted in a rise in poor health across many regions of the 21
st century, particularly in low-income developing nations without climate change.
Figure 26. Mean seasonal change of maximum temperature from the baseline period.
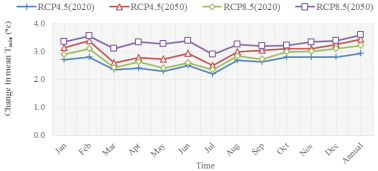
3.13. Projected Monthly, Seasonal and Annual Minimum Temperature
Figure 27 illustrates the change in mean monthly minimum temperature under RCP4.5 in 2020 and 2050 compared to the baseline period. All months for both scenario simulations showed an increase in mean minimum temperature. In all months of both periods, simulations demonstrated an increase in the mean minimum temperature with temperature differences changes ranging from 2.1°C to 2.8°C, 2.6°C to 3.3°C, 2.41°C to 3.16°C and 3.1°C to 3.39°C for RCP4.5 (2020), RCP4.5 (2050), RCP8.5 (2020) and RCP8.5 (2020) respectively. The biggest increase was in October and November and the lowest was in March for RCP4.5 (2020). The RCP4.5 (2050) simulation also showed an increase in mean minimum temperature. The range of increase in mean minimum temperature was from 2.6°C to 3.3°C. Furthermore, during RCP8.5 (2020) scenarios, there is an increase in the mean minimum temperature, with changes ranging from 2.41°C to 3.16°C in all months. In February, the largest change was simulated, and in March, was the smallest. In general, for all months there is an increasing trend for both mean monthly maximum and minimum temperatures from the base period to both RCP4.5 and 8.5 scenarios. For both the 2020s and 2050s periods, maximum and minimum temperatures are increasing from the base period to the high emission (RCP8.5) scenarios than the medium emission (RCP4.5) scenario since RCP8.5 has higher greenhouse gas emissions than the RCP4.5 scenarios
| [25] | Stocker, T. F., D. Qin, G. K. Platter, M. Tignor, S. K. Allen, J. Boschung, A., Nauels, Y. Xia, V. e. and P. M. M. (2013) ‘Climate change 2013: The physical science basis, in contribution of Working Group I (WGI) to the Fifth Assessment Report (AR5) of the Intergovernmental Panel on Climate Change (IPC...’, (September 2014). |
[25]
. Regarding the mean annual minimum temperature (
Figure 27), the change in mean annual minimum temperature ranges from 2.94°C to 3.45°C between RCP4.5 (2020) and RCP4.5 (2050), with the higher change occurring under RCP4.5 (2050) and the lower occurring under RCP4.5 (2020). While it ranges from 3.21°C to 3.59°C under RCP8.5, the largest found under RCP8.5 (2050) and the smallest discovered under RCP8.5 (2020). According to
| [11] | Gebre, S. L. and Ludwig, F.: Hydrological response to climate change of the Upper Blue Nile River Basin: based on IPCC Fifth Assessment Report (AR5), Journal of Climatology & Weather Forecasting, 3, 121, https://doi.org/10.4172/2332 2594.1000121 , 2015 |
[11]
, average annual maximum and minimum temperatures significantly increase in both future periods and RCPs scenarios over the Upper Blue Nile River basin. The result is also consistent with
| [4] | Bekele Daniel, Tena Alamirew, Asfaw Kebede, Gete Zeleke & Assefa M. Melesse 2019 “Modeling Climate Change Impact on the Hydrology of Keleta Watershed in the Awash River Basin, Ethiopia,” Environmental Modeling and Assessment, 24(1), pp. 95 107. https://doi.org/10.1007/s10666-018-9619-1 |
| [33] | Yadeta, D., Kebede, A. and Tessema, N. (2020) ‘Climate change posed agricultural drought and potential of rainy season for effective agricultural water management, Kesem sub-basin, Awash Basin, Ethiopia’, Theoretical and Applied Climatology, 140(1–2), pp. 653–666. Available at: https://doi.org/10.1007/s00704-020-03113-7 |
[4, 33]
. According to this conclusion, RCP4.5 predicts a 1.6°C to 2°C increase in maximum temperature and a 1.8°C to 2.4°C increase in minimum temperature between the mid and end of the century, respectively. Similarly, RCP8.5 anticipates a 2.1°C and 3.7°C increase in maximum temperature and a 2.6°C and 4.6°C increase in minimum temperature between the mid and end of the century, respectively. In general, from the base period to both the RCP4.5 and RCP8.5 scenarios, there is an increasing pattern for the monthly and yearly minimum temperatures. According to
| [16] | IPCC, 2014 (2014) Climate Change 2014 Synthesis Report. |
[16]
Without additional efforts to reduce GHG emissions beyond those in place today, global emissions growth is expected to persist, driven by growth in global population and economic activities. Global mean surface temperature increases in 2100 in baseline scenarios those without additional mitigation range from 3.7°c to 4.8°c above the average for 1850–1900 for a median climate response. They range from 2.5°c to 7.8°C when including climate uncertainty (5
th to 95
th percentile range) with a high confidence level.
Figure 27. Change in mean monthly and annual min. temperature under future climate change.
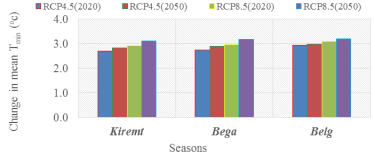
Figure 28. Mean change of minimum temperature from the baseline period.
Ganna (Kiremet), Bona (Bega) and
Birra (Belg) season minimum temperatures exhibit an increasing shift from the base period in all time horizons for both RCP4.5 and RCP8.5, as depicted in
Figure 28. Across all time horizons, the
Ganna minimum temperature change in both scenarios showed an increase from the baseline period. RCP8.5 (2050) had the biggest (3.2°C) shift whereas RCP4.5 (2020) had the smallest (2.71°C). During the
Bona season, both scenarios achieved a minimum temperature change of roughly 2.75°C to 3.19°C using both periods. The greatest temperature change was projected in RCP8.5 (2050), whereas the smallest was in RCP4.5 (2020). Furthermore, throughout the
Belg season, the minimum temperature change ranged from 3.93°C to 3.2°C, with the biggest change likely occurring in RCP8.5 (2050) and the lowest in RCP4.5 (2020). The result is inconsistent with the finding of Tessema
et al., 2017a and
| [2] | Ademe, M., Eric, N. O. and Tesfaye, L. (2019), “Determinants of adaptation choices to climate change in agro-pastoral dry lands of northeastern Amhara, Ethiopia”, Cogent Environmental Science, Vol. 5 No. 1, pp. 1, 23, https://doi.org/10.1080/23311843.2019.1636548 |
[2]
.