Abstract
The study was held in 2024 in the Kailari, Gauriganga, Godawari, and Dhangadhi local level of Kailali District of Nepal to evaluate and identify the factors impacting the adoption of a number of sophisticated technologies in the research area. Data were collected from 200 respondents utilizing a semi-structured interview form, using simple random selection. The factors influencing the adoption of better technologies in wheat production were identified using a logistic regression model. Age, gender, ethnicity, and area of cultivation are socioeconomic elements that have been linked to the adoption of appropriate agricultural practices, as well as training, technical advice, and membership. The adoption of seed replacement was positively significant (P<0.1) as a result of the training. The adoption of seed varieties was positively significant (P<0.05) for cultivated area. The farmers who were involved in farmer groups or Cooperative had 2.209 times higher odds for the adoption of improved seed compared to the odds for farmers who were not involved in farmer groups. Advice from the technician had a positively significant (P<0.05) impact on the date of sowing. The use of more frequent irrigation was positively significant (P<0.05) in relation to the age of the household head. The split nitrogen application was positively significantly influenced by super zone membership (P<0.05).
Keywords
Adoption, Innovation, Technology, Wheat, Super-Zone
1. Introduction
Farmers adopt innovations after they encounter, consider, and eventually reject or practice them
| [1] | Mosher, A. T. (1978). An introduction to Agricultural Extension. New York: Agriculture Development Council. |
| [34] | Rogers EM. (2003). Diffusion of innovations (5th Ed). Free Press, New York, USA. |
[1, 34]
. Aggregate adoption across all farms will be a gradual process. An individual may stop using innovation due to personal, institutional, or social reasons, such as finding an idea or practice more suitable for their needs
| [2] | Smit B, Skinner MW. (2002). Adaptation options in agriculture to climate change: a typology. Mitigation and Adaptation Strategies for Global Change 7: 85–114. |
[2]
.
It has been assumed that the cumulative rate of adoption of agricultural technology over time follows an S-shaped logistic function with a slow start, followed by a progressive adoption phase, and finally a convergence towards the maximum level asymptotic to the maximum level
| [3] | CIMMYT. (1993). the adoption of agricultural technology: a guide for survey design. CIMMYT Economics Program and International Maize and Wheat Improvement Center, Mexico. |
[3]
. Ban and Hawkins
| [35] | Ban AW, Hawkins H. (1996). Agricultural Extension. Oxford, Malden, MA: Blackwell Science. Blackwell Science, Malden, MA. |
[35]
found that innovation adoption patterns differed by crop type, location, and innovation type.
This crop is the most widely cultivated cereal crop in the world. According to Sharma
| [4] | Sharma SN. (2018). Constraints and Prospects of Wheat Farming. PMAMP, Wheat Super zone, Kailali. |
[4]
. wheat is cultivated on 21% of land and accounts for 17% of total cereal production in the world. For agriculture commercialization and mechanization in the country, the MoALD has proposed pockets, blocks, zones and super-zones to address fragmented arable land
| [5] | PMAMP. (2014). Block/ Zone Development Programme Conducting Material 2073. Ministry of Agriculture Development, Kathmandu, Nepal. |
[5]
. Wheat super-zone not as it were assists in mechanization and commercialization, but it also provides a few specialized assist to the farmers through its technicians and specialists. It moreover points to upgrade the livelihood and economy of the locale through a change in wheat cultivation and production technology
.
Nepalese wheat productivity is still in subsistence level. So, for the increased farm production and productivity, adoption of new suitable farming practices is the fundamental need for the country today. However, the process of dissemination of improved farming technology is being hampered severely by various obstacles. Thus, this study was deemed necessary and was undertaken. This study attempts to determine the factors associated with improved wheat cultivation adoption by beneficiaries of super-zone compared to non-beneficiaries.
2. Methodology
2.1. Site of Study
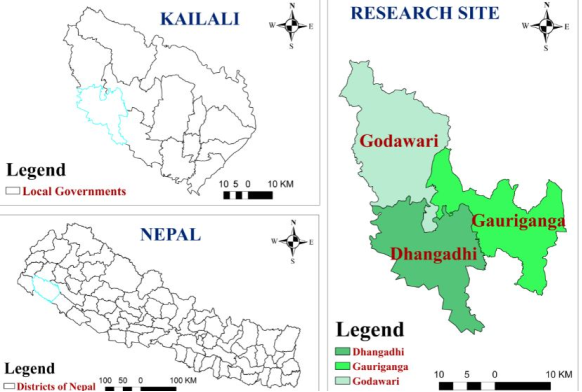
The Kailali district was selected as a super zone for wheat production established under Prime Minister Agriculture Modernization Project (PMAMP).
Figure 1. Map of Nepal showing research sites.
2.2. Sample Size
The size of the sample, and amount of variation, usually affect the quantity and quality of information obtained from the survey. Utilizing suitable inspecting methods, both factors can be controlled
| [7] | Scheaffer, R. (1979). Elementary Survey Sampling. Massachusetts, USA: Duxbury Press. |
[7]
.
Kinnear and Tayler
| [8] | Kinnear, J., & Tayler, J (1987). Marketing Research: An Applied Approach. Mc Grow. Hill Book Co., Singapore. |
[8]
suggested that a good survey sample should have both a small sampling error and minimum standard error. The minimal sample size for a bigger population that offers a suitable level of assurance for decision-making is typically thought to be 60
| [9] | Poate, C. D., & Daplyn, P. F (1993.) Data for Agrarian Development. Cambridge University Press. |
[9]
.
Taking 50 growers each from Kailari, Gaurigangar, Godawari and Dhamgadhi. 100 samples were from household under the membership of PM-AMP (Kailari and Gauriganga) while remaining samples were from non-member households.
2.3. Sample Selection Procedure
During the process of sample selection simple random sampling is the best way to avoid bias in which each unit of the population has an equal chance for selection
| [7] | Scheaffer, R. (1979). Elementary Survey Sampling. Massachusetts, USA: Duxbury Press. |
[7]
.
Thus by using sampling frame, a simple random sampling procedure was used to collect necessary information from wheat growers. The procedure was comprehensive and representative of the whole population.
2.4. Methods of Data Collection
Household survey is used for collection of necessary information. In this study, both the primary and secondary data were collected. The methodologies consisted of field survey, review of previous studies, and interviews with key informants.
2.5. Techniques of Data Collection
Primary data were gathered through a schedule of interviews. A variety of facts about wheat production were gathered. Face-to-face interviews were used to gather information about the features of the farm and home, as well as production and management factors.
2.6. Pre-testing of Interview Schedule
The major goals of this activity are to organize a fieldwork plan, assess the reliability of the questionnaire, and estimate various cost components such as financial costs, travel costs, interview time, etc. before the main survey. The interview schedule was pre-tested in nearby villages with 10 farmers from Mahara village before the questionnaire was given to the actual respondents. The schedule was amended where necessary, edited, and given its final shape. Methods and techniques of data analysis.
After collection of required data, it was coded and entered into a computer for analysis. Statistical programs for the Social Sciences (SPSS) and Stata were used to input the data and conduct the analysis. For multiple regression, the required inference was derived using the mean, standard deviations, frequency, percentage, and Ordinary Least Square Technique.
2.7. Quantitative Data Analysis
We used both descriptive and analytical statistics to analyze quantitative data. Simple descriptive statistics like frequency count, percentage, mean, standard deviation, etc. were used to describe the respondents' socioeconomic and farm characteristics such as family size, age, gender, occupational pattern, land holding size, and population of economically active people.
2.8. The Logit Model
It is employed in the discrete model, which yields outcomes similar to those of the probit model
| [10] | Gujarati, D. (2004). Essentials of Econometrics. 4rd ed. Singapore: The McGraw−Hill/Irwin Companies. |
[10]
. It is a multivariate statistical method that enables the prediction of dichotomous dependent variables from dependent variables
| [11] | Perneger, T. V., Courvoisier, D. S., Hudelson, P. M., & Gayet-Ageron, A. (2015). Sample size for pre-tests of questionnaires. Quality of life Research, 24, 147-151. |
[11]
.
Hosmor and Lemshew
| [36] | Hosmor, D., & Lemshew, S. (1989). Applied logistic regresstion. New York: A Wiley-Inter Science Puplication. |
[36]
noted that a logistic distribution (logit) has an advantage over the others in the study of dichotomous outcome variables since it is a flexible and simple model to utilize from a mathematical perspective and produces an insightful interpretation.
Logistic equation is given by;
p/(1-p)=eb0+b1x1+b2x2+…bnxn
Where, p/(1-p) is odds of an event
p is the probability
e is base of natural logarithm
b0…bn are coefficients
x1…….xn are independent variables.
Logit form of equation can be obtained by taking natural log both sides,
ln(p/1-p)=b0+b1X1+b2X2+…….bnXn
Table 1. Description of variables used in the logistic regression model.
Variables | Description of variables | Types of variables | Unit |
Dependent variables in Logistic regression: |
Split nitrogen | Split dose of nitrogen apply by farmers | Dummy | (1- two time, 0- one time) |
Crop residual | Crop residual management by farmers | Dummy | (1- incorporate in soil, 0-stubble burning) |
Irrigation Frequencies | Number of irrigation applied by farmer | Dummy | (1- two times, 0- single time) |
Date of sowing | Appropriate date of sowing of wheat by farmers | Dummy | (1- November 10, 0- otherwise) |
Seed variety | Seed variety used by farmers | Dummy | (1-Improved, 0- local) |
Seed replacement | time of seed replacement by farmers | Dummy | (1- within 3 years, 0- otherwise) |
Independent variables in Logistic regression: |
Age | Age of household head | Continuous | Years |
Amount of land | Land amount used for wheat production | Continuous | kattha |
Purpose of crop | Purpose of wheat grain by farmers | Dummy | (1- Commercial, 0- home consumption) |
Gender | Gender of household head | Dummy | (1- male, 0- female) |
Ethnicity | Ethnicity of household head | Dummy | (1- janajati, 0- otherwise) |
Training | Training on wheat cultivation | Dummy | (1- Yes, 0- No) |
Advice from technicians | Advice from technicians for wheat production | Dummy | (1- Yes, 0- No) |
Super zone | Respondents under the super zone | Dummy | (1- member, 0- non member) |
Involvement of extension worker | Involvement of extension worker for provision of information | Dummy | (1- Yes, 0- No) |
Involvement in group | Involvement of respondent in farmer group | Dummy | (1- Yes, 0- No) |
Active population | Active age group in family member | Dummy | (1- Yes, 0- No) |
Personal contact to extension worker | Personal contact of respondents to extension worker | Dummy | (1- Yes, 0- No) |
Land rented in | Land rented in by respondent | Continuous | Kattha |
Occupation | Occupation of household head | Dummy | (1- Agriculture, 0-otherwise) |
Year of schooling | Year of schooling of household head | Continuous | Years |
Source: Authors illustrations.
3. Results
3.1. Package of Practices/Technologies
3.1.1. Seed Replacement
The majority of farmers replaced their wheat seeds within three years, according to
table 2. Farmers were not replenishing seeds on average in 19% of cases. Farmers who didn't replace their seeds accounted for 12% of the total in the super zone, compared to 7% in the non-super zone.
Table 2. Status of seed replacement in study area.
Seed replacement | Total (n=200) | Super zone (n=100) | Non-super zone (n=100) |
No change (Yes) | 19 (9.5) | 12 (12) | 7 (7) |
Change within 3 years (Yes) | 181 (90.5) | 88 (88) | 93 (93) |
Source: Field Survey, 2024.
3.1.2. Variety Used
The acceptance of the enhanced variety was deemed adequate. A little over 83% of the farmers utilized enhanced wheat varieties. According to
Table 3, there were 84 percent of such farmers in the super zone and 82 percent in the non-super zone, respectively.
Table 3. Status of seed variety used at study area.
Variety | Total (n=200) | Super zone (n=100) | Non-super zone (n=100) | Chi-square value |
Local | 34 (17) | 16 (16) | 18 (18) | 0.142 |
Improved | 166 (83) | 84 (84) | 82 (82) |
Source: Field Survey, 2024.
3.1.3. Time of Irrigation Application
Nearly 80% of the respondents applied irrigation at the Crown Root Initiation (CRI) stage, it was discovered. Only 1% of all respondents were discovered applying irrigation at the node creation stage, compared to around 3.5% of all respondents applying irrigation at the tillering stage. Similar to this, only 1 out of 200 respondents administered irrigation at the milking stage, but 4.5% of all respondents did so at the blossoming stage.
Table 4. Irrigation status in the study area.
Irrigation (Yes) | Total (n=200) | Super zone (n=100) | Non-super zone (n=100) | Chi-square value |
CRI | 198 (99) | 99 (99) | 99 (99) | |
Tillering | 7 (3.5) | 6 (6) | 1 (1) | 3.701* |
Node formation | 2 (1) | 0 (0) | 2 (2) | 2.020 |
Flowering | 9 (4.5) | 4 (4) | 5 (5) | 0.116 |
Milking | 1 (0.5) | 1 (1) | 0 (0) | 1.005 |
Grain filling | 0 (0) | 0 (0) | 0 (0) | |
Source: Field Survey, 2024
3.1.4. Weeding
In the study area, it was shown that just 43% of the households really weeded their wheat fields. It was discovered that 50% of households in super zones and 36% of households in non-super zones practiced weeding, and it was determined that there was a substantially distinct pattern at the 5% level of significance, as shown in
Table 5.Table 5. Status and methods of weeding in the study areas.
Variables | Total (n=200) | Super zone (n=100) | Non-super zone (n=100) | Chi-square value |
Weeding (Yes) | 86 (43) | 50 (50) | 36 (36) | 3.998** |
Method of weeding | | | | 8.282*** |
a. Manual | 52 (59.8) | 24 (47.1) | 28 (77.8) |
b. Chemical | 35 (40.2) | 27 (52.9) | 8 (22.2) |
Source: Field Survey, 2024
3.1.5. Insect Pest and Disease Management
The measures used by respondents to handle insects and diseases in their wheat fields are shown in
Table 6. In the research area, just 11% of households used insect pest management techniques. When compared to non-super zones, the percentage of such homes in the super zone was much higher (18%). (4 percent). Only 9% of respondents were found to have controlled the illness in wheat fields. Only 4% of non-super zone households and 14% of super zone households undertook illness management. At a 5% level of significance, the difference was determined to be statistically significant.
Table 6. Insect pest and Disease management system at the study area.
Insect and disease management | Total (n=200) | Super zone (n=100) | Non-super zone (n=100) | Chi-square value |
Insect management (Yes) | 22 (11) | 18 (18.0) | 4 (4) | 10.010*** |
Methods of insect management | 1.086 |
Cultural (Yes) | 2 (9.1) | 2 (11.1) | 0 (0) |
Biological (Yes) | 2 (9.1) | 2 (11.1) | 0 (0) |
Chemical (Yes) | 18 (81.8) | 14 (77.8) | 4 (100) |
Disease Management (Yes) | 18 (9) | 14 (14) | 4 (4) | 6.105** |
Methods of disease Management | 1.029 |
Cultural (Yes) | 1 (5.6) | 1 (7.1) | 0 (0) |
Biological (Yes) | 2 (11.1) | 2 (14.3) | 0 (0) |
Chemical (Yes) | 15 (83.3) | 11 (78.6) | 4 (100) |
Source: Field Survey, 2024
3.1.6. Residual Management
It was discovered from the survey area that 99.5% of all respondents were involved in residual management in wheat fields. 79% of the households burned their stubble, compared to 21% who integrated wastes into the soil. In the super zone and non-super zone, respectively, homes that had absorbed leftovers into the soil made up 28% and 14% of all households. As demonstrated in
Table 7, the difference was substantial at a 5 percent level.
Table 7. Residual management status of respondents in the study area.
Residual management | Total (n=200) | Super zone (n=100) | Non-super zone (n=100) | Chi-square value |
Residual Management (Yes) | 199 (99.5) | 100 | 99 (99) | 1.005 |
Method of residual management | 5.907** |
Incorporate in soil | 42 (21) | 28 (28) | 14 (14) |
Stubble burning | 158 (79) | 72 (72) | 86 (86) |
Source: Field Survey, 2024
3.1.7. Nitrogen Application
12.5 percent of households just used nitrogen when preparing the land. The remaining 87.5 percent of families used split dosages of nitrogen, top dressing one month after sowing and basal during field preparation. In super zones, 92 percent of families applied split doses, compared to 83 percent in non-super zones (
Table 8).
Table 8. Nitrogen application in the study area.
Nitrogen application | Total (n=200) | Super zone (n=100) | Non-super zone (n=100) | Chi-square value |
Nitrogen Doses | | | | 3.703* |
a. one time | 25 (12.5) | 8 (8) | 17 (17) |
b. two time | 175 (87.5) | 92 (92) | 83 (83) |
Source: Field Survey, 2024
3.2. Factors Affecting Adoption of Good Agriculture Practices
3.2.1. Factors Affecting the of Split Nitrogen Application
According to the findings of a binary logistic regression analysis of the factors influencing the application of split nitrogen, five of the eight explanatory variables—including the household head's age, membership in a super zone, advice from a technician, training, and gender—were found to be significant at the 1%, 5%, or 10% level of significance.
According to the study, split nitrogen application was negatively and significantly impacted by household head age (p 0.01). It means that the probability of split nitrogen application were 0.93 times higher if the age of the household head was raised by one year. The calculation of the marginal effect revealed that a one-year increase in household head age resulted in an average 0.6% drop in adoption likelihood. Similar to this, super zone membership had an effect on the split nitrogen application that was highly substantial (P 0.05). It means that the probabilities of adopting split nitrogen for a member of a super zone are 3.56 times higher than for a non-member of a super zone. The probabilities of adoption were 4.38 times higher for farmers who had taken part in wheat farming instruction than they were for farmers who had not. The technician's advice had a positive, statistically significant (P 0.1), influence on the split nitrogen application. With odds ratio of 3.785, gender (male) had a positive significant (P0.1) impact on the split nitrogen application, while odds for farmers who routinely sought technical assistance were 4.40 times higher than odds for farmers who did not.
3.2.2. Factors Affecting the Crop Residual Management
The outcome displays the binary logistic regression analysis of the variables influencing the management of crop residuals. As recommended by conservation agriculture, stubble assimilation in soil is considered to be beneficial practice. The odds ratio results indicate that three factors—Super Zone, Amount of Land, and Ethnicity—were significant at a 1 percent and 5 percent level for each of the six explanatory variables. According to the findings, super zone farmers had a 3.96-times greater chance of incorporating stubble than non-super zone farmers did. The amount of land had a substantial favorable (P 0.01) impact on how crop residues were managed. This indicates that the likelihood of adopting stubble inclusion as a crop residue management strategy increased by 1.04 times for every kattha of additional land. The management of agricultural residue was favorably significant (P 0.05) in relation to ethnicity. This indicates that the likelihood of adopting stubble for Janajatis was 3.575 times higher than the likelihood of adopting stubble for non-Janajatis.
3.2.3. Factors Affecting Adoption of Practice of Irrigating Twice
Table 9 displays the findings of a binary logistic regression study of the variables influencing the adoption of twice-daily irrigation. According to odds ratio results, two variables—household head's age and the crop's intended use—were shown to be significant at 5% and 10% levels of significance among nine different explanatory variables. The study found that the household head's age was positively significant (P 0.05) in relation to applying irrigation more frequently. With each additional year of household head age, the likelihood of using irrigation twice increased by 1.047 times. The decision to use irrigation more frequently was favorably significant (P 0.1) in relation to the goal of crop production. The outcome demonstrates that the probability of twice irrigation for a farmer cultivating for sale is 1.67 times greater than the probability of twice irrigation for a farmer cultivating for consumption.
3.2.4. Factors Affecting the Adoption of Date of Sowing
Table 9 displays the findings of the binary logistic regression analysis of the variables influencing the choice of sowing date. According to the odds ratio results, two variables—Super Zone and Advice from technician—had significant results at the 1% and 5% levels of significance among the twelve different explanatory factors. According to the study, Super Zone was favorably significant (P 0.01) on the sowing date. For farmers in super zones, the chances of sowing at the right time are 5.685 times higher than for farmers in non-super zones. The odds ratio for the impact of the technician's advice on the date of sowing was 9.035, which was favorably significant (P 0.05).
3.2.5. Factors Affecting the Adoption of Improved Seed Variety
The outcome of the binary logistic analysis of the variables influencing the adoption of Seed variety is shown in
Table 9. According to the odds ratio results, two factors—Land and Involvement in the Farmer Group—had significant results at the 5% and 10% levels of significance among the seven explanatory variables. The study found that the adoption of seed variety was favorably significant (P 0.05) for land. It implies that the likelihood of using better seed increased by 3.502 times for every unit increase in the area of wheat that is cultivated. Participation in farmer groups positively significantly affected the adoption of better seed varieties (P 0.1). When compared to farmers who weren't active in farmer organizations, farmers who were in groups had probabilities of adopting enhanced seed that were 2.209 times greater.
3.2.6. Factors Affecting the Adoption of Seed Replacement
The findings from a binary logistic regression analysis of the variables influencing the adoption of seed replacement are presented in
Table 9. According to the odds ratio results, two variables—ethnicity and training—were identified as significant at the 1% and 10% levels of significance among the six explanatory variables. The study found that ethnicity had a substantial detrimental impact on the adoption of seed replacement (p 0.01). According to the findings, Janajati farmers had a 0.41-times greater chance of adopting seed replacement within three years than non-Janajati farmers. The adoption of seed replacement was positively significantly impacted by the training (P 0.1). The findings indicate that compared to farmers who did not receive any training, those who did had 2.77 times the likelihood of adopting seed replacement within three years.
Table 9. Factors affecting adoption of different packages of practices for wheat production.
Variables | Odds Ratio |
Split nitrogen | Residual management | Frequencies of irrigation | Date of sowing | Improved seed variety | Seed replacement |
Age | 0.933*** | 0.979 | 1.047** | 0.978 | 0.995 | 1.004 |
Amount of land | 1.037 | 1.036*** | 0.948 | 0.989 | 3.502** | |
Purpose of crop | 1.569 | | 1.666* | 0.772 | 1.326 | |
Gender | 3.785* | | 0.807 | | | |
Ethnicity | 0.801 | 3.575** | | 0.401 | | 0.411*** |
Training | 4.386* | | 1.731 | 3.784 | | 2.775* |
Advice from technicians | 4.404* | | | 9.035** | | 0.987 |
Super zone | 3.556** | 3.963*** | 2.406 | 5.685*** | 1.100 | 0.755 |
Involvement of extension worker | | 0.950 | | | | |
Involvement in group | | 1.412 | | 1.047 | 2.209* | 1.605 |
Active population | | | 1.031 | 1.192 | | |
Personal contact to extension worker | | | 2.129 | | | |
Land rented in | | | | 1.038 | | |
Occupation | | | | | 3.978 | |
Year of schooling | | | | | 1.043 | |
Summary Statistics |
Number of observation | 200 | 200 | 200 | 200 | 200 | 200 |
Log Likelihood | -59.056 | -85.91 | -50.314 | -54.04 | -82.11 | -128.67 |
LR Chi2 | 32.60*** | 33.76*** | 15.70* | 21.95** | 18.12** | 11.85* |
Prob>Chi2 | 0.000 | 0.000 | 0.073 | 0.024 | 0.011 | 0.065 |
Pseudo R2 | 0.216 | 0.164 | 0.137 | 0.168 | 0.099 | 0.044 |
Source: Field survey 2024.
4. Discussion
4.1. Packages of Practices/Technologies in Wheat
4.1.1. Seed Characteristics
The largest amount of wheat could be produced in Ethiopia from a seed rate of 125 kg, and the least amount could be produced from a seed rate of 200 kg
| [12] | Awoke, T., Tekle, Y., & Misgana, M. (2017). Effect of sowing methods and seed rate on yield of bread wheat (Triticumaestivum L.) at South Ari District, South Omo Zone, Snnpr, Ethiopia. International J. of Research-Granthaalayah, 5(6), 175-180. |
[12]
. Although 100 kg/ha of seed generated the most grains per spike, it was discovered that 160 kg/ha of seed produced the maximum grain yield
| [13] | Chaudhary, J., Khan, U., & Shah, S. (2015). Effect of sowing methods and seed rates on wheat yield and water productivity. 267-272. |
[13]
.
Quality seed is thought to be the most fundamental, important, and affordable input for increasing productivity (Rana, 1997). Presently, there are two major constraints for seed system development in Nepal – (i) limited choices of wider range of preferred varieties available to farmers and (ii) easy access and availability of research developed varieties to farmers at right time and right place in affordable prices. High adoption lags of varieties in farmers' fields due to inefficient seed systems' inability to supply seeds quickly at the farm level are the main obstacles and problems in research.
And support services for effective operation of Nepal's present seed system
| [14] | Gauchan, D., Magar, D. T., Gautam, S., Singh, S., & Singh, U. S. (2015). Strengthening seed system for rice seed production and supply in Nepal. IRRI-NARC collaborative EC-IFAD funded project on Seed Net Development. Socioeconomics and Agricultural Research Policy Division, Nepal Agricultural Research Council, Nepal. 40p. |
[14]
. According to Harris et al. (2007), seed priming improved maize establishment, growth, and flowering as well as increased seed tolerance to unfavorable environmental conditions and increased yield. The typical priming period for wheat seeds was 12 hours, which improved germination, plant growth and development, and yield
| [15] | Debbarma, M., & Das, S. (2017). Priming of Seed: Enhancing Growth and Development. International Journal of Current Microbiology and Applied Sciences. 6, 2390-2396. |
[15]
. Ethiopian wheat growers should adopt the good practice of replacing their seeds every year to boost grain yield
| [16] | Argaw, M. (2015). Good Agricultural Adaptation Practices in Ethiopia. UNIQUE Forestry and Land Use and Kulima Integrated Development Solutions. |
[16]
.
4.1.2. Land Management
The no-till method produced considerably more organic matter overall
| [17] | Nurbekov, A., Suleimenov, M., Friedrich, T., &Taher, F. (2012). Effect of Tillage Methods on Productivity of Winter Wheat. Journal of Arid Land Studies, 255-258. |
[17]
. In Ethiopia, conservation agriculture and agroforestry are effective wheat adaptation techniques that raise wheat yield
| [16] | Argaw, M. (2015). Good Agricultural Adaptation Practices in Ethiopia. UNIQUE Forestry and Land Use and Kulima Integrated Development Solutions. |
[16]
. Repeated tillage (conventional) is thought to promote water and air flow, boost root growth, speed up germination, and lessen the chance of crop loss during an early rainy season
| [16] | Argaw, M. (2015). Good Agricultural Adaptation Practices in Ethiopia. UNIQUE Forestry and Land Use and Kulima Integrated Development Solutions. |
[16]
.
4.1.3. Sowing Method
Following seed broadcasting and seed broadcasting in standing water, the drilling method of sowing had a beneficial impact on plant height, number of tillers per plant, number of spikes per plant, and number of grains per spike
| [18] | Mujeeb, R. U., Soomro, U. A., Odhano, E. A., &Gul, S. (2009). Effects of Sowing Method and Seed Rate on Growth. World Journal of Agricultural Sciences, 159-163. |
[18]
. According to studies done in Ethiopia, row planting yielded more wheat than sowing using the spread approach
| [12] | Awoke, T., Tekle, Y., & Misgana, M. (2017). Effect of sowing methods and seed rate on yield of bread wheat (Triticumaestivum L.) at South Ari District, South Omo Zone, Snnpr, Ethiopia. International J. of Research-Granthaalayah, 5(6), 175-180. |
[12]
.
It was determined that wheat sowing under bed planting produced better results, with the maximum plant height, number of tillers, number of grains per spike, 1000 grain weight, grain yield, and water productivity, whereas these parameters were seen as the lowest under broadcasting. Compared to wheat that was broadcast, wheat grown on beds yielded 13% more while using 35% less water
| [13] | Chaudhary, J., Khan, U., & Shah, S. (2015). Effect of sowing methods and seed rates on wheat yield and water productivity. 267-272. |
[13]
.
4.1.4. Depth and Spacing
For irrigated normal seeded conditions, the row spacing should be 22–23 cm, whereas it should be 15–18 cm for late sown conditions. The most fertile soil zone should be sown at a depth of 5 cm
| [19] | Kumar, R. (2009). Good agricultural practices for Wheat. G. B. Pant University of Agriculture & Technology, Pantnagar-Uttrakhand. |
[19]
. In Nepal, the standard row-to-row spacing for wheat is 22 cm, and the depth of sowing is 5 to 6 cm
.
4.1.5. Irrigation
When compared to other moisture levels and no irrigation, three irrigations administered at 25, 40, and 55 days after sowing (DAS) were the most successful
| [20] | Khan, A., Islam, S., Hasan, M., &Haque, M. (2018). Effect of different irrigation levels on the performance of wheat. Progressive Agriculture, 99-106. |
[20]
. The primary factor increasing wheat yield and productivity is irrigation, and enough irrigation increases production. In Shreepur VDC, Kanchanpur district of Nepal, irrigation enhanced wheat production by almost 193 percent
| [21] | Paudyal, N. P. (2011). Role of Irrigation in Crop Production and Productivity: A Comparative Study of Tube Well and Canal Irrigation in Shreepur VDC of Kanchanpur District. The Geographical Journal of Nepal, 8, 53-62. |
[21]
.
If there is only one irrigation available, use it at the CRI stage, which is 20–25 days after sowing. Every week when the first irrigation for the CRI stage is delayed, it has been discovered, the yield is reduced by 2-4 quintals per hectare
| [22] | Kumar, V. (2012). Irrigation in Wheat Cultivation. agropedia. |
[22]
.
4.1.6. Weeding
According to the study, weed infestation in wheat fields lowered yield by roughly 25.35 percent
| [23] | Dangwa, L., Singh, A., Singh, T., & Sharma, C. (2010). Effect of Weeds on the Yield of Wheat Crop in Tehsil Nowshera. Journal of American Science. |
[23]
. Although chemical methods appear to be profitable, manual and biological methods are found to be more environmentally friendly and improve the health of the soil. The chemical method of weed control was found to be more effective in weed control and per unit production of wheat was also higher than other methods of weed control
| [24] | Safdar, M. E., Ali, A., Aziz, A., &Yasin, M. (2011). Comparative efficacy of different weed management strategies in wheat. Chilean journal of agricultural research. |
[24]
.
4.1.7. Disease and Insect Pest Management
Rusts, blotches, and head blight/scab are prominent wheat diseases that now contribute to these losses. Wheat blast and spot blotch, two more recently discovered or comparatively unknown diseases, also pose a threat to grain output. The production of wheat is significantly hampered by pathogenic fungus. Since the crop was domesticated, rust infections have hampered global wheat production and continue to pose a threat to the global wheat supply
| [25] | Roelfs, A. P. (1992). Rust diseases of wheat: concepts and methods of disease management. Cimmyt. |
[25]
. Fluconazole, Tebuconazole, or Epoxyconazole + Carbendazim applied to plants twice during Zadoks development stages 31 and 45 resulted in disease severity reductions of 96.3 percent, 93.9 percent, and 91 percent, respectively
| [26] | Soner, D., & Erkilic, A. (2016). Effect of wheat cultivars, fertilizers, and fungicides on Fusarium foot rot disease of wheat. Turkish Journal of Agriculture and Forestry, 101-108. |
[26]
. According to
| [27] | Oerke, E. C. (1994). Crop losses to pests. The Journal of Agricultural Science, 144(1), 31-43. |
[27]
, the annual average of real yield losses brought on by all wheat illnesses in both industrialized and developing nations was around 12.4%. Pucciniatriticina-caused leaf rust was by far the most significant disease, resulting in average yearly losses of 3.48 percent, followed by the wheat streak mosaic virus (1.88 percent) and the Septoria complex (1.6 percent)
| [28] | Singh, R. P., & Julie, N. M. (2007). The challenges of maintaining wheat productivity: pests, diseases, and potential epidemics. Euphytica, 417-430. |
[28]
. In general, disease-related yield loss in wheat production should not exceed 0.1 to 2 percent
| [29] | Bockus, W. W., Appel, J. A., Bowden, R. L., Fritz, A. K., Gill, B. S., Martin, T. J., & Eversmeyer, M. G. (2001). Success stories: Breeding for wheat disease resistance in Kansas. Plant Disease, 85(5), 453-461. |
[29]
. Insects that feed on wheat and chew it typically do not cause significant direct damage until population numbers are quite high
| [28] | Singh, R. P., & Julie, N. M. (2007). The challenges of maintaining wheat productivity: pests, diseases, and potential epidemics. Euphytica, 417-430. |
[28]
.
4.1.8. Use of Fertilizers
In comparison to a wheat crop that was not fertilized, it was discovered that the application of fertilizer greatly decreased disease by 27.5% to 54.7%. Pre-sowing applications of calcium ammonium nitrate (26 percent N) or composite NPK (15 percent, 15 percent, 15 percent) on plants resulted in less disease symptoms than pre-sowing applications of NPK (20 percent, 20 percent, 0 percent)
| [26] | Soner, D., & Erkilic, A. (2016). Effect of wheat cultivars, fertilizers, and fungicides on Fusarium foot rot disease of wheat. Turkish Journal of Agriculture and Forestry, 101-108. |
[26]
.
4.1.9. Soil Test
Farmers conduct soil tests to evaluate the soil's fertility and amount of nutrient availability. They conduct soil tests to check for the presence or absence of one or more nutrients as well as the pH level (Lukin). One of the finest techniques to evaluate the fertility of the land is through soil testing. This evaluation assists in determining the type and quantity of fertilizer and/or limestone that must be used to achieve the highest yield. Soil testing can assist in resolving issues including low yields brought on by a lack of fertility, acidic or basic soils, identification of suitable fertilizer mixtures, and overuse of fertilizer
| [30] | Anonymous. (2014). the Why and How of Soil Testing. Canada: Prime Edward Island. |
[30]
.
4.1.10. Crop Residual Management
Average plant output was found to be higher in the field with crop residue incorporated into the soil compared to crop residue plot treatments than that obtained in residue removal plots. Additionally, soil fertility was consistently higher in crop residue plots than it was in crop residue removal
| [37] | Hassan Salih, O. N., Mubarak, A., &Hassabo, A. (2012). Effect of crop residues on soil fertility and yield of wheat (Triticumaestivum) - guar (Cymopsistetragonoloba) crops in dry tropics. International Journal of Scientific & Engineering Research 3(10). |
[37]
. Crop residues are a rich source of plant nutrients since they include 25% of the nitrogen (N), phosphorous (P), sulfur (S), and potassium (K) that cereal crops absorb. This makes them a significant supply of nutrients (Singh & Singh, 2001). While applying crop residues increases inputs or reduces losses and so helps to maintain or increase soil organic matter content, burning crop leftovers reduces the organic matter inputs to the soil
| [38] | FAO/IAEA. (2003). Management of crop residues forsustainable crop production. International automic energy agency. |
[38]
.
4.2. Factors Affecting Adoption of Proper Agriculture Practices
The use of technology and family age has a good relationship with wheat production
| [31] | Kebede, D., Ketemaa, M., &Dech, N. (2017). Disparity in adoption of wheat production technology packages in eastern ethiopia. Review of Agricultural and Applied Economics, 22-29. |
[31]
. Ethiopia's education system has benefited from the introduction of new technologies in the production of wheat, including variety, sowing techniques, mechanization, and row planting
| [32] | Mulugeta, T., &Hundie, B. (2012). Impacts of adoption of improved wheat technologies on households' food consumption in southeastern Ethiopia (No. 1007-2016-79620). |
[32]
. According to Lionberger's research from 1960, adopting suggested habits is favorably correlated with education. The number of years in education, particularly more than eight, was discovered to be virtually universally linked to greater adoption rates. Adoption of improved wheat varieties in Eastern Africa is negatively impacted by the household head's educational level
| [33] | Tesfaye, S., Bedada, B., & Mesay, Y. (2016). Impact of improved wheat technology adoption on productivity. African Crop Science Journal, 24, 127-135. |
[33]
. If farmers had access to the right technology, adoption Training is a crucial component of the extension strategy used in all agricultural development initiatives, and as a result, farmers perform better (Mathur, 1996). The adoption rate of new technology would increase if farmers had access to the proper technologies
| [31] | Kebede, D., Ketemaa, M., &Dech, N. (2017). Disparity in adoption of wheat production technology packages in eastern ethiopia. Review of Agricultural and Applied Economics, 22-29. |
[31]
. The growers' revenue has a favorable impact on the adoption of wheat varieties
| [33] | Tesfaye, S., Bedada, B., & Mesay, Y. (2016). Impact of improved wheat technology adoption on productivity. African Crop Science Journal, 24, 127-135. |
[33]
. If farmers had access to the right technology, adoption of new technologies would grow
| [31] | Kebede, D., Ketemaa, M., &Dech, N. (2017). Disparity in adoption of wheat production technology packages in eastern ethiopia. Review of Agricultural and Applied Economics, 22-29. |
[31]
.
5. Conclusions
The most widely used production techniques among both beneficiaries and non-beneficiaries included seed replacement within three years, improved varietal use, broadcast seed sowing, irrigation at CRI stage, manual weeding, insect pest management using chemical methods, residual management through stubble burning, manual harvesting and use of wheat threshers, use of nitrogen fertilizer in two split doses, and basal application of phosphorus and potassium. Conservation tillage, chemical weeding, biological and cultural insect pest management, residual management through soil integration, and seed treatment and priming were not used by either group. Conversely, both groups had the lowest adoption rates for these activities. Major determining factors for split nitrogen application included age, gender, training received, super-zone beneficiaries, and communication with an extension agent.
Major determining factors for residual management included crop area, ethnicity, and super-zone beneficiaries. Super-zone beneficiaries and interactions with extension personnel were key determinants of sowing date. The largest determinants of enhanced seed variety were crop area and involvement in groups or cooperatives. The two main determinants of seed replacement were ethnicity and training received.
Abbreviations
PMAMP | Prime Minister Agriculture Modernization Project |
MoALD | Ministry of Agriculture and Livestock Development |
GAP | Good Agricultural Practices |
CRI | Crown Root Initiation |
Conflicts of Interest
The authors declare no conflicts of interest.
References
| [1] |
Mosher, A. T. (1978). An introduction to Agricultural Extension. New York: Agriculture Development Council.
|
| [2] |
Smit B, Skinner MW. (2002). Adaptation options in agriculture to climate change: a typology. Mitigation and Adaptation Strategies for Global Change 7: 85–114.
|
| [3] |
CIMMYT. (1993). the adoption of agricultural technology: a guide for survey design. CIMMYT Economics Program and International Maize and Wheat Improvement Center, Mexico.
|
| [4] |
Sharma SN. (2018). Constraints and Prospects of Wheat Farming. PMAMP, Wheat Super zone, Kailali.
|
| [5] |
PMAMP. (2014). Block/ Zone Development Programme Conducting Material 2073. Ministry of Agriculture Development, Kathmandu, Nepal.
|
| [6] |
MoAD. (2018). Retrieved from Ministry of Agriculture Development:
http://www.moad.gov.np
|
| [7] |
Scheaffer, R. (1979). Elementary Survey Sampling. Massachusetts, USA: Duxbury Press.
|
| [8] |
Kinnear, J., & Tayler, J (1987). Marketing Research: An Applied Approach. Mc Grow. Hill Book Co., Singapore.
|
| [9] |
Poate, C. D., & Daplyn, P. F (1993.) Data for Agrarian Development. Cambridge University Press.
|
| [10] |
Gujarati, D. (2004). Essentials of Econometrics. 4rd ed. Singapore: The McGraw−Hill/Irwin Companies.
|
| [11] |
Perneger, T. V., Courvoisier, D. S., Hudelson, P. M., & Gayet-Ageron, A. (2015). Sample size for pre-tests of questionnaires. Quality of life Research, 24, 147-151.
|
| [12] |
Awoke, T., Tekle, Y., & Misgana, M. (2017). Effect of sowing methods and seed rate on yield of bread wheat (Triticumaestivum L.) at South Ari District, South Omo Zone, Snnpr, Ethiopia. International J. of Research-Granthaalayah, 5(6), 175-180.
|
| [13] |
Chaudhary, J., Khan, U., & Shah, S. (2015). Effect of sowing methods and seed rates on wheat yield and water productivity. 267-272.
|
| [14] |
Gauchan, D., Magar, D. T., Gautam, S., Singh, S., & Singh, U. S. (2015). Strengthening seed system for rice seed production and supply in Nepal. IRRI-NARC collaborative EC-IFAD funded project on Seed Net Development. Socioeconomics and Agricultural Research Policy Division, Nepal Agricultural Research Council, Nepal. 40p.
|
| [15] |
Debbarma, M., & Das, S. (2017). Priming of Seed: Enhancing Growth and Development. International Journal of Current Microbiology and Applied Sciences. 6, 2390-2396.
|
| [16] |
Argaw, M. (2015). Good Agricultural Adaptation Practices in Ethiopia. UNIQUE Forestry and Land Use and Kulima Integrated Development Solutions.
|
| [17] |
Nurbekov, A., Suleimenov, M., Friedrich, T., &Taher, F. (2012). Effect of Tillage Methods on Productivity of Winter Wheat. Journal of Arid Land Studies, 255-258.
|
| [18] |
Mujeeb, R. U., Soomro, U. A., Odhano, E. A., &Gul, S. (2009). Effects of Sowing Method and Seed Rate on Growth. World Journal of Agricultural Sciences, 159-163.
|
| [19] |
Kumar, R. (2009). Good agricultural practices for Wheat. G. B. Pant University of Agriculture & Technology, Pantnagar-Uttrakhand.
|
| [20] |
Khan, A., Islam, S., Hasan, M., &Haque, M. (2018). Effect of different irrigation levels on the performance of wheat. Progressive Agriculture, 99-106.
|
| [21] |
Paudyal, N. P. (2011). Role of Irrigation in Crop Production and Productivity: A Comparative Study of Tube Well and Canal Irrigation in Shreepur VDC of Kanchanpur District. The Geographical Journal of Nepal, 8, 53-62.
|
| [22] |
Kumar, V. (2012). Irrigation in Wheat Cultivation. agropedia.
|
| [23] |
Dangwa, L., Singh, A., Singh, T., & Sharma, C. (2010). Effect of Weeds on the Yield of Wheat Crop in Tehsil Nowshera. Journal of American Science.
|
| [24] |
Safdar, M. E., Ali, A., Aziz, A., &Yasin, M. (2011). Comparative efficacy of different weed management strategies in wheat. Chilean journal of agricultural research.
|
| [25] |
Roelfs, A. P. (1992). Rust diseases of wheat: concepts and methods of disease management. Cimmyt.
|
| [26] |
Soner, D., & Erkilic, A. (2016). Effect of wheat cultivars, fertilizers, and fungicides on Fusarium foot rot disease of wheat. Turkish Journal of Agriculture and Forestry, 101-108.
|
| [27] |
Oerke, E. C. (1994). Crop losses to pests. The Journal of Agricultural Science, 144(1), 31-43.
|
| [28] |
Singh, R. P., & Julie, N. M. (2007). The challenges of maintaining wheat productivity: pests, diseases, and potential epidemics. Euphytica, 417-430.
|
| [29] |
Bockus, W. W., Appel, J. A., Bowden, R. L., Fritz, A. K., Gill, B. S., Martin, T. J., & Eversmeyer, M. G. (2001). Success stories: Breeding for wheat disease resistance in Kansas. Plant Disease, 85(5), 453-461.
|
| [30] |
Anonymous. (2014). the Why and How of Soil Testing. Canada: Prime Edward Island.
|
| [31] |
Kebede, D., Ketemaa, M., &Dech, N. (2017). Disparity in adoption of wheat production technology packages in eastern ethiopia. Review of Agricultural and Applied Economics, 22-29.
|
| [32] |
Mulugeta, T., &Hundie, B. (2012). Impacts of adoption of improved wheat technologies on households' food consumption in southeastern Ethiopia (No. 1007-2016-79620).
|
| [33] |
Tesfaye, S., Bedada, B., & Mesay, Y. (2016). Impact of improved wheat technology adoption on productivity. African Crop Science Journal, 24, 127-135.
|
| [34] |
Rogers EM. (2003). Diffusion of innovations (5th Ed). Free Press, New York, USA.
|
| [35] |
Ban AW, Hawkins H. (1996). Agricultural Extension. Oxford, Malden, MA: Blackwell Science. Blackwell Science, Malden, MA.
|
| [36] |
Hosmor, D., & Lemshew, S. (1989). Applied logistic regresstion. New York: A Wiley-Inter Science Puplication.
|
| [37] |
Hassan Salih, O. N., Mubarak, A., &Hassabo, A. (2012). Effect of crop residues on soil fertility and yield of wheat (Triticumaestivum) - guar (Cymopsistetragonoloba) crops in dry tropics. International Journal of Scientific & Engineering Research 3(10).
|
| [38] |
FAO/IAEA. (2003). Management of crop residues forsustainable crop production. International automic energy agency.
|
Cite This Article
-
-
@article{10.11648/j.ijaas.20241003.15,
  author = {Mahara Ganesh and Karki Anju},
  title = {Effect of Various Improved Technology in Wheat Production Zone of Nepal
},
  journal = {International Journal of Applied Agricultural Sciences},
  volume = {10},
  number = {3},
  pages = {126-137},
  doi = {10.11648/j.ijaas.20241003.15},
  url = {https://doi.org/10.11648/j.ijaas.20241003.15},
  eprint = {https://article.sciencepublishinggroup.com/pdf/10.11648.j.ijaas.20241003.15},
  abstract = {The study was held in 2024 in the Kailari, Gauriganga, Godawari, and Dhangadhi local level of Kailali District of Nepal to evaluate and identify the factors impacting the adoption of a number of sophisticated technologies in the research area. Data were collected from 200 respondents utilizing a semi-structured interview form, using simple random selection. The factors influencing the adoption of better technologies in wheat production were identified using a logistic regression model. Age, gender, ethnicity, and area of cultivation are socioeconomic elements that have been linked to the adoption of appropriate agricultural practices, as well as training, technical advice, and membership. The adoption of seed replacement was positively significant (P<0.1) as a result of the training. The adoption of seed varieties was positively significant (P<0.05) for cultivated area. The farmers who were involved in farmer groups or Cooperative had 2.209 times higher odds for the adoption of improved seed compared to the odds for farmers who were not involved in farmer groups. Advice from the technician had a positively significant (P<0.05) impact on the date of sowing. The use of more frequent irrigation was positively significant (P<0.05) in relation to the age of the household head. The split nitrogen application was positively significantly influenced by super zone membership (P<0.05).
},
 year = {2024}
}
 Copy
|
Copy
|
 Download
-
TY  - JOUR
T1  - Effect of Various Improved Technology in Wheat Production Zone of Nepal

AU  - Mahara Ganesh
AU  - Karki Anju
Y1  - 2024/06/06
PY  - 2024
N1  - https://doi.org/10.11648/j.ijaas.20241003.15
DO  - 10.11648/j.ijaas.20241003.15
T2  - International Journal of Applied Agricultural Sciences
JF  - International Journal of Applied Agricultural Sciences
JO  - International Journal of Applied Agricultural Sciences
SP  - 126
EP  - 137
PB  - Science Publishing Group
SN  - 2469-7885
UR  - https://doi.org/10.11648/j.ijaas.20241003.15
AB  - The study was held in 2024 in the Kailari, Gauriganga, Godawari, and Dhangadhi local level of Kailali District of Nepal to evaluate and identify the factors impacting the adoption of a number of sophisticated technologies in the research area. Data were collected from 200 respondents utilizing a semi-structured interview form, using simple random selection. The factors influencing the adoption of better technologies in wheat production were identified using a logistic regression model. Age, gender, ethnicity, and area of cultivation are socioeconomic elements that have been linked to the adoption of appropriate agricultural practices, as well as training, technical advice, and membership. The adoption of seed replacement was positively significant (P<0.1) as a result of the training. The adoption of seed varieties was positively significant (P<0.05) for cultivated area. The farmers who were involved in farmer groups or Cooperative had 2.209 times higher odds for the adoption of improved seed compared to the odds for farmers who were not involved in farmer groups. Advice from the technician had a positively significant (P<0.05) impact on the date of sowing. The use of more frequent irrigation was positively significant (P<0.05) in relation to the age of the household head. The split nitrogen application was positively significantly influenced by super zone membership (P<0.05).

VL  - 10
IS  - 3
ER  -
Copy
|
Download