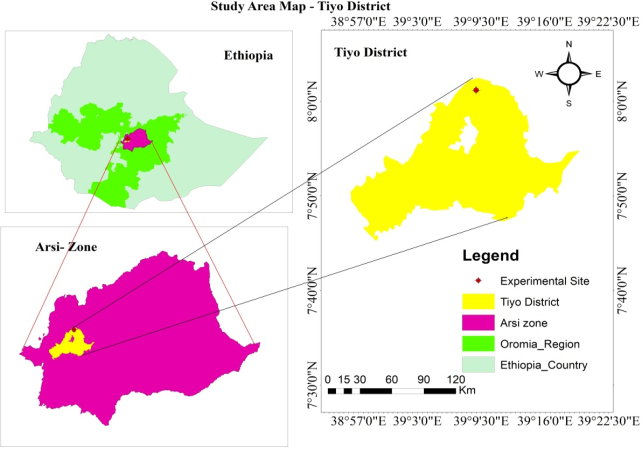
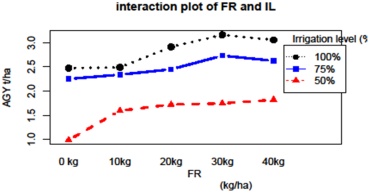
Nutrient availability to crops is a function of soil type, moisture condition, environment, crop type, and management and their interaction affects nutrient use efficiencies and crop growth conditions. The objective of this study was to determine the optimum P rate and deficit irrigation level, as well as to identify the interactive effect of nutrient and moisture levels on yield and yield quality malt barley under irrigation in Ormiya region Tiyo district. The experiment was conducted at small plot level for three consecutive years from 2020/21 to 2022/23 G.C. This experiment was conducted at Kulumsa Agricultural Research Center On-Station arranged by split-plot layout with RCBD design by three replications. Irrigation amounts (100%, 75% and 50%) were assigned the main plot and phosphorus fertilizer rates (0, 10, 20, 30 and 40 kg) corresponded to the subplot. The combined effect of irrigation levels and phosphorus fertilizer rate had a significant effect (p < 0.05) on malt barely grain yield, above-ground biomass, thousand kernel weight and water productivity but not on plant height, seeds per spike and protein content. The highest grain yield and above-ground biomass were 3.16 t/ha and 6.77 t/ha obtained from the application of 100% ETc with 30 kg of phosphorus fertilizer. The maximum water productivity (0.97 kg/m3) was observeat the application of 75% ETc with 30 kg of Phosphorus fertilizer while more profitable practice was found at 100% ETc with 30 kg of phosphorus application. The highest protein content (15.57%) was observed at the application of 50% deficit irrigation and the lowest (14.66%) was observed at 100% ETc irrigation application. Applying the optimum amount of irrigation with 30 Kg phosphorus fertilizer gives high grain and above biomass yield and is economically profitable in Tiyo district and agroecologies similar to Tiyo.
| Published in | International Journal of Applied Agricultural Sciences (Volume 10, Issue 3) |
| DOI | 10.11648/j.ijaas.20241003.16 |
| Page(s) | 138-148 |
| Creative Commons |
This is an Open Access article, distributed under the terms of the Creative Commons Attribution 4.0 International License (http://creativecommons.org/licenses/by/4.0/), which permits unrestricted use, distribution and reproduction in any medium or format, provided the original work is properly cited. |
| Copyright |
Copyright © The Author(s), 2024. Published by Science Publishing Group |
Malt Barely, Irrigation Level, Phosphorus Fertilizer, Grain Yield and Water Productivity
Physical properties | |||||||
|---|---|---|---|---|---|---|---|
BD (g/cm3) | Texture | Soil type | FC (%) | PWP (%) | TAW | ||
Sand | Silt | Clay | |||||
1.25 | 52 | 27 | 21 | Sandy clay loam | 33.60 | 21,8 | 11.8 |
Chemical properties | ||||
|---|---|---|---|---|
pH | TN (%) | OC (%) | OM (%) | Av. P (mg/Kg) |
6.11 | 0.12 | 2.16 | 3.72 | 11.12 |
Treatment | P rate (kg/ha) | ||||
|---|---|---|---|---|---|
Irrigation Intervals | 0 | 10 | 20 | 30 | 40 |
100% ETc | T1 | T2 | T3 | T4 | T5 |
75% ETc | T6 | T7 | T8 | T9 | T10 |
50% ETc | T11 | T12 | T13 | T14 | T15 |
Irrigation Levels | Plant Height (cm) | Spike length (cm) | Seed per spike | HLW (gm) | Protein (%) |
|---|---|---|---|---|---|
100% ETc | 62.63a | 6.83a | 20.72a | 60.59a | 14.66b |
75% ETc | 62.03a | 6.69a | 20.54a | 60.78a | 14.9ab |
50% ETc | 58.08b | 6.24b | 19.23b | 56.96b | 15.57a |
LSD (0.05) | 2.62 | 0.23 | 0.34 | 1.04 | 0.80 |
CV (%) | 7.3 | 6 | 3.1 | 3 | 7.4 |
P (kg/ha) | |||||
40 | 61.52 | 6.68ab | 20.16 | 59.65a | 14.66 |
30 | 61.44 | 6.72a | 20.12 | 59.89a | 14.94 |
20 | 61.48 | 6.54bc | 20.41 | 60.05a | 15.05 |
10 | 61.30 | 6.5bc | 20.13 | 59.47a | 15.19 |
0 | 60.32 | 6.4c | 20.011 | 58.16b | 15.37 |
LSD (0.05) | NS | 0.16 | NS | 0.97 | NS |
CV (%) | 5.4 | 4.4 | 4.7% | 2.9 | 6.9 |
Treatment combinations | Grain yield (t/ha) | Biomass yield (t/ha) | Harvesting index (%) | Water productivity (kg/m3) | TKW (gm.) | |||||
|---|---|---|---|---|---|---|---|---|---|---|
100%: 0kg | 2.48ef | 5.78cd | 42.9cd | 0.67f | 46.48bcd | |||||
100%: 10kg | 2.49ef | 5.76cd | 43.57cd | 0.67f | 46.61abcd | |||||
100%: 20kg | 2.91bc | 6.15bc | 47.28ab | 0.79de | 47.29abc | |||||
100%: 30kg | 3.16a | 6.77a | 47.41ab | 0.86bcd | 47.37abc | |||||
100%: 40kg | 3.06ab | 6.62ab | 46.24abc | 0.83cde | 47.56a | |||||
75%: 0kg | 2.25g | 5.46de | 41.27d | 0.78e | 45.93d | |||||
75%: 10kg | 2.34fg | 5.44de | 43.34cd | 0.83cde | 46.38cd | |||||
75%: 20kg | 2.45efg | 5.09e | 48.64a | 0.85cd | 46.76abcd | |||||
75%: 30kg | 2.73cd | 5.78cd | 47.49ab | 0.97a | 47.52ab | |||||
75%: 40kg | 2.63de | 5.97cd | 44.3bcd | 0.93ab | 47.3abc | |||||
50%: 0 kg | 0.99j | 2.43h | 41.03d | 0.47g | 40.49g | |||||
50%: 10kg | 1.6i | 3.79g | 42.63d | 0.76e | 42.74e | |||||
50%: 20kg | 1.72hi | 3.9fg | 44.45bcd | 0.83cde | 42.32e | |||||
50%: 30kg | 1.75hi | 4.46f | 41.27d | 0.81cde | 41.19fg | |||||
50%: 40kg | 1.82h | 3.94fg | 47.92a | 0.88bc | 42.22ef | |||||
LSD | 0.2 | 0.59 | 3.45 | 0.07 | 1.08 | |||||
CV (%) | (a) 13.2 | (b) 9.1 | (a) 15.7 | (b) 11.7 | (a) 5.7 | (b) 8.0 | (a) 11.7 | (b) 9.2 | (a) 7.9 | (b) 2.5 |
Treatments | Grain Yield (kg/ha) | CWR (mm) | WP (Kg/m3) | Relative water saved (%) | Relative yield reduction (%) | Ky |
|---|---|---|---|---|---|---|
100%: 0kg | 2480 | 388 | 0.67f | - | 22 | - |
100%: 10kg | 2490 | 388 | 0.67f | - | 21 | - |
100%: 20kg | 2910 | 388 | 0.79de | - | 8 | - |
100%: 30kg | 3160 | 388 | 0.86bcd | - | - | - |
100%: 40kg | 3060 | 388 | 0.83cde | - | 3 | - |
75%: 0kg | 2250 | 291 | 0.78e | 25 | 29 | 1.2 |
75%: 10kg | 2340 | 291 | 0.83cde | 25 | 26 | 1 |
75%: 20kg | 2450 | 291 | 0.85cd | 25 | 22 | 0.9 |
75%: 30kg | 2730 | 291 | 0.97a | 25 | 14 | 0.5 |
75%: 40kg | 2630 | 291 | 0.93ab | 25 | 17 | 0.7 |
50%: 0 kg | 990 | 194 | 0.47g | 50 | 69 | 1.4 |
50%: 10kg | 1600 | 194 | 0.76e | 50 | 49 | 1 |
50%: 20kg | 1720 | 194 | 0.83cde | 50 | 46 | 0.9 |
50%: 30kg | 1750 | 194 | 0.81cde | 50 | 45 | 0.9 |
50%: 40kg | 1820 | 194 | 0.88bc | 50 | 42 | 0.8 |
Treatment | Grain Yield (kg/ha) | TVC (ETB/ha) | Net Return (ETB/ha) | MRR (%) |
|---|---|---|---|---|
50%ET& 0kg P | 990.00 | 5,774.00 | 29,866.00 | - |
75%ETc&0kg P | 2,251.11 | 7,374.00 | 73,666.00 | 2737.50 |
50%ETc&10kg P | 1,594.44 | 7,762.68 | 49,637.30 | D |
100%ET&0kg P | 2,475.56 | 8,974.00 | 80,146.02 | 2518.64 |
75%ETc&10kg P | 2,338.89 | 9,362.68 | 74,837.32 | D |
50%ETc&20kg P | 1,722.22 | 9,751.37 | 52,248.62 | D |
100%ETc&10kg P | 2,490.00 | 10,962.68 | 78,677.32 | 2181.82 |
75%ETc&20 kg P | 2,450.00 | 11,351.37 | 76,848.63 | D |
50%ETc&30kg P | 1,745.56 | 11,740.05 | 51,099.96 | D |
100%ETc&20kg P | 2,912.22 | 12,951.37 | 91,888.62 | 3367.30 |
75%ETc&30 kg P | 2,731.11 | 13,340.05 | 84,979.94 | D |
50%ETc&40 kg P | 1,822.22 | 13,728.74 | 51,871.26 | D |
100%ETc&30 kg P | 3,116.00 | 14,940.05 | 93,379.95 | 3426.74 |
75%ETc&40 kg P | 2,627.78 | 15,328.74 | 79,271.27 | D |
100%ETc&40 kg P | 3,057.78 | 16,928.74 | 93,151.27 | 867.50 |
RCBD | Random Complete Block Design |
ETc | Crop Evapotranspiration |
FC | Field Capacity |
PWP | Permanent Wilting Point |
TAW | Total Available Water |
TN | Total Nitrogen |
OC | Organic Carbon |
OM | Organic Matter |
Av.P | Available Phosphorus |
KARC | Kulumsa Agricultural Research Center |
HLW | Hectoliter Weight |
| [1] | Socio-economic context and role of agriculture Country faCt Sheet on food and agriCulture poliCy trendS, 2014. [Online]. Available: |
| [2] | M. A. Gebul, “Trend, status, and challenges of irrigation development in Ethiopia—A review,” Sustainability (Switzerland), vol. 13, no. 10, 2021, |
| [3] | G. G. Haile, “Irrigation in Ethiopia, a Review,” vol. 5, no. 15, pp. 141–148, 2015. |
| [4] | F. Hagos, G. Makombe, R. E. Namara, and S. B. Awulachev, “Importance of irrigated agriculture to the ethiopian economy,” Ethiop J Dev Res, pp. 127–155, 2011. |
| [5] | D. G. Eshete, B. G. Sinshaw, and K. G. Legese, “Critical review on improving irrigation water use efficiency: Advances, challenges, and opportunities in the Ethiopia context,” Water-Energy Nexus, vol. 3, pp. 143–154, 2020, |
| [6] | L. Mendes, Diogo Machado; Paglietti, “Irrigation market brief,” Food Africulture Organization of the United Nations., p. 57, 2015. |
| [7] | Business Innovation Facility (BIF), “Assessment of the Malting Barley Market System in Ethiopia,” no. February, 2018. |
| [8] | B. Dari, C. W. Rogers, and X. Liang, “Plant, grain, and soil response of irrigated malt barley as affected by cultivar, phosphorus, and sulfur applications on an alkaline soil,” J Plant Nutr, vol. 42, no. 9, pp. 1061–1071, 2019, |
| [9] | S. Lindi, B. Iticha, and M. Hone, “Effect of Moisture Stress at Different Growth Stage on Wheat (Triticumaestevum L.) Yield and Water Productivity at Kulumsa, Ethiopia,” vol. 10, pp. 3–6, 2021. |
| [10] | J. N. Hassene and T. Seid, “Jemal Nur Hassene, Mukerem Taha Seid. Comparative Performance Evaluation of Alternate and Convectional Furrow Irrigation under Different Water Application Level on Cabbage Water Use Efficiency and Economic Analysis,” American Journal of Environmental and Resource Economics, vol. 2, no. 3, pp. 123–131, 2017, |
| [11] | K. T. Kassaye, W. A. Yilma, M. H. Fisha, and D. H. Haile, “Yield and water use efficiency of potato under alternate furrows and deficit irrigation,” International Journal of Agronomy, vol. 2020, 2020, |
| [12] | M. Smith, CROPWAT: A computer program for irrigation planning and management, no. 46. 1992. |
| [13] | D. P. Fao, R. G. Allen, L. S. Pereira, D. Raes, and M. Smith, “FAO. 1998. Crop Evapotranspiration : Guidelines FAO Irrigation and Drainage Paper Crop Evapotranspiration,” Irrigation and Drainage, vol. 300, no. November, p. 300, 2015. |
| [14] | CIMMYT, “From agronomic data to farmer recommendations: An economics workbook,” p. 63, 1988. |
| [15] | A. A. Gomez, K. A., and Gomez, “Statistical procedures for agricultural research. 2nd ed. John Willy and Sons, inc,” New York, p. 680, 1984. |
| [16] | A. Tabarzad, A. A. Ghaemi, and S. Zand-parsa, “Barley Grain Yield and Protein Content Response to Deficit Irrigation and Sowing Dates in Semi-Arid Region,” Mod Appl Sci, vol. 10, no. 10, p. 193, 2016, |
| [17] | M. H. Raza, G. U. Sadozai, M. S. Baloch, E. A. Khan, I. Din, and K. Wasim, “Effect of irrigation levels on growth and yield of mungbean,” Pakistan Journal of Nutrition, vol. 11, no. 10, pp. 876–879, 2012, |
| [18] | W. Zone, M. Kassa, and Z. Sorsa, “Effect of Nitrogen and Phosphorus Fertilizer Rates on Yield and Yield Components of Barley (Hordeum Vugarae L.) Varieties at Damot Gale District, Effect of Nitrogen and Phosphorus Fertilizer Rates on Yield and Yield Components of Barley Hordeum Vugar,” no. March, 2023, |
| [19] | A. H. Rizk and M. M. Sherif, “Effect of Soil Moisture Depletion on the Yield of Wheat under Sprinkler Irrigation at Toshka Area, Egypt,” Middle East Journal of Agriculture Research, vol. 3, no. 4, pp. 981–987, 2014. |
| [20] | G. Bekele, T. Birhanu, and F. Terefe, “Growth, yield, yield components, and grain qualities of groundnut (Arachis hypogaea L.) as affected by liming and phosphorus rates in southwest Ethiopia,” Oil Crop Science, vol. 8, no. 3, pp. 165–173, Jul. 2023, |
| [21] | C. W. Rogers, G. Hu, and B. A. King, “Deficit irrigation effects on adjunct and all-malt barley yield and quality,” Agron J, vol. 115, no. 3, pp. 1161–1173, 2023, |
| [22] | G. P. Fox and H. M. Bettenhausen, “Variation in quality of grains used in malting and brewing,” Frontiers in Plant Science, vol. 14. Frontiers Media S.A., 2023. |
| [23] | H. M. Al-ghobari and A. Z. Dewidar, “De fi cit irrigation and irrigation methods as on-farm strategies to maximize crop water productivity in dry areas,” pp. 399–409, 2018, |
| [24] | A. Tesfaye, “Effect of Deficit Irrigation on Crop Yield and Water Productivity of Crop, a Synthesis Review,” vol. 11, pp. 2–8, 2022, |
| [25] | M. Najarchi, F. Kaveh, H. Babazadeh, and M. Manshouri, “Determination of the yield response factor for field crop deficit irrigation,” Afr J Agric Res, vol. 6, no. 16, pp. 3700–3705, 2011. |
| [26] | A. H, “Effects of Deficit Irrigation and Phosphorus Levels on Growth, Yield, Yield Components and Water use Efficiency of Mung Bean (Vigna radiata (l.) Wilczek) at Alage, Central Rift Valley of Ethiopia,” Agric Res Technol, vol. 21, no. 3, 2019, |
APA Style
Hone, M., Eticha, B., Nanesa, K., Lindi, S. (2024). Response of Malt Barley (Hordeum distichum L.) to Different Phosphorus Fertilizer Rates and Irrigation Levels Under Furrow Irrigation Methods in South Eastern Ethiopia. International Journal of Applied Agricultural Sciences, 10(3), 138-148. https://doi.org/10.11648/j.ijaas.20241003.16
ACS Style
Hone, M.; Eticha, B.; Nanesa, K.; Lindi, S. Response of Malt Barley (Hordeum distichum L.) to Different Phosphorus Fertilizer Rates and Irrigation Levels Under Furrow Irrigation Methods in South Eastern Ethiopia. Int. J. Appl. Agric. Sci. 2024, 10(3), 138-148. doi: 10.11648/j.ijaas.20241003.16
AMA Style
Hone M, Eticha B, Nanesa K, Lindi S. Response of Malt Barley (Hordeum distichum L.) to Different Phosphorus Fertilizer Rates and Irrigation Levels Under Furrow Irrigation Methods in South Eastern Ethiopia. Int J Appl Agric Sci. 2024;10(3):138-148. doi: 10.11648/j.ijaas.20241003.16
@article{10.11648/j.ijaas.20241003.16,
  author = {Mehiret Hone and Bakasho Eticha and Kebede Nanesa and Samuel Lindi},
  title = {Response of Malt Barley (Hordeum distichum L.) to Different Phosphorus Fertilizer Rates and Irrigation Levels Under Furrow Irrigation Methods in South Eastern Ethiopia
},
  journal = {International Journal of Applied Agricultural Sciences},
  volume = {10},
  number = {3},
  pages = {138-148},
  doi = {10.11648/j.ijaas.20241003.16},
  url = {https://doi.org/10.11648/j.ijaas.20241003.16},
  eprint = {https://article.sciencepublishinggroup.com/pdf/10.11648.j.ijaas.20241003.16},
  abstract = {Nutrient availability to crops is a function of soil type, moisture condition, environment, crop type, and management and their interaction affects nutrient use efficiencies and crop growth conditions. The objective of this study was to determine the optimum P rate and deficit irrigation level, as well as to identify the interactive effect of nutrient and moisture levels on yield and yield quality malt barley under irrigation in Ormiya region Tiyo district. The experiment was conducted at small plot level for three consecutive years from 2020/21 to 2022/23 G.C. This experiment was conducted at Kulumsa Agricultural Research Center On-Station arranged by split-plot layout with RCBD design by three replications. Irrigation amounts (100%, 75% and 50%) were assigned the main plot and phosphorus fertilizer rates (0, 10, 20, 30 and 40 kg) corresponded to the subplot. The combined effect of irrigation levels and phosphorus fertilizer rate had a significant effect (p 3) was observeat the application of 75% ETc with 30 kg of Phosphorus fertilizer while more profitable practice was found at 100% ETc with 30 kg of phosphorus application. The highest protein content (15.57%) was observed at the application of 50% deficit irrigation and the lowest (14.66%) was observed at 100% ETc irrigation application. Applying the optimum amount of irrigation with 30 Kg phosphorus fertilizer gives high grain and above biomass yield and is economically profitable in Tiyo district and agroecologies similar to Tiyo.
},
 year = {2024}
}
TY  - JOUR
T1  - Response of Malt Barley (Hordeum distichum L.) to Different Phosphorus Fertilizer Rates and Irrigation Levels Under Furrow Irrigation Methods in South Eastern Ethiopia

AU  - Mehiret Hone
AU  - Bakasho Eticha
AU  - Kebede Nanesa
AU  - Samuel Lindi
Y1  - 2024/06/29
PY  - 2024
N1  - https://doi.org/10.11648/j.ijaas.20241003.16
DO  - 10.11648/j.ijaas.20241003.16
T2  - International Journal of Applied Agricultural Sciences
JF  - International Journal of Applied Agricultural Sciences
JO  - International Journal of Applied Agricultural Sciences
SP  - 138
EP  - 148
PB  - Science Publishing Group
SN  - 2469-7885
UR  - https://doi.org/10.11648/j.ijaas.20241003.16
AB  - Nutrient availability to crops is a function of soil type, moisture condition, environment, crop type, and management and their interaction affects nutrient use efficiencies and crop growth conditions. The objective of this study was to determine the optimum P rate and deficit irrigation level, as well as to identify the interactive effect of nutrient and moisture levels on yield and yield quality malt barley under irrigation in Ormiya region Tiyo district. The experiment was conducted at small plot level for three consecutive years from 2020/21 to 2022/23 G.C. This experiment was conducted at Kulumsa Agricultural Research Center On-Station arranged by split-plot layout with RCBD design by three replications. Irrigation amounts (100%, 75% and 50%) were assigned the main plot and phosphorus fertilizer rates (0, 10, 20, 30 and 40 kg) corresponded to the subplot. The combined effect of irrigation levels and phosphorus fertilizer rate had a significant effect (p 3) was observeat the application of 75% ETc with 30 kg of Phosphorus fertilizer while more profitable practice was found at 100% ETc with 30 kg of phosphorus application. The highest protein content (15.57%) was observed at the application of 50% deficit irrigation and the lowest (14.66%) was observed at 100% ETc irrigation application. Applying the optimum amount of irrigation with 30 Kg phosphorus fertilizer gives high grain and above biomass yield and is economically profitable in Tiyo district and agroecologies similar to Tiyo.

VL  - 10
IS  - 3
ER  -
Irrigation and Water Harvesting Research/Kulumsa Agricultural Research Center, Asella, Ethiopia
Irrigation and Water Harvesting Research/Kulumsa Agricultural Research Center, Asella, Ethiopia
Irrigation and Water Harvesting Research/Kulumsa Agricultural Research Center, Asella, Ethiopia
Irrigation and Water Harvesting Research/Kulumsa Agricultural Research Center, Asella, Ethiopia
Information