Research Article | | Peer-Reviewed

An Information-Theoretic Evolutionary Analysis of Minimally Monophyletic Groups

Received: 24 September 2026     Accepted: 5 October 2026     Published: 26 October 2026
Views:       Downloads:
Abstract

Structural monophyly is a method of modeling macroevolution in terms of minimally monophyletic groups. It renders taxonomy amenable to the mathematical modeling of biophysics by standardizing the genus as one ancestral species and about four immediate descendant species, each genus monothetic in sharing the isomorphy of the ancestral species newest traits, and by unitizing taxonomic variables an analogue of mass, velocity and time. The biophysics of macroevolution is presented as a new field. In the present paper, taxonomy is demonstrated as foundational in providing organized data for analysis of the processes underlying the origin, persistence and resilience of lineages of living organisms. The processes governed and operating in minimally monophyletic groups are summarized and evaluated mathematically at the taxon level, involving features such as the Pareto ratio and a fractal dimension of 1.161. Individuation is equated with both taxonomic identification and evolutionary survival against environmental resistance. As powering a statistically well supported path through geologic time and environmental space, individuation is found to be directional. As embodied in taxa, using one informational bit per newly fixed trait, it can be analyzed with Shannon-Turing sequential Bayes using odds tables and standard deviations on 1-tailed distributions. One species with 4 new traits is correctly identifiable 42 times out of 43, which may be extended to species survival on environmental testing. That a genus is correctly identifiable about 1.7 million times for each failure implies a functional reason for lineage survival for 100 million years. Origination and extinction are modeled for a minimally monophyletic group with initial burst of speciation and gradual extinction based on observed taxonomic analyses. Kullbuck-Leibler divergence analysis generalizes the individuation analysis. Species are shallow entropy wells while genera are deep ones. Hamming sphere-packing showed that error correction and avoidance are robust in the studied groups of bryophytes through ancestral trait redundancy. An endless belt model allows older characters to change state upon exposure to environmental changes, preserving the old state as survival potential within the genetic constraints of a taxonomic description. This study suggests that there are shared, perhaps universal, complex and potentially mathematically modeled processes underlying biological diversity at the supraspecific level as lineages change through time. If universal, then ecosystems are complexly mutualistic in survival.

Published in European Journal of Biophysics (Volume 14, Issue 2)
DOI 10.11648/j.ejb.20261402.12
Page(s) 34-46
Creative Commons

This is an Open Access article, distributed under the terms of the Creative Commons Attribution 4.0 International License (http://creativecommons.org/licenses/by/4.0/), which permits unrestricted use, distribution and reproduction in any medium or format, provided the original work is properly cited.

Copyright

Copyright © The Author(s), 2026. Published by Science Publishing Group

Keywords

Entropy Wells, Error-Correction, Hamming Sphere-Packing, Individuation, Kullbuck-Leibler Divergence, Structural Monophyly

1. Introduction
Structural monophyly is a simplifying, resolving and syncretizing concept of taxonomic and evolutionary analysis. It is fundamentally based on morphological data, being directly involved in adaptation through descent with modification. It contrasts with cladistic analysis based on shared ancestry because structural monophyly has more resolution and is not destructive of knowledge by synonymization of well-established taxa through a nomenclatural rule—that of holophyly. It subsumes molecular systematics, and is a bridge between systematics, biophysics and sustainability science . The taxonomy-fueled analysis of the processes of macroevolution should be considered a branch of physics, perhaps the most important given the present existential crisis.
Essentially, an evolutionary tree is much like a phyletic key, polychotomous, with ancestral taxa at the nodes . This tree, a caulogram, is much the same as a stem-taxon cladogram but its branching structure is determined empirically. The key analytic element is the minimally monophyletic group (MMG), which is revealed through taxonomic revision as one ancestral species and about four immediate descendant species, these reduced by gradual extinction. Extinction may be simulated when a descendant species originates a new genus and is subsumed into it, nomenclaturally. Initial and overall support for this concept is from studies of numbers of species per genus in many different faunistic and floristic groups , showing most genera are of 1 to about 7 species in hollow curve graphs. Ancestor-descendant revisionary analysis of large groups, to date restricted to the bryophytes, demonstrates the validity of this concept (p. 23),.
A further and critical supportive observation is that, in a MMG the ancestral species donates to each of the immediate descendant species all the new traits it has generated upon its own speciation. This produces an isomorphic trait set linking the ancestral species and its descendant species. The number of new traits (character states) generated and fixed in one speciation event is, upon study, about four. This number is significant in being apparently optimal in evolutionary processes. Past studies (p. 28) have proposed that the Pareto ratio is central to speciation, such that one descendant species generates four of its own descendant species, and all five are monothetic, sharing about four traits as isomorphisms . That four species of one genus makes five of another can be described as a fractal dimension of ln5/ln4, or 1.161. This Pareto/fractal characteristic may be a universal feature of macroevolution. Universals are important because they help infer the whole from partial data. Eash MMG is treated nomenclaturally as a genus, nominally a “microgenus.” There is evidence that the fractal structure of a microgenus is matched in taxa of higher rank (as self-similarity).
Molecular systematics can be integrated into structural monophyly through evidence of ancestor-descendant relationships implied by paraphyly-apophyly evidence , when available. Because clades are sets of traits, however, not evolutionary actors themselves, relationships of descent with modification of individual species are not immediately clarified and are largely only implied and poorly resolved.
Detailed statistical support for the information on evolutionary relationships in MMGs is based to date on Shannon-Turing sequential Bayesian analysis. Sequential Bayesian methods allow the posterior of one probabilistic calculation to be the prior of the next. If there is no negative data, such as a reversal in appearance of a traits, then the probability of support increases as a rachet, as is discussed below.
The present paper is intended to shore up the sequential Bayes statistical structure of macroevolutionary analysis of structural monophyly with a rigorous grounding in information and physical theory.
Given the depth of the mathematics, a multidisciplinary physical analysis of the fundamental processes governing the generation, resilience and sustainability of biological diversity required computational aid. Researchers must compete with their peers in the marketplace of ideas. I foresee a coming dimension of taxonomy that will require a new field, taxology, with the same relationship to taxonomy as cosmology has to astronomy . This would be a field that requires taxonomic revisions as a gateway for data. Collections institutions now hold millions of samples of the natural world, and these await biophysics analysis.
2. Materials and Methods
Methodologically, taxonomy provides data for taxology, the biophysics of macroevolution, which uses analytic methods of physics, often analogically but effective (p. 32), for analysis. Seed concepts, overall guidance, selection of results, and final composition was provided by the author. This study was augmented by an online computer service (Microsoft Copilot using ChatGPT 5.6) , which was used to generate and implement various mathematical, statistical, and physics-based tests of logical coherence and physical applicability. The enhanced model of the modern online computational service used in this study was fully mathematically enabled, well versed in theory, and are to some extent acted as an ideational engine for analytic methods . In sum, the author provided original and governing ideas, the AI provided implementation of analysis and suggestions for synthesis. Other services, such as Google Gemini, were used for Internet searches and methodological explication. In addition to Copilot, Desmos graphing software and MS Excel spreadsheets were found helpful. The data involved are those available in previous publications (p. 29-32) in which the concepts and methods examined here are detailed. It should be evident that this methodological approach is new and only possible with very recent advances in information processing and analysis.
3. Results
3.1. Individuation of Species and Genera
A species has strong statistical support for its evolutionary existence and for its recognition as a basic unit in taxonomy. Revisionary study (pp. 2, 8, 12, 16, 18, 20) of lineages of bryophytes consistently demonstrated that a descendant species differs from its immediate ancestral species by about four independent, morphological traits. In the most-studied bryophyte groups, family Streptotrichaceae Pottiaceae and tribe Pleuroweisieae, the averages are 4.15 and 3.7 new traits per species, respectively . The number of trait changes in nearly all speciation events are about four, so the stem-taxon evolutionary tree, the caulogram, is well-locked. There is no room for intermediate hypothetical shared ancestors. The number of traits in a new taxon creates a corridor through evolutionary competitive time reducing uncertainty of evolutionary survival as paralleled in degree of certainty for taxonomic recognition.
Individuation is the evolutionary inertial force of a taxon that resists environmental friction by positive features of natural selection and mutation. This comprises an ancestor-descendant rachet that implies that phenotypic selection generates directional phenotypic diversification as demonstrated by Rieseberg et al. .
Formally, Shannon-Turing sequential Bayes provides for each ancestor to descendant step prior odds, Oprior, for correct individuation, number of new traits contributing a likelihood ratio LRi, and posterior odds:
Opost=Oprior×∏iLRi
And, as each trait is assigned 1 bit, the LRi becomes 2, and:
log⁡2Opost=log⁡2Oprior+(number of new traits)
In this manner posterior confidence rachets upward as bits, because they are logarithmic, are added.
Individuation is directional. Because new traits are not accumulated around a mean, the statistical model is one-tailed. Traits count each as independent Bernoulli signals providing taxon identity. This is summarized in an odds table (Table 1), where each new trait comprises one Shannon informational bit, given an odds value and ratio, evaluated as to probability, and assigned a standard deviation value based on the odds table but not a normal distribution (thus non-standard sigmas). The bit-based probabilities map by Equation (1):
p(b)=2b2b+1(1)
where p is probability and b is bits. Simply put, in Bayes formula, posterior odds = prior odds × likelihood ratio, or with informational bits and sequential Bayes, log2(posterior odds) = log2(prior odds) + any number of log2(likelihood ratio).
For sigma values (Table 1), z scores are z=Φ-1(p) where ϕ is cumulative density function (CDF), and odds are 2b:1. The sigma values, e.g. 4.33 at 20 bits, match the inverse CDF curve exactly.
Table 1. Odds, probabilities and standard deviation (sigma) values computed for one trait change per informational bit on speciation.

Bits

Odds value

Odds ratio

Probability

Information-theoretic sigma (z, 1-tailed)

Canonical sigma (1-tailed), approximate

1

2

2 : 1

0.6667

0.43

2

4

4 : 1

0.8000

0.84

3

8

8 : 1

0.8889

1.23

4

16

16 : 1

0.9412

1.57

5

32

32 : 1

0.9697

1.85

6

64

64 : 1

0.9846

2.17

reaches 2

7

128

128 : 1

0.9923

2.43

8

256

256 : 1

0.9961

2.67

9

512

512 : 1

0.99805

2.88

10

1024

1024 : 1

0.99902

3.09

reaches 3

11

2048

2048 : 1

0.99951

3.27

12

4096

4096 : 1

0.99976

3.44

13

8192

8192 : 1

0.99988

3.57

14

16384

16384 : 1

0.99994

3.70

15

32768

32768 : 1

0.9999695

3.82

reaches 4

16

65536

65536 : 1

0.9999848

3.93

17

131072

131072 : 1

0.9999924

4.04

18

262144

262144 : 1

0.9999962

4.14

19

524288

524288 : 1

0.9999981

4.24

20

1048576

1048576 : 1

0.9999990

4.33

21

2097152

2097152 : 1

0.9999995

4.42

22

4194304

4194304 : 1

0.99999976

4.51

reaches 5

23

8388608

8388608 : 1

0.99999988

4.59

24

16777216

16777216 : 1

0.99999994

4.67

25

33554432

33554432 : 1

0.99999997

4.75

26

67108864

67108864 : 1

0.999999985

4.82

27

134217728

134217728 : 1

0.9999999926

4.89

28

268435456

268435456 : 1

0.9999999963

4.96

29

536870912

536870912 : 1

0.9999999981

5.03

30

1073741824

1073741824 : 1

0.9999999991

5.10

The odds table (Table 1) is important for sequential Bayesian computation because bits are logarithmic and can be added. Assigning each trait change in a species one informational bit allows all bits, if based on independent and random generation, to add to a large value of probabilistic support for a speciation event, or an origination of a whole genus, or a full lineage. A sigma value tells you how far you are out into the tail end of the bell-shaped curve, in the present case, a 1-tailed curve. The information-theoretic sigma value used here is based on informational bits and is not standard but is accurate and vital to understanding the degree of support. Table 1 shows how standard and bit-based sigma values compare. The reason the Table extends to 30 bits is because caulograms of lineages may include very long series of speciation events, which sum to strong mutual support.
The canonical form of standard deviation for one-tailed thresholds is defined on the normal distribution, not information. In standard normal theory, support-valued sigma is defined via Table 2. Twenty-two bits on a Gaussian curve would reach the five-sigma criterion of atomic scientists, while as an information-theoretic confidence measure derived from individual bits, 29 bits would match this stringent test simply because the curves are different. A series of eight ancestors in a line would match this as sequential Bayes, while a branching lineage including 8 species would also match this simply adding branch bits.
The sigma values say how extreme an observation is, how unlikely it is under a null model, the strength of evidence against randomness, and they serve for comparison purposes.
Table 2. Sigma values based on normal distribution and z-scores, not bits.

Canonical Standard deviation (σ)

Probability

1σ

0.8413

2σ

0.97725

3σ

0.99865

4σ

0.999968

5σ

0.999999713

The high support values attained in structural monophyly studies by adding bits from series of speciation events are largely valid but must be qualified both positively and negatively. In studied lineages, the moss family Streptotrichaceae averages 4.15 traits per speciation event, just above 1.57 σ one-tailed, while tribe Pleuroweisieae averages 3.7 traits per speciation event, just under 1.57 σ one-tailed.
The higher number of bits necessary to reach various sigma levels for taxonomic information is because the normal distribution shrinks super-exponentially:
-p(z)∼e-z2/2
while the information content bit-based mapping shrinks hyperbolically, which decays more slowly:
1-p(b)=12b+1
Individuation is here considered enhanced by additional information or bits. Negative bits such as in a trait reversal will reduce statistical support. Although a single speciation event many not have a strong rejection of uncertainty as measured by sigma values based on bits, speciation does not happen in isolation. A genus as a minimally monophyletic group (MMG) from actual study (p. 21) has initially four immediate descendant species (not more than four in studied groups). Each species has about four new traits, independent and randomly generated. The bits, being logarithmic, add to 16 bits. From Table 1, the chance of a misidentification is 65536:1, with probability of 0. 9999848 that or 3.93σ. In evolutionary study, this is powerful evidence of the individuality of the genus and implies major resistance to environmental friction, lending resilience over time for the genus and by extension redundancy for the lineage of many genera.
Each trait functions as an independent Bernoulli trial that distinguishes the taxon. For one species, four independent traits give a misidentification rate of (1−p) ≈ 0.0227, thus:
p1-p≈0.97770.0223≈43.8
This means that identification of one species of 4 newly fixed traits, interpreted as evolutionary survival or sustainability, is correct about 42 times out of 43. A genus of four descendant species each with four independent traits would be correctly identified about 1.7 million times for each misidentification, reflecting the level of correct selective application in evolutionary adaptation.
In actual data, the genus as a MMG is initially of about five species, one ancestor and four immediate descendants, and is monothetic, all species united by sharing the original new traits of the ancestor. These new traits are redundant, and do not contribute to individuation of the genus but form a stabilizing bucket. In the context of many genera on an evolutionary tree, however, the ca. four-bit isomorphisms that the genus’ ancestor has contributes to the individuation of the lineage. Genera initially have one ancestral species and four immediate descendant species, occasionally with descendants of descendants. These are gradually reduced in number through extinction over geologic time scales.
Characters are usually of two alternative states or traits, although some characters have three or more states or are continuous. Because all differentiable traits are generated sequentially, they are independent and thus addable. The ancestral species are almost always within about four traits difference, and the lineage is thus statistically locked.
3.2. Kullback-Leibler Divergence
This exercise establishes an information-theoretic foundation for evaluating differences between species using informational bits. Kullback-Leibler divergence (KL), also known as relative entropy, is an information-theoretic measure of distinguishing two probability distributions . In the taxonomic context, it quantifies how many extra bits are needed to encode one taxon using the trait distribution of another. Formally, given two distributions, X and Y over traits i:
DKL(X∥Y)=∑ixilog⁡2xiyi(2)
where xi = probability of trait i in taxon X, and yi = probability of trait i in taxon Y. The ∥ symbol simply means “comparing.” DKL(X∥Y) measures how well Y can explain X (but not vice-versa).
The KL divergence is the number of extra bits required to encode samples from X using a code optimized for Y. So if DKL = 0, then X and Y are identical; if DKL ≫ 0, X and Y are quite different. Thus, a large KL divergence means a strong taxonomic separation implying lower entropy, greater stability and better chance of correct identification or individuation.
Using log-odds with:
b=log⁡2p1-p
and multiple traits, the KL divergence sums the contributions:
DKL=∑ixilog⁡2xiyi
which gives the total information distance between the two taxa across all relevant (new) traits.
Here, trait probabilities are taken as equal. If the frequencies of traits were given, the calculations also apply, but for structural monophyly using morphological traits, these traits are either present or not by definition of the taxon.
Each trait has the probability of 1/2, assuming two-state characters. If a trait differs between X and Y taxa, then we assign one bit per differing trait following Equation 1. So if the trait is the same, the contribution = 0, if different then the contribution = 1 bit. Clearly, The KL divergence = the number of differing traits. This is a mathematically correct generalization of the individuation model in the present paper. Species with 4 unique traits differ by 4 bits, genera of 4 immediate descendant species, which have a total of 16 unique traits, differ by 16 bits, and the bit count probability equivalence is given in Table 1.
3.3. Individuation as Entropy
Biological lineages resist entropy by accumulating information-bearing signals (traits) that reduce uncertainty about the species’ identity. Order is enhanced resulting in a statistically stable identity. Assigning 1 informational bit to one new trait upon speciation quantifies how much uncertainty is reduced. A new trait is bit-positive if it is not a reversal, bit-negative if it is a reversal, but reversals in new traits are very rare. Individuation is an entropy gradient.
The entropy of a binary system is given in Equation (3):
H=-∑pilog⁡2pi(3)
Individuating bits reduce the entropy of taxon identification:
Hafter=Hbefore-b
where the number of new independent traits is b.
Hreduced=4 bits
The genus-level individuation is initially (before extinction processes) ca. 16 traits:
Hreduced=16 bits
This corresponds to nearly 4 sigma (Table 1), a high standard deviation for support in any biological context.
The structures generated by evolution are not random, they store directional information and establish the repeatable distinction of taxa. Individuation is an entropy gradient that resists environmental perturbation by writing information into morphology. Individuation via increasing numbers of differentiating traits is a process imposing thermodynamic structure on biological diversity. Species become local entropy minima and genera are deep entropy wells of low entropy.
An entropy well is a basin of identity and stability sufficiently information-rich that it cannot be erased by environmental noise. Traits accumulate as entropy decreases, and each new trait reduces entropy by 1 bit, that is, ΔH=-1 bit. (This is as opposed to an entropy sink, which absorbs and destroys information, and dissipates structure and identity, e.g. a clade, conceptually) Entropy-well stability may last millions of years. Deep entropy wells resist hybridization, random mutation, convergent crowding, and environmental consolidations. Genera persist longer in morphological coherence because their entropy wells are deeper than those of species. Formally, an entropy well is a basin in evolution-state space in which the information content I of a lineage exceeds the local entropy H of its surrounding neighborhood such that:
I=∑i=1nbi  and Hlocal<I,
where each bi is an independent trait of 1 bit of information and is summed. Thus, an entropy well is identified by I>Hlocal.
A genus-level entropy well exists when:
I≫Hlocal 
and a lineage is in a stable entropy well when:
pcorrect≈2I2I+1
That is, when the probability is so close to 1 that it cannot be lost through noise of stochastic events. For example, a species with 4 new traits = 4 bits, has odds of 42:1, and has a relatively shallow well, while genera with 16 bits and odds of 65,536:1 provide deep wells.
3.4. Error Correction and Avoidance
The monothetic, four-bit isomorphism of MMGs—where each immediate descendant species shares the mostly four new traits of the shared ancestral species—behaves as a macroevolutionary error-correction and avoidance system. Although it is not like genetic recombination or recessive buffering, it is functionally analogous, operating at the rank of genus and higher. It stabilizes identity, preserves information and inhibits drift and genetic dilution. The shared ancestral traits provide the bucket of isomorphisms, such that the core isomorphism is redundantly transmitted, and new traits of descendant species are added without overwriting the core. As a system, the MMG is robust to noise like mutation, environmental blending and convergence. Genera (MMGs) are stable over millions of years as information-preserving systems.
Error correction theory requires four features, redundancy (multiple encoding), independent signals (through adaptive speciation), hierarchical encoding (traits in ancestral, descendant and sub-descendant layers), and noise resistance (traits shared across multiple species are difficult to erase). Error avoidance can be measured in a fashion similar to that of error correction. At the macroevolutionary level, this is much like that of recombination and recessive genes, but with analogous functions at different scales.
A mathematical description of this quasi-error correction phenomenon, which may be universal to taxa, follows.
3.4.1. The Genus is Treated as an Error-Correcting Code
a) Ancestral block A is shared across all species in the genus.
b) Species-specific blocks of traits Sl are unique to each species j.
Let:
A=(a1,a2,…,am) with m≈4 ancestral traits
Sj=(sj1,sj2,…,sjn) with n≈4 traits per species
The number of descendant species in the genus is k ≈ 4.
Then:
Total trait set for the genus is given in Equation (4):
TG=A ∪ ⋃j=1ksj(4)
The ∪ is a union operator in set theory such that all elements in the set are combined, without duplication, here meaning the union of all descendant trait sets 1 through species k. The whole formula means the total trait set of the genus is the union of the ancestral trait set and all descendant trait sets. Other symbols are A is ancestral traits, Sj is descendant traits, and k is number of immediate descendant species.
Total independent traits is:
NG≈m+kn≈ 4+4 +4 =20
In this formula, NG is m + n or total trait pool size, m is the number of ancestral traits, n is the number of traits per descendant species, and k if the number of descendant species. The 4 ancestral traits do not contribute to individuation alone of the genus because they are redundant, so bit count is kn = 4 × 4 = 16, and because the ancestral traits are redundant across the genus, NG is kept general.
3.4.2. Error Model at the Macroevolutionary Level
Every trait observation can be misread, lost, convergent or otherwise corrupted at probability ϵ, independently, and for a single trait:
P(error)=ϵ,P(correct)=1-ϵ
And for NG independent traits:
P(all correct)=(1-ϵ)NG
The core redundancy is the ancestral block A.
3.4.3. Redundancy of Ancestral Traits Across the Species of MMG
Each ancestral trait ai is present in all four immediate descendant species.
Thus, for trait ai, ai is encoded k times (that is, once per species), and it is recovered by majority vote across species.
Let each instance of ai be independently corrupted with probability ϵ.
The probability that the majority of the k copies is wrong is:
Pmaj_error(ai)=∑r=⌈k+12⌉kkrϵr(1-ϵ)k-r
This equation is simply a sum across the 4 descendant species using the binomial probability formula with k as total Bernoulli trials and r as number of successes achieved.
For k = 4:
Pmaj_error(ai)=43ϵ3(1-ϵ)1+44ϵ4=4ϵ3(1-ϵ)+ϵ4
This is the probability that the majority of the 4 redundant copies of an ancestral trait are wrong, being the majority-error probability. This probability is much smaller than the chance that one trait observation is corrupted, that is if ϵ were in the range 0.01 to 0.10, a biologically realistic regime for such corruptions. This is because the majority-error term includes ϵ3 and ϵ4 not ϵ. That is, if ϵ of a single copy error were 0.1, then the majority-error with 4 redundant copies would be:
4(0.13(0.9) + (0.1)4= 0.0037
When the probability of error ϵ is small, the majority-error probability is orders of magnitude smaller than ϵ alone. In this manner, the isomorphic ancestral traits behave like macro-error-correcting bits and ancestral traits are error-corrected by redundancy across descendant species in a MMG, a microgenus.
3.4.4. Effective Error Rate for the Ancestral Block
The effective error rate of an ancestral trait of ancestral block A after redundancy across k descendant species is given in Equation (5):
ϵeffA=Pmaj_error(ai)(5)
For small ϵ and k = 4:
ϵeffA≈4ϵ3
Thus, if ϵ were small, such as 0.1:
ϵeffA≈4⋅0.001=0.004
And a 0.10 raw error becomes 0.004 effective error.
Here each descendant species has the same ancestral trait ai. There are k copies of this same trait. Given independent error probability ϵ, the probability of the majority of copies are wrong is Equation 4, being the probability after redundancy, not raw error ϵ. Macroevolution level error correction by redundancy in descendant species suppresses ancestor trait error by orders of magnitude.
Errors accumulate linearly but individuating bits accumulate multiplicatively through sequential Bayesian analysis. Thus, errors are suppressed by individuating bits.
3.4.5. Sphere Packing in Hamming Space
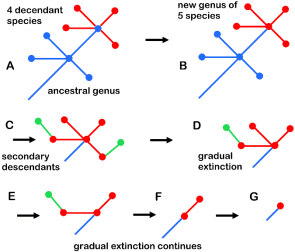
Relationships between ancestor and descendant are rather ordered in minimally monophyletic groups (Figure 1). Taxonomic identification of an ancestral species is by two distinguishing criteria, making a second-order Markov chain: The ancestor is generalist to the more specialized ingroup species and also most similar to an outgroup, preferably its own ancestor. In addition, the ancestor and its immediate descendants, usually 4, all share the most recently fixed new traits of the ancestor. Generation of descendant species is abrupt and extinction is gradual. The oldest progenitor is commonly the last to disappear, perhaps because least modified by evanescent environmental changes. The oldest progenitor is judged as such because most extant species of a lineage, including ancestral species, are within a distance of about four traits. About half of all species are ancestral to one or more other species.
Figure 1. General model of evolution of a minimally monophyletic group. A. One descendant of ancestral genus (blue) generates four descendant species (red). B. Ancestral species and descendant species (red) all share ancestral species newest traits. C. Descendants may have secondary descendants (green). D. Extinction begins. E-G. Extinction gradually erodes the species.
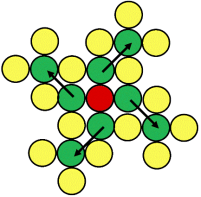
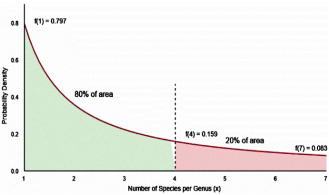
A previous paper modeled evolution of minimally monophyletic groups in 2-dimensional space as sets of five circles in a cruciform pattern, one central ancestor and four equally spaced surrounding descendants (Figure 2). The five all shared an isomorphy of about four traits of the ancestral species (circle). New genera were modeled as sets of identical five circles closely attached in a square pattern around the original circle, with the central circle representing a descendant-turned-ancestor of the first set of five. The empty space of many sets of five circles crowded together represented the environment and had a ratio of 21.5% void to the 78.5% area of the circles, about the Pareto ratio of 20:80 (Figure 3).
Figure 2. Model of a minimally monophyletic group (the central five circles with red for ancestor and green for descendants) generating four descendant genera (green for ancestors, yellow for descendants). Each set of five is monothetic with ancestral isomorphism, each arrow indicates taxonomic identity of ancestor and descendant.
The size of the multiple sets of five circles (species) was limited by the restriction of four immediate descendants to the first two evolutionary originations of genera; thereafter, crowding limited new genera to only two. Evolution through time was modeled by oscillation with the central, older area of the set going extinct and the empty area filled by new species and genera from species in the periphery.
Figure 3. Graph of hallow curve of 1/x1.162 of species per genus in previously reported plant data against probability density. Area of 1-4 represents immediate descendant species number and 4-7 is one ancestral species and about 2 secondary descendant species. This models inferred expression of a minimally monophyletic genus when initially originated, i.e. before extinction proceeds.

This model can be further visualized as an endless belt, like tractor or tank treads. The descendant taxa originate through natural selection where the treads on the belt meet the ground (environmental resistance). The exposed area of the endless belt represents the preservation of older traits now unused but available for character state change as the vehicle (the lineage) passes over new ground. The endless belt is the total character set of the lineage, which both provides opportunity for sustainability and for resilience but limits the lineage to a particular evolutionary trajectory not inimical to mutualism of other lineages in the ecosphere. Furthering the model, fossil and relict taxa form the tracks in the ground after the tractor or tank has passed and provide data for analysis.
A formal explication of this model may be had with Hamming error correction, in this case clearly error avoidance, with sphere packing in trait space. Standard error analysis would involve modeling a species as a sphere in trait space, then checking for overlap in binary trait space, assuming binary characters (each character has two alternative traits or states). The Hamming distance between species is the number of traits that differ. Each species is a binary vector of length N, where each informational bit is a trait space. The number of traits different between species is about four, an average taken from empiric studies. In the bryophyte lineages Streptotrichaceae and Pleuroweisieae the average trait difference between ancestral species and an immediate descendant are 4.15 and 3.7 new traits per speciation event, respectively, but may rarely be as low as 2 or as high as 7.
All possible species are represented by an N-dimensional hypercube with 2N points. The distance between species is then the Hamming distance or number of traits that differ. The Hamming space is then [0, 1]N.
We suppose a minimum distance of 4 will ensure non-overlapping spheres of radius 1 as any two species must differ by at least 4 traits. In coding theory and sphere packing, we draw around each species (codeword) a Hamming Ball of radius:
t=d-12=1
In this formula, radius 1 refers to all points that differ by at most 1 trait (0 or 1 bit flips), and, because the minimum distance between species is 4, then no radius 1 balls overlap.
For binary strings of length N, the number of points inside Hamming distance of ≤ 1 is:
V(N,1)=N0+N1=1+N
Where the volume V equals combinatorial calculations of N chose 0 plus N chose1, or nCk, which equals simply 1 + N. This represents all organisms that differ from the species by less than or equal to one trait. We have then 1 point at distance 0 (the species itself) and N point at distance 1 (meaning any one trait when flipped). Thus, each species occupies a ball of a size 1 + N.
There are 2N total points in trait space. We pack non-overlapping balls of size 1 + N together. The maximum number of species that will fit together is:
M⋅(1+N)≤2N
where M is the upper bound on maximum number of species that differ by ≥ 4 traits. and so:
M≤2N1+N
This is the Hamming sphere-packing bound for the minimum distance of 4.
The number of traits in use at any one time for the moss family Pottiaceae [1, p. 2] is here taken as 75, under a generalizing assumption all are binary. The number of traits (expressed at one time) in both Streptotrichaceae and Pleuroweisieae is estimated at 40. The estimated upper bounds on the numbers of species one can pack into trait space while keeping a distance of 4 or more traits between any pair is as follows for Streptotrichaceae and Pleuroweisieae:
For N = 40 M≤24041≈2.68×10¹⁰
and Pottiaceae:
For N = 75 M≤27576≈4.96×10²⁰
This is a modeling of error avoidance. The geometric model of Zander of 5 circles in cruciform arrangement is a realization of Hamming space. It models binary trait vectors, Hamming distance leaps of ca. 4 traits, the sphere-packing constraints above, and fractal self-similarity across ranks. The geometric clusters move through trait space in discrete jumps, a step size being a translation by a vector of weight 4.
In sum, species with four traits and genera with four immediate descendant species are strongly affected by the error correction of Hamming distance, but species and genera with only 2 traits or immediate descendants are not well protected (by error correction or avoidance). On the other hand, such taxa are not common and for the most part are closely bookended by well-defined taxa that contribute stability and coherence to their individuation. The moss genus Weisssia and its related genera is an example of a small but widespread group with few (often only 2-3) distinguishing traits per species (p. 20).
Entropy wells and error correction through redundancy or avoidance are related evolutionary operators producing entropy wells with one focusing on energy and the other on information. Redundancy as Shannon entropy has been dealt with in a general manner at the lineage level (p. 30). Differences in entropy well depths explains why genera persist longer than species, why lineages maintain coherence over geological time spans, why individuation is a directional rachet, and why summing traits as bits models evolutionary inertia.
3.4.6. Endless Belt Model Calculations
This leads to an endless belt theory. The number of adaptive traits available to a taxon or lineage is restricted by its physiological limitations, essentially a function of its identity. New traits are modifications of old traits as a change of character state. As a taxon transitions into a new, somewhat different environmental niche, there is a turnover of the old traits, that is, changes in characters from one state to another more selectively effective state, i.e. selection as speciation.
This is modeled by the treads of a tractor or tank preserving old traits against future needs as the tread emerges from contact with the environment while the lineage moves through periodic cycles at geological time intervals. As features on an endless belt, the change or occasional repurpose of character traits to match environmental change is limited to a characteristically bounded set. This is in fact the taxonomic description of a taxon detailing its characters and the states possible.
Formally, each species is a belt tread. A radius-1 ball stands for all belts that differ by at most 1 tread. With a minimum distance of 4, all belts are spaced such that no treads touch. Sphere packing tells one how many belts are in the full space of possible belts without overlapping. No two radius-1 species can overlap given the numbers of traits possible.
In the bryophyte lineages Streptotrichaceae and Pleuroweisieae the average trait difference between ancestral species and an immediate descendant are 4.15 and 3.7 new traits per speciation event, and there are 40 speciation events (binary events). Given variable K is 4.15 and 3.7, treated as fixed, and N =40 binary events, the expected recycling fraction per speciation event is:
EKN=E[K]N
So, for Streptotrichaceae:
4.1540≈0.104 (10.4%)
and for Pleuroweisieae:
3.740≈0.0925 (9.25%)
The turnover time with a fixed K is simply N/k. Thus, for Streptotrichaceae, expected event to full turnover are:
404.15≈9.64(10 speciation events)
and for Pleuroweisieae:
403.7≈10.81(11 speciation events)
For the endless belt model of recycling in Streptotrichaceae (STR) and Pleuroweisieae (PLE), each of about 25 species, 9.25 to 10.4 percent of traits are recycled per speciation event, and 10 to 11 speciation events fully recycle the trait set once. For Pottiaceae, of about 70 species, with 75 traits, and if we assume ca. 4 traits per speciation event (not yet estimated), then the full, larger set is entirely recycled at 75/4.00 = about 19 speciation events.
Lineages STR and PLE have been estimated to have lasted 100 and 88 million years, respectively. Dividing their caulograms (stem-taxon polychotomous evolutionary trees) into sections corresponding to their serial sets of speciation events, 7 for STR and 5 for PLE, there are an average of 19.5 speciation events per time period for STR and 26.2 for PLE . This would correspond to about two turnovers in traits per serial speciation event for each lineage, with an accumulation of 14 turnovers for STR and 10 for PLE. Because the trait changes are distributed individually throughout the lineage, each trait persists as redundancy throughout the trajectory of the evolutionary tractor or tank.
The endless belt model yields connections between ancestral traits and stability, descendant traits and individuation, sequential Bayes and exponential error suppression, and parallel cycles of climate change and associated seriate genus and species origination.
4. Discussion
This paper addresses certain problems of molecular systematics by offering a robust, accurate, and statistically rigorous alternative method of macroevolutionary analysis. The salient faults of molecular systematics are: (1) the results are essentially cluster analysis on either ultrametric or phyletic trees with evolutionary processes constrained as dichotomous, (2) molecular data is obtained from only a few specimens ignoring potentially confounding variation, and ignoring apophyly-paraphyly pairs that actually do imply ancestor-descendant relationships, (3) morphology-based trees are often different from those of molecular provenance, thus cladistics is self-falsifying, particularly in that morphology is wrongly mapped to molecular patterns, and (4) an essentially nomenclatural rule, that of holophyly, requires clades to include only one name at one rank in a monophyletic clade, thus many scientifically informative genera and families have been relegated to synonymy. Of particular concern is the use of Felsenstein’s parametric bootstrap to demonstrate poor statistical support for morphological cladograms, yet that evaluation should have been done on specimens, not species descriptions. Given the poor resolution of clades and lack of species and genus definitions, cladists have even promoted the abandonment of these taxa as “notional” . There has been considerable push-back from classical taxonomists (e.g., and attempts to modify cladistic analysis to relieve it of the worst features (e.g. but to little avail.
Lineages survive by conservation of information. The new field of taxology uses physical and statistical analyses of the processes underlying biological diversity to divine the origin and maintenance of all forms of life. Given that this is the biophysics of macroevolution, the associated mathematics are complex, embodying multidisciplinary concepts. Essential for calculations is the unitization of taxonomic variables, each variable being directly involved in evolutionary processes.
Analogic equivalences that have been proven to be of value in revealing and comparing evolutionary systems are as follows: Evolutionary mass is a species. Velocity is a character state change from ancestral species to descendant species. Time is one speciation event (or genus or lineage origination event). Acceleration is simply the change in rate of numbers of character state changes per serial speciation event (or summed for evolutionary acceleration of a genus or lineage).
Individuation is an inertial force because information resists erasure. This leads to the persistence of traits across generations; they accumulate directionally and reduce entropy cumulatively and irreversibly and persist as entropy wells.
Given unitization of taxonomic variables, evolution can now be inferentially discussed in an information-theoretic context as a set of natural processes involving taxon individuation, error correction, sustainability, resilience, adaptation, and entropy. The key concept is the minimally monophyletic group or microgenus, with one ancestral species and maximally four immediate descendant species, leading to two fundamental organizing units acting in evolution, (1) the microgenus with four descendant species each of mostly four independent traits, each species of which establishes a 0.94 probability of survival certainty and the four together form a nearly four sigma conduit of certainty through time, and (2) the ancestor and all four immediate descendant species share the ca. four new traits of the ancestral species forming a monothetic set of isomorphisms that provide the redundancy for robust error correction or avoidance, depending on type of analysis. This explains how species, genera and lineages manage to survive with taxonomic descriptions intact for millions of years.
Future aspects are promising as many questions associated with analogy with classical physics arise. For instance, there is apparently a commonality of process between the fourth-power scaling of total radiation and temperature (𝐸 ∝ 𝑇4), in Stefan-Boltzmann’s Law, and the generation of 16 genera in a cascade from a single genus upon origination, each descendant species generating a new genus. For every doubling of temperature (degrees Kelvin) the radiation increases as the fourth power (24 = 16). From a doubling of genera, we get 24 genera (technically 16 genera plus five ancestors bereft of their descendants-turned-ancestors). Interestingly the constraint is limited by crowding in both. Radiation pressure is the constraint in one, reduction in available environmental space in the other. The number of extant and inferred genera in lineages constructed from minimally monophyletic groups is nearly 16, 13 for Streptotrichaceae and 11 for Pleuroweisieae . Is this a common constraint?
Some formal analyses above may seem over-determined when the results are “obvious” in hindsight. This is true, but doing the mathematics with well-defined taxonomic variables provides the context and resolution that enables the potential for well-conceived additional hypotheses and research directions. It opens inquiry into a new field of computer-augmented discovery.
If this direction of scientific analysis proves productive in terms of researcher interest and funding, then the massive collections at museums and botanical gardens will prove to be primary data sources like the stars in the sky in cosmology and collider targets in nuclear physics. This would indeed put studies of biological diversity on similar physical and mathematical foundations.
Abbreviations

KL

Kullbuck-Leibler Divergence

MMG

Minimally Monophyletic Group

PLE

Pottiaceae Tribe Pleuroweisieae

STR

Family Streptotrichaceae

Acknowledgments
The Missouri Botanical Garden is thanked for its continued support of advanced systematic study.
Author Contributions
Richard Henry Zander: Conceptualization, Writing – original draft, Writing – review & editing
Data Availability Statement
The data supporting the outcome of this research work has been reported in this manuscript.
Conflicts of Interest
The author declares no conflicts of interest.
References
[1] Zander RH. Structural monophyly abstractions-3. Res Botanica Technical Report. 2026 Jul 17: 1-32. Available from:
[2] Zander RH. Lineages of fractal genera comprise the 88-million-year steel evolutionary spine of the ecosphere. Plants. 2024; 13(11): 1559.
[3] Zander RH. Structural monophyly analysis allows estimation of self-sustainability at the supraspecific level over 88 million years in mosses. Sustainability. 2025; 17(8): 3657.
[4] Zander RH. Integrative systematics with structural monophyly and ancestral signatures, Chionoloma (Bryophyta). Academia Biology. 2024; 2.
[5] Zander RH. Minimally monophyletic genera are the cast-iron building blocks of evolution. Ukr Bot J. 2024; 81(2): 87-99.
[6] Willis JC. Age and Area. Cambridge: Cambridge University Press; 1922.
[7] Zander RH. Biodiversity stability in terms of evolutionary mass, velocity and force. Sustainability. 2025; 17(18): 8272.
[8] Zander RH. Reformulation of the foundations of taxonomy using evolutionary mechanics. Taxonomy. 2026; 6: 1-41.
[9] OpenAI. GlobalGPT. GPT-5.6: Frontier intelligence that scales with your ambition. 2026. Available from:
[10] Zander RH. Artificial intelligence as ideational engine. Res Botanica Technical Report. 2026 Aug 16. Available from:
[11] Rieseberg LH, Widmer A, Arntz MA, Burke JM. Directional selection is the primary cause of phenotypic diversification. PNAS. 2002; 99(19): 12242-12245.
[12] Kullback S, Leibler RA. On information and sufficiency. Ann Math Stat. 1951; 22(1): 79-86.
[13] Felsenstein J. Confidence limits on phylogenies: An approach using the bootstrap. Evolution. 1985; 39: 783-791.
[14] Mishler BD. What, if anything, are species? Boca Raton (FL): CRC Press; 2021.
[15] Stevens PF. The genus concept in practice: But for what practice? Kew Bull. 1985; 40: 457-465.
[16] Stevens PF. Why do we name organisms? Some reminders from the past. Taxon. 2002; 51: 11-26.
[17] Bourgoin T, Bailly N, Zaragúeta R, Vignes-Lebbe R. What is a taxon? Identity, persistence and operability in taxonomy. Diversity. 2026; 18(4): 1-24.
[18] Seberg O, Humphries CJ, Knapp S, Stevenson DW, Petersen T, Scharff N, et al. Shortcuts in systematics? A commentary on DNA-based taxonomy. Trends Ecol Evol. 2003; 18(2): 63-65.
[19] Lipscomb D, Platnick N, Wheeler Q. The intellectual content of taxonomy: A comment on DNA taxonomy. Trends Ecol Evol. 2003; 18(2): 65-66.
[20] Brummitt RK. Further dogged defense of paraphyletic taxa. Taxon. 2003; 52: 803-804.
[21] Hörandl E. Paraphyletic versus monophyletic taxa: Evolutionary versus cladistic classifications. Taxon. 2006; 55: 564-570.
[22] Hörandl E. Neglecting evolution is bad taxonomy. Taxon. 2007; 56: 1-5.
[23] Hörandl E, Stuessy TF. Paraphyletic groups are natural evolutionary units and acceptable in biological classification. Taxon. 2010; 59: 1641-1653.
[24] Aubert D. A simple parsimony-based approach to assess ancestor-descendant relationships. Ukr Bot J. 2017; 74: 103-121.
[25] Dayrat B. Ancestor-descendant relationships and the reconstruction of the tree of life. Paleobiology. 2005; 31: 347-353.
[26] Geeta R. Evolution & development. 2003; 5(6): 609-621.
[27] Ricotta C, Pavoine S. Beyond branch lengths: A fuzzy theory of evolutionary distinctiveness. Ecosphere. 2026; 17(8): e70541.
[28] Stuessy TF, Konig C. Patrocladistic classification. Taxon. 2008; 57: 594-601.
[29] Zhang AB, Muster C, Liang HB, Zhu CD, Crozier R, Wan P, et al. A fuzzy-set-theory-based approach to analyze species membership in DNA barcoding. Mol Ecol. 2012 Apr; 21(8): 1848-1863.
Cite This Article
  • APA Style

    Zander, R. H. (2026). An Information-Theoretic Evolutionary Analysis of Minimally Monophyletic Groups. European Journal of Biophysics, 14(2), 34-46. https://doi.org/10.11648/j.ejb.20261402.12

    Copy | Download

    ACS Style

    Zander, R. H. An Information-Theoretic Evolutionary Analysis of Minimally Monophyletic Groups. Eur. J. Biophys. 2026, 14(2), 34-46. doi: 10.11648/j.ejb.20261402.12

    Copy | Download

    AMA Style

    Zander RH. An Information-Theoretic Evolutionary Analysis of Minimally Monophyletic Groups. Eur J Biophys. 2026;14(2):34-46. doi: 10.11648/j.ejb.20261402.12

    Copy | Download

  • @article{10.11648/j.ejb.20261402.12,
      author = {Richard Henry Zander},
      title = {An Information-Theoretic Evolutionary Analysis of Minimally Monophyletic Groups},
      journal = {European Journal of Biophysics},
      volume = {14},
      number = {2},
      pages = {34-46},
      doi = {10.11648/j.ejb.20261402.12},
      url = {https://doi.org/10.11648/j.ejb.20261402.12},
      eprint = {https://article.sciencepublishinggroup.com/pdf/10.11648.j.ejb.20261402.12},
      abstract = {Structural monophyly is a method of modeling macroevolution in terms of minimally monophyletic groups. It renders taxonomy amenable to the mathematical modeling of biophysics by standardizing the genus as one ancestral species and about four immediate descendant species, each genus monothetic in sharing the isomorphy of the ancestral species newest traits, and by unitizing taxonomic variables an analogue of mass, velocity and time. The biophysics of macroevolution is presented as a new field. In the present paper, taxonomy is demonstrated as foundational in providing organized data for analysis of the processes underlying the origin, persistence and resilience of lineages of living organisms. The processes governed and operating in minimally monophyletic groups are summarized and evaluated mathematically at the taxon level, involving features such as the Pareto ratio and a fractal dimension of 1.161. Individuation is equated with both taxonomic identification and evolutionary survival against environmental resistance. As powering a statistically well supported path through geologic time and environmental space, individuation is found to be directional. As embodied in taxa, using one informational bit per newly fixed trait, it can be analyzed with Shannon-Turing sequential Bayes using odds tables and standard deviations on 1-tailed distributions. One species with 4 new traits is correctly identifiable 42 times out of 43, which may be extended to species survival on environmental testing. That a genus is correctly identifiable about 1.7 million times for each failure implies a functional reason for lineage survival for 100 million years. Origination and extinction are modeled for a minimally monophyletic group with initial burst of speciation and gradual extinction based on observed taxonomic analyses. Kullbuck-Leibler divergence analysis generalizes the individuation analysis. Species are shallow entropy wells while genera are deep ones. Hamming sphere-packing showed that error correction and avoidance are robust in the studied groups of bryophytes through ancestral trait redundancy. An endless belt model allows older characters to change state upon exposure to environmental changes, preserving the old state as survival potential within the genetic constraints of a taxonomic description. This study suggests that there are shared, perhaps universal, complex and potentially mathematically modeled processes underlying biological diversity at the supraspecific level as lineages change through time. If universal, then ecosystems are complexly mutualistic in survival.},
     year = {2026}
    }
    

    Copy | Download

  • TY  - JOUR
    T1  - An Information-Theoretic Evolutionary Analysis of Minimally Monophyletic Groups
    AU  - Richard Henry Zander
    Y1  - 2026/10/26
    PY  - 2026
    N1  - https://doi.org/10.11648/j.ejb.20261402.12
    DO  - 10.11648/j.ejb.20261402.12
    T2  - European Journal of Biophysics
    JF  - European Journal of Biophysics
    JO  - European Journal of Biophysics
    SP  - 34
    EP  - 46
    PB  - Science Publishing Group
    SN  - 2329-1737
    UR  - https://doi.org/10.11648/j.ejb.20261402.12
    AB  - Structural monophyly is a method of modeling macroevolution in terms of minimally monophyletic groups. It renders taxonomy amenable to the mathematical modeling of biophysics by standardizing the genus as one ancestral species and about four immediate descendant species, each genus monothetic in sharing the isomorphy of the ancestral species newest traits, and by unitizing taxonomic variables an analogue of mass, velocity and time. The biophysics of macroevolution is presented as a new field. In the present paper, taxonomy is demonstrated as foundational in providing organized data for analysis of the processes underlying the origin, persistence and resilience of lineages of living organisms. The processes governed and operating in minimally monophyletic groups are summarized and evaluated mathematically at the taxon level, involving features such as the Pareto ratio and a fractal dimension of 1.161. Individuation is equated with both taxonomic identification and evolutionary survival against environmental resistance. As powering a statistically well supported path through geologic time and environmental space, individuation is found to be directional. As embodied in taxa, using one informational bit per newly fixed trait, it can be analyzed with Shannon-Turing sequential Bayes using odds tables and standard deviations on 1-tailed distributions. One species with 4 new traits is correctly identifiable 42 times out of 43, which may be extended to species survival on environmental testing. That a genus is correctly identifiable about 1.7 million times for each failure implies a functional reason for lineage survival for 100 million years. Origination and extinction are modeled for a minimally monophyletic group with initial burst of speciation and gradual extinction based on observed taxonomic analyses. Kullbuck-Leibler divergence analysis generalizes the individuation analysis. Species are shallow entropy wells while genera are deep ones. Hamming sphere-packing showed that error correction and avoidance are robust in the studied groups of bryophytes through ancestral trait redundancy. An endless belt model allows older characters to change state upon exposure to environmental changes, preserving the old state as survival potential within the genetic constraints of a taxonomic description. This study suggests that there are shared, perhaps universal, complex and potentially mathematically modeled processes underlying biological diversity at the supraspecific level as lineages change through time. If universal, then ecosystems are complexly mutualistic in survival.
    VL  - 14
    IS  - 2
    ER  - 

    Copy | Download

Author Information