Research Article | | Peer-Reviewed

Experimental Study of Physical Properties of River Sand on the Mechanical Properties of Sand/Plastic Composites for Roofing

Received: 15 October 2024     Accepted: 5 November 2024     Published: 28 November 2024
Views:       Downloads:
Abstract

The non-biodegradability of plastics released into the environment makes the soils infertile, impedes the drainage of waste water and rain water in existing gutters and the spread of waterborne diseases which are traits to human life. This study aimed at producing roofing sheet from waste polyethylene terephthalate (PET) and river sand. Sand was collected from the river while plastic bottles were collected from the environment. The physical properties of the sand such as natural water content, specific gravity, apparent density, grain size analysis, Sand equivalent test and Organic matter content were determined. Nine different sample formulation of ten each were moulded with sand/PET content of 90/10, 80/20, 70/30, 60/40, 50/50, 40/60, 30/70, 20/80, 10/90 (A to I). Water absorption rate, flexural strength, impact test and drilling test were determined. It was observed that the averages of natural water content, specific gravity and apparent density were 0.871%, 2.66 and 1.654g/cm3 respectively. The coefficients of uniformity, coefficient of curvature and fineness modulus of sand from grain size analysis were 3.17, 0.79 and 2.97 respectively. The averages of visual and piston sand equivalent and organic matter content were 94.89%, 89.82% and 2.42% respectively. The rates of water absorption of composites were 3.62% to 0.11% at saturation. Flexural strength and impact were 200.5daN/cm2 and 123J/mm2 respectively while the drilling time was maximum at 80% sand. These results obtained reveal that plastic/sand composite can be used as a roofing material.

Published in Composite Materials (Volume 8, Issue 2)
DOI 10.11648/j.cm.20240802.13
Page(s) 44-56
Creative Commons

This is an Open Access article, distributed under the terms of the Creative Commons Attribution 4.0 International License (http://creativecommons.org/licenses/by/4.0/), which permits unrestricted use, distribution and reproduction in any medium or format, provided the original work is properly cited.

Copyright

Copyright © The Author(s), 2024. Published by Science Publishing Group

Keywords

Physical Properties, Mechanical Properties, Plastic Waste, Sand/Plastic Composite, River Sand, Roofing Sheet

1. Introduction
Population urbanization increase and industrial growth has made worldwide waste management a challenge. The conventional methods of disposing of solid wastes are landfill, incineration and recycling. However, landfill spaces are reducing, incineration process emits dangerous or hazardous gases, and waste recycling seem to be expensive and laborious. The highest form of this waste is plastic which is rising geometrically every day and the form of plastic waste found in the waste stream include; Polyethylene Terephthalate, High-Density Polyethylene (HDPE), Polyvinyl Chloride (PVC), Low-Density Polyethylene (LDPE), Polypropylene (PP), Polystyrene (PS), and Others (like polyester, polyamides, and polycarbonate). Sectors that use plastic are packaging, automotive, agriculture, furniture, sport, electrical and electronics, health and safety, building and construction, and consumer and household appliances . Increase in plastic products has resulted in an increase in plastic waste, which is a challenge to waste management authorities. PET can be used in automobile tyre yarns, conveyor belts and drive belts, reinforcement for fire and garden hoses, seat belts . Also PET can be used in the manufacture of geotextiles for stabilising drainage ditches, culverts, and railroad beds. Also diaper top sheets and disposable medical garments, magnetic recording tapes and photographic films, liquid and gas containers, water and beverage bottles resulting to 8.3 billion tons of plastic produced globally per year . The same study reported that as of 2015, approximately 6.3 billion tons of plastic waste had been generated. Out of which, only nine per cent of the plastic has been recycled and 12 per cent incinerated, and a monumental 79% have ended up in landfills. They also saw that around 4.9 billion tons of plastics amounting to 60% of all plastics ever produced—were discarded and are now accumulating in landfills or in the natural environment. In European countries 39.7% of plastics are used in the sector of packaging . But, in terms of size, the construction industry (19.8%), the automotive industry (10.1%), the electrical and electronic industry (6.2%), the household appliances sector (4.1%), the agricultural sector (3.4%), and for example: household appliances and products, furniture, medical devices (21.7%). In recent years, the amount of plastic waste recycled has increased, with simultaneous decrease in the amount of waste going to landfills and the maintaining the level of waste destined for energy recovery. In 2020, nearly 10.2 million tons of waste of plastic was recycled and stored. Since 2018 the European Union has intensified the fight against plastic. In a study titled Plastic Pollution in Africa: Identifying policy gaps and opportunities reported that, the per capita plastic consumption in Africa in 2015 was 16 kg per person, compared to the global average of 45 kg per person . Plastic waste generation in Sub-Saharan Africa is dependent on many factors such as urbanization, economic development etc. with a population of around 1 billion as of the year 2019, the quantity of total waste generated in Sub-Saharan Africa is 180 million tons, out of which 17 million tons of plastic waste is generated annually.
In Cameroon waste management legislation has evolved with time especially within the past 10 years. However much of this municipal solid waste management (MSWM) practiced in Cameroon has not been affected. Waste management is still seen as an activity based upon the collection and dumping somewhere else; which is the traditional approach to waste management developing economic where cheap solutions are the principal driver . In their study on waste management policy in Cameroon with reference to Limbe municipal council, echoed that there is a radical overhaul of the current policy and regulatory systems. More so the delivering sustainable waste management through consensus building, consultation, encouragement and openness must be developed prior to maximizing the potential available for waste reuse, recovery and recycling in Cameroon. It is equally visible that the main problems facing waste management in Cameroon is that most industries have a poor waste management standard .
Recycling is the process of converting waste materials into reusable products, and it is important to say that plastic recycling is in its infancy stage. Recycling PET and HDPE plastic waste is an example of homogenous resin, which yields to products similar in quality to those of virgin resins. PET plastic waste can be recycled over and over again, hence reducing the need for PET disposal . These plastic wastes makes only 5% of the post-consumer plastic waste stream and the rest is either incinerated or put in landfill or abandoned in open space . Composite materials that contain sand are flexible matrix produced by PET waste may have important mechanical properties with reasonable price consideration for new and environmental friendly construction material. Most studies have been able to demonstrate that plastic waste can be used as a supplement to aggregates. In any case, the results show that the inclusion of plastic waste eliminates the shrinkage cracking of concrete and reduces the drying shrinkage to some extent . Plastic waste has been used as aggregate and has been seen that the flow ability and the thermal conductivity of mortar is improved and also the compressive and the flexural strength is not affected even if the present of plastic waste in concrete is up to 50% by weight . A side from that the use of plastic waste as a binder obtained from a chemical reaction to produce polymer concrete gave a material with better compressive and flexural strength than cement Portland concrete . The use of plastic waste in the manufacture of bricks show that the compressive strength is higher when compared with the conventional clay bricks . The use of plastic waste (PET) up to 50% by weight in the manufacture of sand/PET composite material gives material a lower density with sand grain size being an important factor in density reduction . The porosity of sand/PET composite is lower than 5% and ranging between 0.05% to 3.8% compared to the cement materials which have porosity higher than 10%. Moreover, it arises that low sand grain size tend to reduce the proportion of air voids to water. This proportion of air voids depends not only on the grain size of sand but is also a function of the content of plastic present in the composite. The water absorption of these bricks from sand/PET are very less 0.9 % to 4.5% than in normal clay bricks which is around 15% to 20% of the weight of bricks . They stated that the reason for the decrease in the maximum dry density in sand/PET composite is due to the fact that sand particles are denser than PET plastic waste. As more PET plastic waste is added in the sand-PET plastic composite, the composite becomes lighter and such composite can be used in projects that require lower maximum dry density. The experimental study on sand properties and plastic/sand composites for roofing is important to add value on waste plastic.
2. Materials and Method
2.1. Sand
Sand was collected from a river in the North West region of Cameroon. The sand obtained was washed and sun dried for two sunny days of six hours each as presented in figure 1. The sand properties were carried out at Geostruct laboratory in Menteh Nkwen Bamenda 3 sub division North West region of Cameroon.
2.1.1. Natural Water Content
This was done in accordance with NF P 94-050 standard . The natural moisture content, also known as natural water content is the ratio of water weight to the weight of solids in a specific quantity of sand, expressed as a percentage. To determine this, three cans labeled R', D', and P' were initially dried and weighed (W1). Subsequently, sand samples were placed into these containers and reweighed (W2). The containers with the sand samples were then heated in an oven set at a constant temperature of 105oC for 24 hours. After this period, the pans were weighed again to establish the final constant weight (W3) of the dried sand samples. This method involves oven-drying the sand sample until its weight stabilizes, effectively removing all moisture. The percentage of moisture content was calculated as presented in table 1.
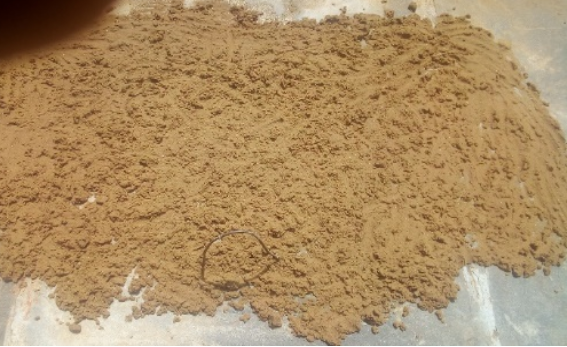
Figure 1. Drying of sand.
Table 1. Natural water content of sand.

S/N

Description

Formular

Units

Number of Cans

R’

D’

P’

1

Total mass of wet sample

g

353.7

382.5

363

2

Total mass of oven dry sample

g

351.2

378.9

360.3

3

Mass of can

g

27.0

28.6

28.0

4

Mass of water

(1) – (2)

g

2.5

3.6

2.7

5

Mass of oven dry material

(2) – (3)

g

324.2

350.3

332.3

6

Water content

(4)*100/(5)

%

0.771

1.028

0.813

7

Average

Sum (6)/3

%

0.871

2.1.2. Specific Gravity
This was carried out using NFP 94-050 standard . The specific gravity test of sand is used to determine applications such as super pave mix design, deleterious particle identification and separation, and material property change identification. Specific gravity refers to the ratio of the mass of a unit volume of sand at a specified temperature to the mass of the same volume of gas-free water at the same temperature. Knowledge of specific gravity is essential for calculating soil properties such as void ratio and degree of saturation. Two pycnometers, P1 and P2, were dried and weighed; their weights were recorded as W1 and W2, respectively. Half-filled with water, the pycnometers were weighed again. The sand sample was then weighed using a balance of scale 0.001 precision. Subsequently, the sand sample was placed into the pycnometer and carefully agitated to eliminate any air voids. The pycnometer was then left undisturbed for 24 hours. After this period, water was added to bring the volume up to 500 ml, and the pycnometer was reweighed. This entire procedure was repeated for both pycnometers and the specific gravity was calculated as presented in table 2.
Table 2. Specific gravity of sand.

S/N

DESCRIPTION

DESIGNATION

FORMULAR

No of Pycnometr

P1

P2

1

Weight of pycnometer

A

511.9

519.8

2

Weight of pycnometer + water

B

1502.3

1503.5

3

Weight of water

C

b - a

990.4

983.7

4

Density of water

D

0.997

0.997

5

Volume of pycnometer

E

c/d

993.38

986.66

6

Weight of pycnometer + material

F

1142.5

1118.4

7

Weight of material

G

630.6

598.4

8

Total weight

H

b + g

2132.9

2101.9

9

Weight of pycnometer +water + material after 24 hours

I

1902.77

1870.35

10

Weight of water displaced

J

h - i

230.13

231.55

11

Volume of material

K

j/d

230.82

232.25

12

Specific gravity

L

g/k

2.73

2.58

13

Average

(P1 + P2)/2

2.66

2.1.3. Apparent Density
It was done using NF P 94-053 standard . The apparent density (once called as volume weight) of sand is the mass per unit volume of the material (sand) in its natural state. Sand was dried in an oven at the temperature of 105°C for 24hours to remove any moisture. It was then allow to cold at room temperature. Five molds 1,2,3,4 and 5 were weighed and filed with the dried sample. The mass of the container filed with the sample were measured using a scale balance. The volume of the container was displaced with a calibrated volume maker. The apparent density was calculated as presented in table 3.
Table 3. Apparent density of sand.

S/N

Description

Units

Formular

Number of Mold

1

2

3

4

5

1

Mass of mold

G

482.4

482.4

482.4

482.4

482.4

2

Mass of mold + material

G

3855.4

3729.6

3803

3711.9

3868.5

3

Mass of material

G

(2) – (1)

3372.8

3247.2

3320.6

3229.5

3386.1

4

Volume of mold

Cm3

2000

2000

2000

2000

2000

5

Apparent density

g/cm3

(3)/(4)

1.69

1.62

1.66

1.61

.69

6

Average apparent Density

g/cm3

Av (5)

1.654

2.1.4. Grain Size Analysis
For sand, the sieves ranges were selected from 6.3mm to 0.063mm according to NF EN 93-1 standard . Grain size analysis test was carried out to determine the percentage of different grain sizes contained within the sand. Mechanical or sieve analysis was utilized to determine the distribution of coarser, larger particles, revealing the relative proportions of different grain sizes within the sand mass. Sand sample of weight 2500g was measured using an electronic balance. Sieves were selected and arranged in order. The sand sample was sieved and from the sieve with the largest diameter to the smallest and the weight of the sand retained on each sieve is recorded. A graph was drawn on sieve size against passing of sand percentage. D10, D30, and D60 were extrapolated and coefficient of uniformity Cu and coefficient of curvature Cc were determined by
CuD60D10(1)
Cc(D30)2D10* D60(2)
Where,
D60 diameter of particles at 60%
D30 diameter of particles at 30%
D10 diameter of particles at 10%
2.1.5. Sand Equivalent Test
The test was carried out as follows in accordance with NF P 18-598 standard . The sand equivalent test is used to determine the presence of clay like substance in the aggregate sand. Three test tube tube1, tube2 and tube3 were filed with sand sample and water was added to them to create a uniform suspension. The mixtures were stirred and allow for 20 minutes while the times for stirring were noted. The various height were measured and the visual and piston sand equivalent were calculated as presented in Table 4.
Table 4. Sand equivalent of sand.

DESCRIPTION

Number of test tube

SE01

SE02

SE03

Installation time (T0)

11:08

11:09

11:10

Agitation and end of washing time (T1=T0+10)

11:18

11:19

11:20

Star of flocculation (T2)

11:21

11:22

11:23

Time of measurement ( T3 = T2+20)

11:41

11:42

11:43

Total Height

H1

mm

84

82

89

Height of sand at sight

H2’

mm

79

78

85

Height of sand with piston

H2

mm

74

75

80

Visual sand equivalent

Evs

=100*H2’/H1

94.05

95.12

95.51

Average

94.89

Piston sand equivalent

Es

= 100*H2/H1

88.10

91.46

89.89

Average

89.82

2.1.6. Organic Matter Content
This test was carried out according to NF P 94 050 standard . The purpose of the organic content test was to determine the level of the organic matter in the sand. It could be high, medium or low. Organic matter improves sand structure, nutrient holding capacity, water holding capacity and infiltration. The mass of an empty dry dish was measured and recorded. Sand was then placed into the dish and weighed. The dish with sand was subsequently placed in an oven set at 200oC for 4 hours. After drying, the dish was removed and allowed to cool to room temperature; the mass of the oven-dried sand (ODS) sample was then measured and recorded as presented in table 5.
Table 5. Organic matter content of sand.

S/N

Description

Designation

Formula

Number

1

2

3

1

Mark of can

A

P’

R’

T’

2

Weight of can (g)

B

29.3

27.8

26.1

3

Weight of can + sample (g)

C

297.2

341.7

291.6

4

Weight of can + ODS after 4 hours (g)

D

290.3

335.2

285.2

5

Weight of organic content(g)

E

C - D

6.9

6.4

6.6

6

Weight of ODS after 4hours

F

D - B

261

307

259.1

7

Organic content (%)

G

E/F * 100

2.64

2.08

2.54

8

Average organic content (%)

H

G1+G2+G3/3

2.42

2.2. Plastic
Plastic were hand-picked from the gutters, drainage and street of Bamenda, North West region of Cameroon, these waste were manually washed using detergent and was rinsed several times to remove the impurities. It was chopped into smaller sizes with the help of a knife and sun dried as seen in figure 2a and b.
Figure 2. a. Flicks from plasti bottles; b. Drying plastic.
2.3. Sand/Plastic Composition Formulation
The samples were formulated in nine ratio of sand/PET mixture by weight ranges from 10 to 90 % table 6. The plastic and sand were subjected under heat in a separate can, when the plastic was completely melted, the hot sand were pour into the melted plastic while stirring to have a homogenous mixture of the sample. The pouring process was done by using a ladle to dish mixture out of the pot. This mixture is then compressed in the moulds to reduce voids. After which the samples were removed from the moulds and allowed under room temperature for 35 days before testing. The corrugated mold was used with dimension 250mm X 200mm X 15 mm as seen in figure 3a and b.
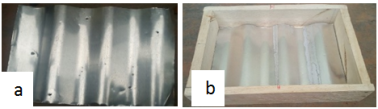
Figure 3. a.corrugated cover with print; b. corrugated mold print.
After molding, the dough is compacted by the use of pressed to eliminate voids and pores that could store water as shown in figure 4 a and b. The different specimen compositions are presented on table 6 and figure 5.
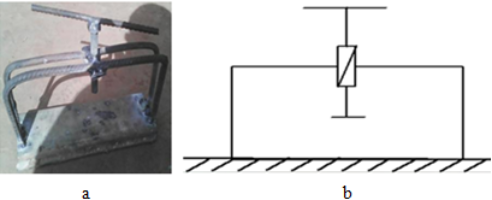
Figure 4. a. Press used; b. kinematic diagram of press.
Table 6. Different percentages of plastics/sand composition.

Composites

Percentage of plastics (%)

Percentage of sand (%)

Sample A

10

90

Sample B

20

80

Sample C

30

70

Sample D

40

60

Sample E

50

50

Sample F

60

40

Sample G

70

30

Sample H

80

20

Sample I

90

10

The sand/plastic mixture proportion texture
Figure 5. a. Specimen A, B and C; b. Specimen D, E and F; c. Specimen, G, H and I.
2.3.1. Water Absorption Test
The water absorption test was carried out in GEOSTRUCT Menteh. To determine the rate of water absorption; the samples were weighed (Mi) and immersed in water at room temperature. The samples were taken out periodically and after wiping out the water from the surface of the sample weighted (Mf) immediately using a Digital scale of 0.001 precision. The specimens were weighed regularly after every 24 hours till saturation.
Water absorption rate WA% was then calculated as
WA %=Mf-MIMI 100(3)
Where Mi and Mf are the masses of the samples before and after immersion in water respectively .
2.3.2. Flexural Test
The flexural test was conducted using flexural test machine of mark RMU serial 1461288 with the capacity of 500dN at the laboratory of civil engineering in Government Technical High School (GTHS) Bamenda. The specimens of the size 160 × 40 × 40 mm were tested for flexural strength. An increasing axial load was applied on the specimens under a three-point load until failure occurred to obtain the maximum flexural load. The specimen dimensions and weights were taken before the testing and ten (10) samples were tested per formulation.
The flexural strength was obtained by using the formula;
Flexuralstrength=3FL2bd2(4)
Where;
F: maximum flexural load (daN)
L: length of test sample (mm)
W: width of test sample (mm)
d: thickness of test sample (mm)
2.3.3. Drilling Test
Drilling test was carried out at Government Technical High School Bamenda in the electromechanical maintenance workshop. Each of the specimens was drill with the help of a pillar drilling machine while the time taken from when the drill touches the specimen to the time it produces a true hole was recorded from an electronic stop watch.
2.3.4. Impact Test
Impact test was carried out at LAMMA, laboratory of mechanical engineering in Higher Technical Teacher Training College, University of Douala, Cameroon. This was done by placing the specimen on the impact machine where the arm of the machine was raised to a height and then released. The initial height and angle were noted then values are taken when the arm breaks the specimen and the angle read. The impact coefficient was calculated by;
K=Eo-E1S(5)
where
k is the impact coefficient,
E0 is the energy without loading,
E1 is the energy gotten after loading and
S cross sectional area of sample specimen
3. Results and Discussion
3.1. Natural Water Content
The results obtained from PH (potential hydrogen) test and the moisture content shows that, the sample relation of colour identifies the sand to be natural with 0.87% average moisture content figure 6. Natural sand when used with cement has no negative reaction.
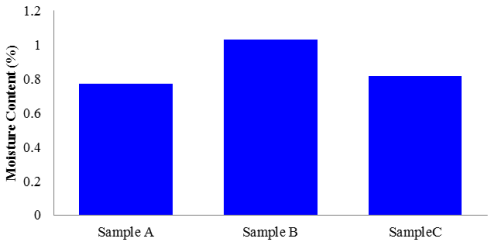
Figure 6. Moisture content of sand.
3.2. Specific Gravity
The value of average specific gravity obtained for the sand was 2.66 is within accepted values and comparable to Kulkami and Nemade (2020) with 2.61-2.7. Note that the limits for specific gravity given in Figure 7 are not strict requirements for sand but only a representative of the range of specific gravity of most normal weight sand used in this production.
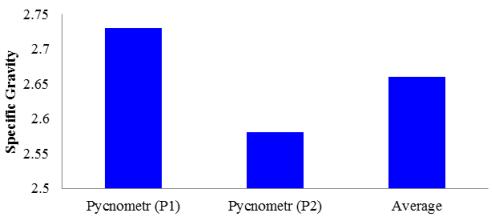
Figure 7. Specific Gravity of sand.
3.3. Apparent Density
The bulk density of river sand ranges between 1600 to about 1800 kg/m3. The bulk density is dependency of mineral composition; sorting and void ratio of the sand grains (Abdias et al 2023) . The apparent or bulk density of the sand use was similar to values reported from previous investigation (Meghashree et al 2016) . The values of density obtained in this study as 1.656 g/cm3 (figure 8) may be due to the fact that the sand was coarse and porous in it grains.
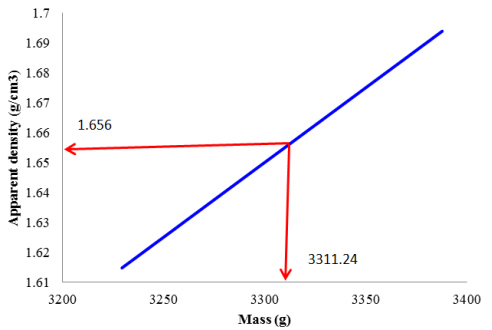
Figure 8. Apparent density of sand.
3.4. Grain Size Analysis
The particle size distribution of the sand review in figure 9 that the coefficients of curvature (Cc) obtain is 0.79 and the coefficient of uniformity (Cu) is 3.17. A well graded soil has a Cu value of 5 or even more and a Cc value ranging between 1 and 3 . The values indicate that the sand has small range of particle size. But as compared to the value obtained by in a study on river sand and quarry dust, the value of Cc is smaller as of theirs 0.96 and that of Cu greater as of theirs of 2.11. The values variation or differences may due to the different location from where the sand was collected. The fineness modulus Mf value for the sand was gotten as 2.97 which fall within the range of coarse sand (fine aggregate) known locally as sharp sand between 2.9 to 3.2. the aggregate falls in zone 2 of fine aggregate classification and can be used for producing concrete .
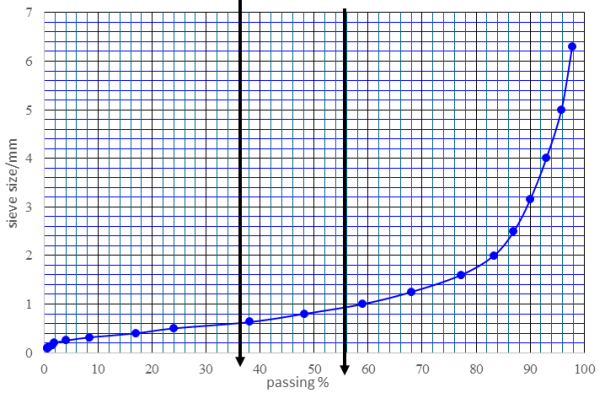
Figure 9. Grain size analysis.
3.5. Sand Equivalent Test
The value of sand equivalent ranges from less than 30 to more than 90 with . The value of the sand equivalent obtained for this study is 89.82 figure 10 and with approximation of 90. This is within the range and indicates that there is less clay like compounds in the sand therefore the sand is clean and free from human waste activity.
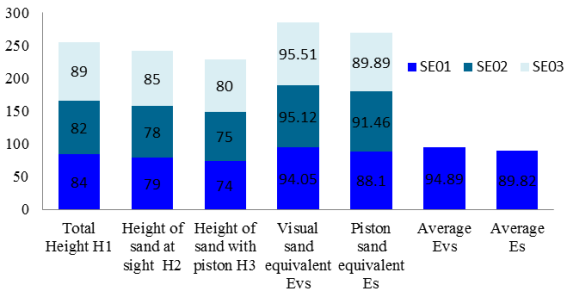
Figure 10. Sand Equivalent test.
3.6. Organic Matter Content
The value of organic matter content in the sand is 2.42 figure 11. The range of organic matter content in sand and soils ranges from less than 1% to about 5%. The value obtained indicates a higher value of organic matter content present in the sand. It can be due to the human activities around where the sand was collected. ODS oven dried.
Figure 11. Organic matter content.
3.7. Water Absorption of Composite
The line graph in figure 12 shows that the effect of PET parameters on the water absorption of composites with increase in immersion time. It is observed that the water absorption process was increasing as the immersion time increases from the first day up to forth day and started leveling off after the forth where the water absorption approaches saturation and an equilibrium can be seen. At A where composite has 10/90% ratio of PET/sand the water absorption recorded the highest percentage while I with 90/10% ratio recorded the lowest percentage of water absorption at saturation. The average result presented here shows that when the quantity of plastic in the sand/PET composite increases as the sand ratio decreases, there is a reduction in the level of water absorption of the composite. These results may be so because all plastics are water proof and the water absorb by the composite is due to the present of void in the composite cause by the presence of sand in the composite. According to good quality bricks absorb less amount of water. For a good quality composite, the water absorption should be less than 20% of its own weight. Studies on the porosity to water show that it reduces with the increase in the percentage of plastic wastes (PET). Indeed, sand has a high porosity relative to that of the plastic. This is why the addition of the percentage of plastic makes the value of this porosity to fall . These results show that all the composite material samples made from PET/plastic wastes that have been analyzed have low water porosity values less than 4% that vary between 3.62% and 0.11% of measurement summation at saturation compared to cement materials that have porosity values higher than 10% (Konin, 2011)
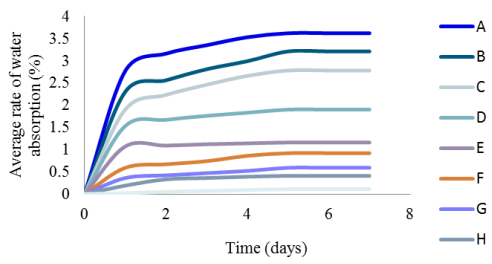
Figure 12. Average Rate of Water Absorption.
3.8. Manufacturing Time of the Different Specimen
The results of the time of manufacture for each specimen are as shown on the figure 13 which gives the evolution of working times in function of the specimens.
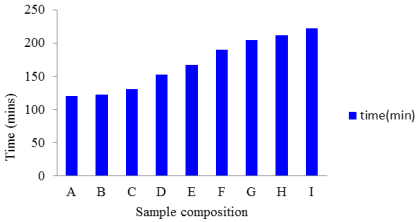
Figure 13. Variation of the working time as a function of specimens.
It can be observed from the graph that the amount of plastics keeps increasing as the time also added and this may be due to the quantity of plastics.
3.9. Heating Control Diagram
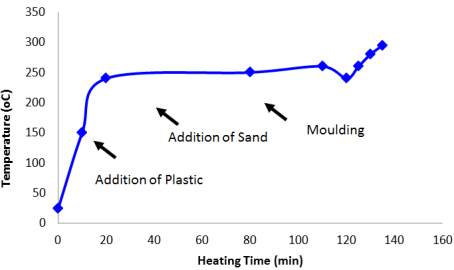
Figure 14. Heating control Diagram.
We can observe from the Figure 14 that there is an increase in temperature with time till the point where plastics are completely introduced and we see a sharp rise in the temperature which is maintained for a period of time while introducing sand. When the sand is completely mixed, we notice that at the moulding stage, the temperature rises drastically and this may be due to the presence of sand since it has a high degree of storing heat.
3.10. Mechanical Test Analysis
3.10.1. Flexural Test
The graph of figure 15 shows that the maximum flexion effort is obtained with the mixture 50 % of plastic and 50% of sand i.e. 200.5daN/cm2.For the specimen lower than 20 % of plastic waste, the flexion effort is weak. On the other hand, if the quantity of plastic of the mixture exceeds 50 %, the flexion effort decreases. There is then a well-defined composition of the mixture so that the bending effort at the end is optimal and the result of sand/plastic (200.5daN/cm2) is the peak. Comparing this result to that of found out that the flexural strength of new composite decreases steadily as the percentage of plastic increases.
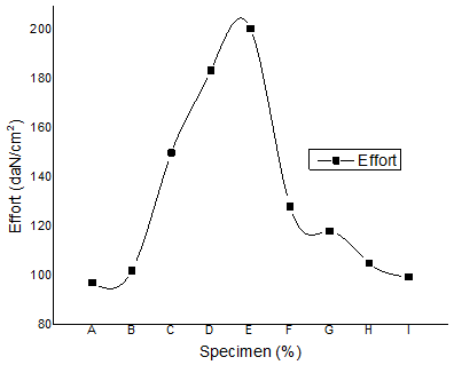
Figure 15. Variation of bending effort of the plastic/sand mixture.
3.10.2. Drilling Test
The test of machinability was carried out to determine and the results shown in figure 16.
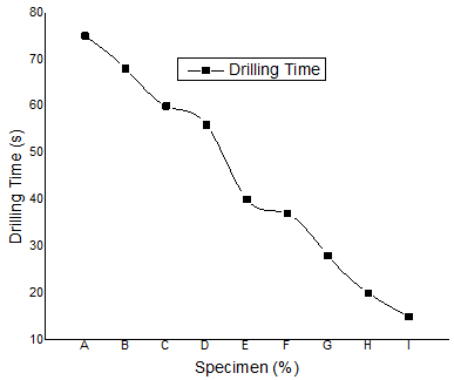
Figure 16. Variation of drilling time possibility.
It is noticed from the graph that the drilling time is directly related to the percentage of sand and hence the time decrease as the percentage of sand decreases.
3.10.3. Impact Test
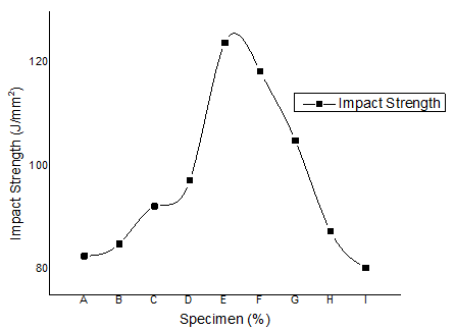
Figure 17. Impact strength of sand/plastic composite.
The impact strength of the composite increases steadily from 40% to 50% of plastic and starts to drop after 50% as seen in figure 17 above. Comparing this result to the one of who works on the mechanical properties of concrete using recycled plastic indicates that the addition of plastic like aggregate allows enhancing the impact resistance of concrete.
4. Conclusion
In order to mitigate the environment from non-biodegradable PET for a more sustainable ecofriendly product, an investigation on the physical properties of river sand and mechanical properties of sand/PET composite were carried out. It was observed that the river sand had coefficient of uniformity, coefficient of curvature and fineness modulus of 3.17, 0.79, and 2.97 respectively. From the produced composite which varied from A- I (90/10, 80/20, 70/30, 60/40, 50/50, 40/60, 30/70, 20/80, 10/90), it was observed that sample E had the highest impact and flexural strength respectively while sample I (10/90 of sand/plastic composite) has the lowest water absorption rate of 0.11% after 5 days, this could be attributed to the high concentration of Plastic with the sand/plastic composite which renders the sample more impermeable to water. Hence from these experimental observations, it could be deduce that the sample E (50%/50% of sand/plastic composite) was an optimal in the production of corrugated sand/plastic composite for possible application a roofing material in building construction. drilling time.
Abbreviations

PET

Polyethylene Terephthalate

HDPE

High-Density Polyethylene

PVC

Polyvinyl Chloride

LDPE

Low-Density Polyethylene

PP

Polypropylene

PS

Polystyrene

MSWM

Municipal Solid Waste Management

ODS

Oven-Dried Sand

GTHS

Government Technical High School

Author Contributions
Yakum Reneta Nafu: Conceptualization, Funding acquisition, Supervision, Writing – original draft
Tchemou Gilbert: Methodology, Validation, Supervision
Waindim Yisa Tufoin Albert: Resources, Validation, Writing – review & editing
Yuyoh Gemlak Paul: Data curation, Investigation, Writing – review & editing
Foba Josepha Tendo: Methodology, Resources, Supervision
Richard Nyengefe Saingwea: Data curation, Writing – review & editing
Noubissie Tchoko Romuald Loic: Formal Analysis, Writing – review & editing
Conflicts of Interest
The authors declare no conflicts of interest.
References
[1] Sobhee, L., 2010. Soil Reinforcement using perforated plastic (polyethylene) waste. South Africa: University of Cape Town. P456.
[2] Faridah C., Denis K. and Laxmee S.-B. (2012) Investigating Perforated Plastic Shopping Bags as Soil Reinforcement Material, Conference Paper
[3] Schaffler, A., 2011. Enhancing resilience between people and nature in urban landscapes.
[4] European Commission DG ENV In association with PLASTIC WASTE IN THE ENVIRONMENT Specific contract 07.0307/2009/545281/ETU/G2 under Framework contract ENV.G.4/FRA/2008/0112 Revised final report April 2011.
[5] SPI, 2014. SPI resin identification code - Guide to correct use., 2014.
[6] Barendse, C.-J., 2012. Investigation into the reinforcement of District six clay using shredded plastic (polythene) waste shopping bags. South Africa.: University of Cape Town.
[7] GangaRao, H.V.S., Taly, N. & Vijay, P. V., (2006). Reinforced Concrete Design with FRP Composites, 3rd ed CRC Press. USA p.
[8] Geyer, R., Jambeck, J. R., & Law, K. L. (2017). Production, use, and fate of all plastics ever made. Science advances, 3(7), e1700782.
[9] Kijo-Kleczkowska, A and Gnatowski, A (2022). Recycling of Plastic Waste, with Particular Emphasis on Thermal Methods Review. Energies 2022, 15, 2114.
[10] Sadan, Z. and De Kock, L. (2021). Plastic Pollution in Africa: Identifying policy gaps and opportunities. WWF South Africa, Cape Town, South Africa. Available at:
[11] Veronica E. M., Osric T. F. and Adam D. R. (2007) Waste management in Cameroon: A new policy perspective? Resources, Conservation and Recycling 52 (2008) 592–600,
[12] Ball J (2006) Waste Management in Developing Countries: Seven Characteristic and Seven Principles. In. proceeding WASTE sustainble waste and resource management 2006 p 687-696.
[13] Manga, V.E., Forton, O.T. and Read, A.D. (2008). Waste Management in Cameroon: A new policy perspective? Science Directs, (52), PP. 592 - 600.
[14] Achu J F (2019) Waste Management Regulation in Cameroon: A Curse or Blessing? Scholars International Journal of Law, Crime and Justice. 2(11) 398-410.
[15] EPA, (1990). Methods to Manage and Control Plastic Wastes: Report to Congress. Environmental Protection, (February), p.450.
[16] Randall, C.S. Das, (1991). Plastic wastes management, control, recylcing, and disposal., New Jersey, USA: Noyes Data Corporation.
[17] Andrady, A.L., (2015). Plastics and Environmental Sustainability: Fact and Fiction, 2nd Edition, IBBN John Wiley & Sons. USA p1189.
[18] Albano C., Camacho N., Reyes J., Feliu J.L. and Hernandez M. (2005), “Influence of crap rubber addition to Portland concrete composites: Destructive and non- destructive testing”, Composite Structures,71(3-4), 13p200.
[19] Turatsinze A., Bonnet S., and Granju J.L. (2005) “Potential of rubber aggregates to modify properties of cement based-mortars: improvement in cracking shrinkage resistance”, Construction and Building Materials,21, 2005 pp176–181.
[20] Yazoghli-Marzouk O, Dheilly RM, Queneudec M (2007) Valorization of post-consumer waste plastic in cementi-tious concrete composite. Waste Management 27(2) 2007: 1870–1876.
[21] Sam, T. D. and Tam M. N. (, 2002) Polymer concrete based on recycled polyethylene terephtalate (PET). NOCMAT/3. Vietnam International Conference on Non-Conventional Material and Technologies, 226-228.
[22] Chauhan S.S, Bhushan K, Prem S S, Abuzaid K, Hritik G, and Shivank G (2019) Fabrication and Testing of Plastic Sand Bricks IOP Conf. Ser.: Mater. Sci. Eng. 691 012083.
[23] Ndibi Mbozo’o MP., Tchusseu M., Edoun M., & Kuiche A. (2017). Physical Characterization of Composite Materials Based On Plastic Waste (Polyethylene Terephthalate) And Sand. International Journal of Engineering Sciences & Research Technology, 6(10), 422-433.
[24] Meenakshi M and Mohin M B (2020). Study on the Engineering Behaviour of Sand Reinforced with Polyethylene Terephthalate (PET) Wastes. International Journal of Scientific Research and Engineering Development, 25(4) 2581- 7175.
[25] AFNOR, Essai de détermination de la teneur en eau pondérale des matériaux, méthodepar étuvage, Norme française, NF P 94-050, Paris, 1995.
[26] AFNOR, Sols: reconnaissance et essais, Détermination de la masse volumique des sols fins en laboratoire, Méthode de la trousse coupante, du moule et de l’immersion dans l’eau, Norme française NF P 94-053, Paris, Octobre 1991, AFNOR 2013 Tests for Geometrical Properties of Aggregates—Part 1: Determination of Particle Size Distribution—Sieving Method NF EN 933-1.
[27] AFNOR, Essai de détermination de l’équivalent de sable, Norme française, NF P18-598, Paris, 1991.
[28] Dhakalhn, Zhang ZY, Richardson (2007) Effect of water absorption on the mechanical properties of hemp fibre reinforced unsaturated polyester composites, composites science and Technology 67(7-8) 1674-1683.
[29] Kulkarni, P. B. and Nemade, P. D. (2020). Evaluation of Experimental Datasets on Physical properties of Natural Sands and Crushed Sand. International Journal on Emerging Technologies, 11(3): 127–132.
[30] Abdias, M.W.M., Blanche, M.M., Nana, U.J.P., Abanda, H.F., François, N. and Chrispin, P. (2023) River Sand Characterization for Its Use in Concrete: A Revue. Open Journal of Civil Engineering, 13, 353-366.
[31] Meghashree M, Gowda A K, and Roopa K (2016) Comparison of Physical Properties between Natural Sand and Manufactured Sand International Journal for Innovative Research in Science & Technology| Volume 3 | ISSN (online): 2349-6010.
[32] McKinley, D. G. (1996). Soils. In N. Jackson & R.K. Dhir (Eds.), Civil engineering materials (5th ed.) (pp. 349-447). Basingstoke, UK: Palgrave.
[33] Opara, H.E, Eziefula, U.G., and Eziefula B I (2018) Comparison of Physical and Mechanical Properties of River Sand Concrete with Quarry Dust Concrete. Journal of Civil Engineering Special Issue
[34] ASTM D2419 Standard Test Method for Sand Equivalent Value of Soils and Fine Aggregate 1.
[35] AASHTOT176 Standard Method of Test for Plastic Fines in Graded Aggregates and Soils by Use of Sand Equivalent Test 3.
[36] Aiswaria K, Khansa Abdulla, E B Akhil, Haritha Lakshmi V G, Jerin Jimmy (2018) Manufacturing and Experimental Investigation of Bricks with Plastic and M-Sand International Journal of Innovative Research in Science, Engineering and Technology Vol. 7,1574-1586.
[37] Konin A. (2011) Effect of plastic waste content on Physico-Mechanical properties of flexible pavements, International Journal of Civil and Structural Engineering Volume 2, pp 382-394.
[38] Choi, Y.W., Moon, D.J., Chung, J.S., and Cho, S.K. (2005). “Effects of waste PET bottles aggregate on the properties of concrete.” Cem. Concr. Res., 35(4), 776-781.
[39] Ahmed Abu Ishaiba (2015). “Mechanical Properties of Concrete Using Recycled Plastic”. The Islamic University-Gaza Research and Postgraduate Affairs Faculty of Engineering Civil Engineering Department, page no: (1-55).
Cite This Article
  • APA Style

    Nafu, Y. R., Gilbert, T., Albert, W. Y. T., Paul, Y. G., Tendo, F. J., et al. (2024). Experimental Study of Physical Properties of River Sand on the Mechanical Properties of Sand/Plastic Composites for Roofing. Composite Materials, 8(2), 44-56. https://doi.org/10.11648/j.cm.20240802.13

    Copy | Download

    ACS Style

    Nafu, Y. R.; Gilbert, T.; Albert, W. Y. T.; Paul, Y. G.; Tendo, F. J., et al. Experimental Study of Physical Properties of River Sand on the Mechanical Properties of Sand/Plastic Composites for Roofing. Compos. Mater. 2024, 8(2), 44-56. doi: 10.11648/j.cm.20240802.13

    Copy | Download

    AMA Style

    Nafu YR, Gilbert T, Albert WYT, Paul YG, Tendo FJ, et al. Experimental Study of Physical Properties of River Sand on the Mechanical Properties of Sand/Plastic Composites for Roofing. Compos Mater. 2024;8(2):44-56. doi: 10.11648/j.cm.20240802.13

    Copy | Download

  • @article{10.11648/j.cm.20240802.13,
      author = {Yakum Reneta Nafu and Tchemou Gilbert and Waindim Yisa Tufoin Albert and Yuyoh Gemlak Paul and Foba Josepha Tendo and Richard Nyengefe Saingwea and Noubissie Tchoko Romuald Loic},
      title = {Experimental Study of Physical Properties of River Sand on the Mechanical Properties of Sand/Plastic Composites for Roofing
    },
      journal = {Composite Materials},
      volume = {8},
      number = {2},
      pages = {44-56},
      doi = {10.11648/j.cm.20240802.13},
      url = {https://doi.org/10.11648/j.cm.20240802.13},
      eprint = {https://article.sciencepublishinggroup.com/pdf/10.11648.j.cm.20240802.13},
      abstract = {The non-biodegradability of plastics released into the environment makes the soils infertile, impedes the drainage of waste water and rain water in existing gutters and the spread of waterborne diseases which are traits to human life. This study aimed at producing roofing sheet from waste polyethylene terephthalate (PET) and river sand. Sand was collected from the river while plastic bottles were collected from the environment. The physical properties of the sand such as natural water content, specific gravity, apparent density, grain size analysis, Sand equivalent test and Organic matter content were determined. Nine different sample formulation of ten each were moulded with sand/PET content of 90/10, 80/20, 70/30, 60/40, 50/50, 40/60, 30/70, 20/80, 10/90 (A to I). Water absorption rate, flexural strength, impact test and drilling test were determined. It was observed that the averages of natural water content, specific gravity and apparent density were 0.871%, 2.66 and 1.654g/cm3 respectively. The coefficients of uniformity, coefficient of curvature and fineness modulus of sand from grain size analysis were 3.17, 0.79 and 2.97 respectively. The averages of visual and piston sand equivalent and organic matter content were 94.89%, 89.82% and 2.42% respectively. The rates of water absorption of composites were 3.62% to 0.11% at saturation. Flexural strength and impact were 200.5daN/cm2 and 123J/mm2 respectively while the drilling time was maximum at 80% sand. These results obtained reveal that plastic/sand composite can be used as a roofing material.
    },
     year = {2024}
    }
    

    Copy | Download

  • TY  - JOUR
    T1  - Experimental Study of Physical Properties of River Sand on the Mechanical Properties of Sand/Plastic Composites for Roofing
    
    AU  - Yakum Reneta Nafu
    AU  - Tchemou Gilbert
    AU  - Waindim Yisa Tufoin Albert
    AU  - Yuyoh Gemlak Paul
    AU  - Foba Josepha Tendo
    AU  - Richard Nyengefe Saingwea
    AU  - Noubissie Tchoko Romuald Loic
    Y1  - 2024/11/28
    PY  - 2024
    N1  - https://doi.org/10.11648/j.cm.20240802.13
    DO  - 10.11648/j.cm.20240802.13
    T2  - Composite Materials
    JF  - Composite Materials
    JO  - Composite Materials
    SP  - 44
    EP  - 56
    PB  - Science Publishing Group
    SN  - 2994-7103
    UR  - https://doi.org/10.11648/j.cm.20240802.13
    AB  - The non-biodegradability of plastics released into the environment makes the soils infertile, impedes the drainage of waste water and rain water in existing gutters and the spread of waterborne diseases which are traits to human life. This study aimed at producing roofing sheet from waste polyethylene terephthalate (PET) and river sand. Sand was collected from the river while plastic bottles were collected from the environment. The physical properties of the sand such as natural water content, specific gravity, apparent density, grain size analysis, Sand equivalent test and Organic matter content were determined. Nine different sample formulation of ten each were moulded with sand/PET content of 90/10, 80/20, 70/30, 60/40, 50/50, 40/60, 30/70, 20/80, 10/90 (A to I). Water absorption rate, flexural strength, impact test and drilling test were determined. It was observed that the averages of natural water content, specific gravity and apparent density were 0.871%, 2.66 and 1.654g/cm3 respectively. The coefficients of uniformity, coefficient of curvature and fineness modulus of sand from grain size analysis were 3.17, 0.79 and 2.97 respectively. The averages of visual and piston sand equivalent and organic matter content were 94.89%, 89.82% and 2.42% respectively. The rates of water absorption of composites were 3.62% to 0.11% at saturation. Flexural strength and impact were 200.5daN/cm2 and 123J/mm2 respectively while the drilling time was maximum at 80% sand. These results obtained reveal that plastic/sand composite can be used as a roofing material.
    
    VL  - 8
    IS  - 2
    ER  - 

    Copy | Download

Author Information
  • Department of Mechanical Engineering, Higher Technical Teacher Training College Bambili, The University of Bamenda, Bamenda, Cameroon;Laboratory of Mechanics and Adapted Materials, University of Douala, Douala, Cameroon;Department of Mechanical and Industrial Engineering, National Higher Polytechnic Institute, The University of Bamenda, Bamenda Cameroon

  • Laboratory of Mechanics and Adapted Materials, University of Douala, Douala, Cameroon

  • Department of Mechanical Engineering, Higher Technical Teacher Training College Bambili, The University of Bamenda, Bamenda, Cameroon

  • Department of Mechanical Engineering, Higher Technical Teacher Training College Bambili, The University of Bamenda, Bamenda, Cameroon;Laboratory of Mechanics and Adapted Materials, University of Douala, Douala, Cameroon

  • Department of chemistry, faculty of science, University of Buea, Buea, Cameroon

  • Department of Mechanical and Industrial Engineering, National Higher Polytechnic Institute, The University of Bamenda, Bamenda Cameroon

  • Department of Mechanical Engineering, Higher Technical Teacher Training College Bambili, The University of Bamenda, Bamenda, Cameroon;Resaerch Group for Innovative Materials, University of Douala, Douala, Cameroon

  • Abstract
  • Keywords
  • Document Sections

    1. 1. Introduction
    2. 2. Materials and Method
    3. 3. Results and Discussion
    4. 4. Conclusion
    Show Full Outline
  • Abbreviations
  • Author Contributions
  • Conflicts of Interest
  • References
  • Cite This Article
  • Author Information