Research Article | | Peer-Reviewed

Structural and Optical Properties of Fe Doped Tio2 Nanoparticles: Investigation of Effects of Different Doping Concentration

Received: 28 April 2024    Accepted: 14 May 2024    Published: 30 May 2024
Views:       Downloads:
Abstract

Fe-doped TiO2 nanoparticles (F-T NPs) were synthesized using the sol-gel method where different molar concentrations (0, 1, 2, 3, 5, 7, 9, and 10%) of Iron (iii) nitrate were added to a constant amount of the metal precursor TetraisopropylOrthotitanate (TTIP) solution, the solvent precursor ethanol and refluxing agent diethanolamine at the ratios of 1:6:1 respectively. The gel formed was annealed at 500°C in a muffle furnace for 2h. Fourier Transform Infrared (FTIR) showed Fe-O symmetrical stretching vibration for the 5% doping and above and Ti-O-Fe asymmetrical stretching vibration at wavenumber 668 cm-1 and 1033cm-1, respectively. Fe-O stretching vibration confirms substitution doping. The crystallite size was calculated using the Debye Scherer equation; 2% F-T NPs had the largest crystallite size at 16.45 nm, and 7% F-T NPs had the least size at 10.95 nm, a decrease of 2.80 nm from the 0% F-T NPs. X-ray diffraction spectra showed a merging of peaks at planes 105 and 211. The peak at plane 204 is found to diminish, and the growth of another peak at 2θ (64.28°). Optical analysis was studied using UV-Vis, where the Tauc plot estimated the calculated band gap (Eg). It was the least at 7% F-T NPs with a value of 4.41 eV, and 5% F-T NPs were found to have the highest value of 4.86 eV.% Transmittance is directly proportional to the optical band gap. Scanning Electron Microscope showed improved agglomeration and aggregation with a dense and smooth particle. Energy Dispersive Spectroscopy confirmed the presence of Fe, Ti, and O in the F-T NPs.

Published in Advances in Materials (Volume 13, Issue 2)
DOI 10.11648/j.am.20241302.11
Page(s) 20-30
Creative Commons

This is an Open Access article, distributed under the terms of the Creative Commons Attribution 4.0 International License (http://creativecommons.org/licenses/by/4.0/), which permits unrestricted use, distribution and reproduction in any medium or format, provided the original work is properly cited.

Copyright

Copyright © The Author(s), 2024. Published by Science Publishing Group

Keywords

F-T NPs, Doping, Band Gap, DSSC, Crystallite Size, Optical Properties

1. Introduction
The need to improve the efficiency of Dye-Sensitized Solar Cell (DSSC) has prompted many researchers to study ways of enhancing semiconductor oxides such as TiO2, ZnO, and SnO2, among others . Titanium dioxide (TiO2) has garnered considerable attention credit for its unique optical and structural properties due to, but not limited to, high surface area, chemical stability, biocompatibility, non–toxic in nature, and stability within a wide range of pH . These inherent properties of TiO2 make it an effective photocatalytic material for the degradation of organic compounds and the manufacture of a photoanode in photovoltaic cells, among other applications . The two stable polymorphs of TiO2, anatase and rutile, have an optical band gap of 3.2 eV and 3.0 eV, respectively .
TiO2 is only photoactive under Ultraviolet (UV) and has negligible absorption in the Visible (Vis) region . In the latter region, TiO2 is transparent and has a high recombination rate, which hinders its commercial use . The setback can be solved by either doping with other metal ions or nonmetals that produce more states in the conduction band gap region ; they include Al3+, Cu2+, Mn2+, Fe3+, and Zn2+, N, S, and C, respectively, or addition of a dye.
Doping is advantageous as these states trap photo-excited electrons, reducing the electro-hole (e-/h+) recombination rate and increasing the threshold wavelength for a sharp absorption edge in the Vis region . Doping TiO2 with Fe is economical and efficient as it can easily fit into the lattice structure of Ti due to its close ionic radius; the ionic radius of Fe3+ (0.69 Å) is near that of Ti4+ (0.745 Å) , it is locally available and of low-cost. It possesses a steady half-filled d5 orbital that can act as an electron and hole trap, as Ti3+/Ti4+ is located near that of Fe2+/Fe3+, resulting in increased charge carrier and decreased forbidden band gap .
Ghorbanpour, M., &Feizi, A. synthesized Fe-TiO2 using the molten salt method, and 0.5wt%Fe-TiO2 showed a 69% degradation activity vis a vis 1%, and 3wt% Fe doped TiO2 . Valero-Romero, M.J. et al. reported optimal photocatalytic performance at 0.15 and 0.5wt% Fe concentration . Kanjana, N. et al. synthesized Fe-doped TiO2 hollow sphere with various Fe contents 0.25, 0.50, 0.75, and 1.00% mole using carbon templates, and the highest power conversion efficiency of 6.025% was obtained at 0.25% Fe-doped TiO2 .
The above studies are majorly into Fe-TiO2 doped as a photocatalyst where the dopant percentage is less than 1%; it is to the best of the researcher's knowledge that higher dopant concentration of Fe-TiO2 applied as a photoanode has not yet been thoroughly and exhaustively reported. This paper investigates the effects of different% mole (1, 2, 3, 5, 7, 9, and 10) Fe doping on the structural and optical properties of the TiO2 anatase phase synthesized using the sol-gel method. Sol-gel was preferred over other synthesis methods due to its ease of operation. It gives a compound with similar molecular structures, crystals, or powder formed that is pure, fine, and of uniform size .
2. Methodology
2.1. Chemicals
Materials used in the synthesis process were of pure analytical grade and were used as received from Sigma-Adrich; they included tetra isopropyl orthotitanate (C12H28O4Ti) of purity 99.90%, absolute ethanol (C2H5OH) of Purity 99.90% and diethanolamine ((CH2CH2OH)2NH) of purity 99.3%. Ammonium hydroxide, Hydrochloric acid, and Iron (iii) nitrate (Fe(NO3)3.9H2O) of98% were obtained by S.B.Chem.Co., ltd.
2.2. Synthesis Procedure
F-T NPs were synthesized using the sol-gel synthesis method. The sol was prepared by adding 5 mL of tetra isopropyl orthotitanate (TTIP) to 20 mL of absolute ethanol in a clean 50 mL glass beaker placed on a magnetic stirrer and continuously stirred for 35 min at room temperature. After which, its pH was adjusted to 7 using a stock solution of HCl or NH4OH with a pH meter and agitated for 15 min. The sol was then placed on a hot magnetic stirrer where various% moles of Fe (1, 2, 3, 5, 7, 9, and 10) were doped and stirred for 10 min. 5 mL of diethanolamine was added dropwise to the sol and stirred for further 45 min where a gel was formed. The gel was dried for 2 h in an oven at 100°C to evaporate the residual solvents and left to age for at least 12 h. After that, the aged gel was combusted and annealed in a muffle furnace for 2 h at 500°C .
2.3. Characterization of the F-T NPs
For the functional group present to the F-T NPs, the Fourier Transform Infrared (FTIR) spectrophotometer IR Spirit Shimadzu model was used at a scanning range of 400 to 4000 cm-1. X-ray diffraction (XRD) measurements were made using ARL EQUINOX 100 at 40V, 0.9mA, at a scanning range of 20o-100o. The data obtained from the sample series was plotted, analyzed, and compared with the International Centre for Diffraction Data (ICDD) database, and the crystal sizes were computed using Debye-Scherer’s equation. Surface morphology and composition were analyzed using Scanning Electron Microscope Phenom XL G2. Optical properties were analyzed using a double-beam UV-Vis 1800 Shimadzu model at a wavelength ranging from 200 to 1100 nm.
3. Results and Discussion
3.1. FTIR Analysis
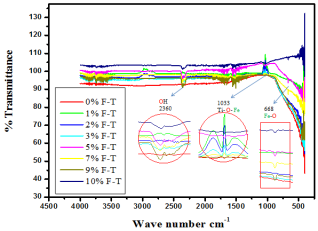
Figure 1. FTIR spectra showing the effects of different Fe doping concentrations on the functional groups of TiO2 NPs.
A Fourier Transform Infrared Spectroscopy (FTIR) provided information on functional groups, molecule geometry, and the intra- and intermolecular interactions in F-T NPs. Figure 1 shows the FTIR spectra of the F-T NPs annealed at 500°C, showing main bands at fingerprint region (< 1500 cm-1) that are 668 cm-1 and 1033 cm-1 and functional group region (> 1500 cm-1) at wave number 2360 cm-1. The stretching vibration at wave number 668 cm-1 is assigned to Fe-O; at 0%, the stretching vibration is absent, and it is so for 1, 2, and 3% F-T NPs. The absence of Fe-O symmetrical stretching vibration at 3% and below affirms interstitial doping, where the Fe3+ ions are squeezed into the interstitial positions of the crystal lattice. Sun L, et al. reported that interstitial doping occurs at low Fe doping concentration due to the slight mismatch in the ionic radius of the host Ti4+ and the dopant Fe3+. Substitution doping occurs at and above 5% F-T NPs due to the high Fe3+ ions concentration in the lattice. The substituted Ti4+ ions occupy an interstitial position to maintain charge neutrality and atom stability. When T NPs were annealed at different temperature, the vibration appeared at and above 600°C, termed the rutile phase, and was absent in the anatase phase at and below 500°C; it was assigned to Ti-O-Ti vibration . The asymmetric stretching vibrations at 1033 cm-1 are assigned to Ti-O-Fe. It confirms a twist-bending vibration from different bond lengths between the atoms of Ti and Fe. For the F-T NPs doped samples, the vibration orientation is a +180o rotation with respect to FTIR analysis for the T NPs annealed at a different temperature . The change in orientation confirms wagging bending vibration, which oscillates back and forth around the equilibrium positions due to the uneven weight distribution of Ti and Fe within the lattice. The stretching at 2360 cm-1 is assigned to –OH from the solvent precursor ethanol and the refluxing agent diethanolamine forming Ti-OH.
3.2. XRD Analysis
XRD was used to investigate the structural properties of the different% F-T NPs annealed at 500°C. Figure 2 shows XRD diffraction patterns of (0, 1, 2, 3, 5, 7, 9 and 10%) F-T NPs.
The 2 θ (37.9, 48.0, 53.8, 54.8, 62.7, 68.8, 70.0, and 75.0) correspond to the reflection from 004, 200, 105, 211, 204, 116, 220 and 215 crystal planes of the tetragonal TiO2 structure. All diffraction peaks agreed with reported JCPDS card no 84- 1286 for anatase. The effect of Fe doping concentration led to the growth of some peaks, some of which were suppressed. As depicted in Figure 2, the two peaks at planes 105 and 211 for 2θ (53.8o and 54.8o, respectively) are found to merge and become one. The peaks merge due to the broadening of diffraction peaks caused by microstrain within the Ti-O-Fe crystal lattice. Micro strain is attributed to the mismatch in ionic radii ofTi4+ and Fe3+ ≈ 0.055 Å, different bonding characteristics, coordination preferences having different electronic configuration [Ar] 3d2 4s2 and [Ar] 3d6 4s2 and having a dopant with varying states of charge with that of the host. Peak 200 and 204 are found to diminish, and growth grows at 2θ (48.0o, 62.7o), respectively. It is attributed to lattice distortions and rearrangement of atoms within the Ti-O-Ti lattice emanating from introducing a Fe atom forming Ti-O-Fe that affects the spacing between crystal planes.
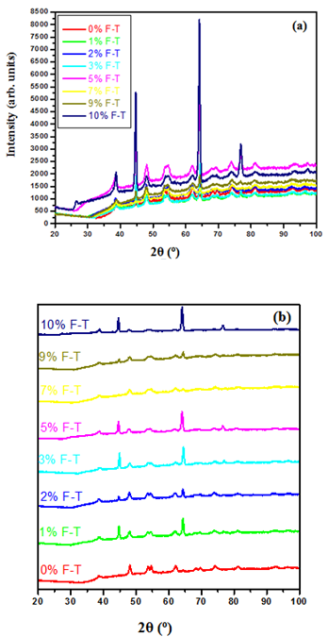
Figure 2. Diffractograms(a) merge overlaid and (b) stacked panel for (0, 1, 2, 3, 5, 7, 9, 10)% F-T NPs annealed at 500°C.
The dominance phase is anatase, and its average crystallite size was estimated using the Debye Scherer equation Eq (1).
S =GβCosθ(1)
Where S is the average crystallite size of the NPs (nm), G is a constant 1.44807 Å (obtained from the product of the shape factor ≈ 0.94, and wavelength of X-rays used 1.5405 Å), β is the diffraction line broadening measured at half of its maximum intensity (rad) (FWHM), and θ is the Bragg’s diffraction angle.
An increase in crystallite size for the 1 and 2% F-T NPs confirms interstitial doping. The Fe atoms are squeezed into the spaces between the Ti-O-Ti crystal lattice, known as interstitial sites. It affirms that low Fe dopant concentration forms interstitial doping, and the transmittance of Fe-O vibration cannot be detected in an FTIR as it is occupied within the crystal lattice of the host atoms. XRD analysis confirms FTIR analysis for the absence of Fe-O stretching vibration at wavenumber 668 cm-1 for 1, 2, and 3% F-T NPs.
As illustrated in Figure 3, the incorporation of high Fe doping concentration in TiO2 structure generally reduces grain growth and causes a reduction of the average crystallite size. The decline in crystallite size is attributed to the development of strain between the host TiO2 and dopant Fe atoms that develop due to a difference in their ionic radius of approximately ≈ 0.055 Å. Strain is developed as the crystal lattice adjusts to accommodate the Fe atoms of a small ionic radius in the Ti-O-Ti structure. This decline in crystallite size confirms substitution doping, where Fe atoms substitute Ti atoms in the Ti-O-Ti forming, Ti-O-Fe. XRD analysis confirms FTIR analysis for the Ti-O-Fe stretching vibration at wave number 1033 cm-1 and Fe –O stretching vibration for 5, 7, 9, and 10% F-T NPs at wave number 668 cm-1, respectively. Fe substitution doping occurs after the dopant has undergone interstitial doping, and more dopant atoms are still populated around the lattice structure. The displaced atoms of Ti occupy interstitial positions or other available sites in the crystal lattice to allow the crystal structure to adjust and maintain overall charge neutrality and structural stability. Therefore, the decline in crystallite size is contributed by the number of substituted Ti with Fe atoms within the Ti-O-Ti; 7% F-T NPs had the least crystallite size and hence had the highest substituted Fe atoms. In that regard, the increase in crystallite size between 7% F-T NPs and 9% F-T NPs resulted from both full substitution doping and the extra Fe atoms squeezing in more in the interstitial sites, which generally reduces the average strain, increasing crystallinity.
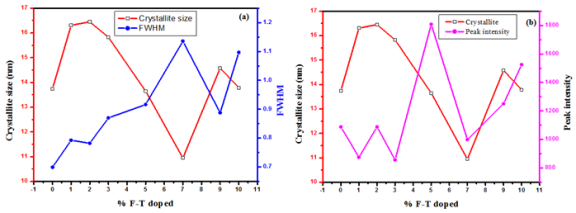
Figure 3. Graph displaying comparison on the (a) FWHM and (b) Peak intensity with crystallite size of varied% F-T NPs.
As tabulated in Table 1, 2% F-T NPs have the largest crystallite size of 16.45 nm, showing an increase of 2.70 nm, and 7% F-T NPs with the least size of 10.95 nm, a decrease of 2.80 nm from the 0% F-T NPs. As reported by Gakuru, S.W., et al. , the average crystallite size, as shown in Figure 3 (a), is inversely proportional to their corresponding FWHM with the highest value of 1.13566o at 7% F-T NPs, an increase of 0.43648o from the 0% F-T NPs. A slight increase in FWHM value between the 0% F-T NPs and doped F-T NPs confirms a broadening of peaks from the asymmetrical stretching of Ti-O-Fe. The graph of crystallite size and peak intensity vs.% F-T NPs, as shown in Figure 3 (b), shows average peak intensity was highest at 5% F-T NPs with a value of 1807 a.u and least at 3% F-T NPs with a corresponding value of 857.204 a.u. High peak intensity is attributed to the improved (004) plane preferred during annealing.
Table 1. Average values of peak intensity, FWHM, and crystallite size of different% F-T NPs calculated from X-ray diffraction (XRD) pattern.

% F-T NPs

Average peak intensity (a.u)

Average FWHM(o)

Average crystallite size (nm)

0% F-T NPS

1088.34

0.69918

13.75

1% F-T NPs

875.53

0.79252

16.30

2% F-T NPS

1088.75

0.78221

16.45

3% F-T NPs

857.20

0.86961

15.82

5% F-T NPS

1807.85

0.91624

13.65

7% F-T NPs

999.01

1.13566

10.94

9% F-T NPS

1249.89

0.88773

14.57

10% F-T NPs

1525.14

1.09684

13.78

A higher specific surface area in photoanode is essential in maximizing light absorption, providing sufficient active sites for photochemical reactions, and promoting efficient charge separation and transport. Specific Surface Area (SSA) was calculated by considering the total area covered by the crystals in nit mass using Eq (2).
SSA=WSP(2)
Where = 6×10³ρ is a constant used to calculate SSA for TiO2 with a value of 1.4184 × 103 cm3/g, ρ is the density of TiO2 NPs (4.23g/cm3), and Sp denotes the crystal size obtained by the Debye-Scherer equation.
As shown in Figure 4 (a), SSA is found to be inversely proportional to crystallite size. Amongst the F-T NPs, the 7% F-T NPs have the highest value of 12.9556 × 10¹² M2g-1.
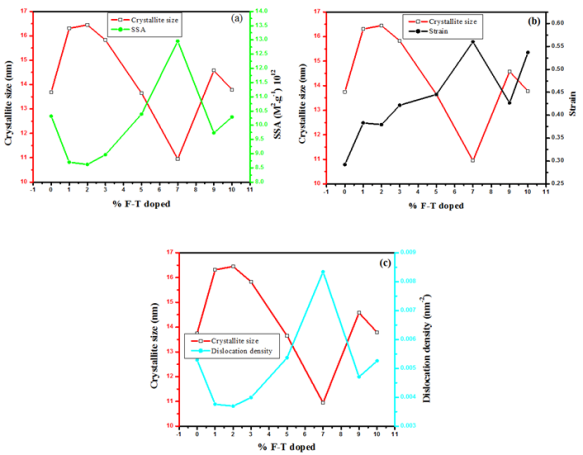
Figure 4. Graph displaying comparison on the (a) SSA, (b) strain, and (c) dislocation density with crystallite size of varied% F-T NPs.
Table 2. Calculated average values of Strain, Specific Surface Area, Dislocation density, and Crystallite size of different% F-T NPs calculated from X-ray diffraction (XRD) pattern.

% F-T NPs

Average Strain (ε), lines/ nm2

Average Specific surface area, M2g-1 ×10¹²

Average dislocation density(δ), lines/ nm3

Average crystallite size (nm)

0% F-T NPs

0.29204

10.3159

0.005289

13.75

1% F-T NPs

0.38314

8.6968

0.003759

16.30

2% F-T NPs

0.37948

8.6220

0.003695

16.45

3% F-T NPs

0.42185

8.9619

0.003992

15.82

5% F-T NPs

0.44532

10.3911

0.005367

13.65

7% F-T NPs

0.56009

12.9555

0.008342

10.94

9% F-T NPs

0.42683

9.7299

0.004705

14.57

10% F-T NPs

0.53681

10.2878

0.00526

13.78

The decreased crystallite size was due to the strain of the % F-T NPs. The strain values were calculated using Eq (3).
Ɛ=β 4tanθ(3)
Where β is the FWHM, and θ is the diffraction angle in radians.
As depicted in Figure 4 (b), the strain in the NPs was found to have an inverse relationship with the crystallite size. It was found to be highest at 7% F-T NPs with a corresponding strain value of 0.56009 and the least crystallite size value of 10.94847 nm. It is worthwhile to note that the strain values are higher for the doped compounds compared to the un-doped as tabulated in Table 2. It is contributed by the mismatch in ionic radii of Ti4+ and Fe3+ ≈ 0.055 Å, where, during substitution doping, a distortion occurs in the crystal lattice, and charge imbalance within the lattice leads to structural rearrangements to maintain charge neutrality.
Dislocation density (δ) was calculated using Eq (4) as suggested by Velumaini and Sharma et al.
δ =1S2(4)
Where S is the crystallite size (nm) obtained from XRD results, the calculated values of the dislocation density were tabulated in Table 2 and presented in the graph as shown in Figure 4 (c). Dislocation density indicates the dislocation network in the particle structure; the decreased dislocation density for 1, 2, and 3% F-T NPs shows improved crystallinity.
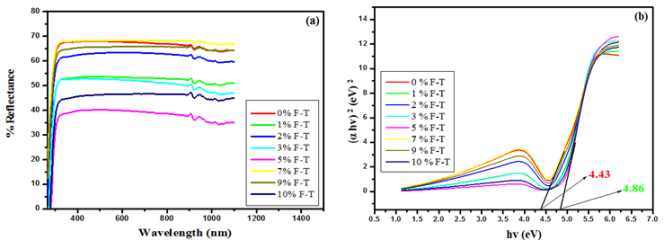
Figure 5. Graph displaying (a) reflectance spectra and (b) band gap plot for different% F-T NPs.
3.3. Optical Analyses
UV Vis spectrophotometric measurements require analytes to be dissolved in an appropriate solvent; the UV Vis 1800 Shimadzu model requires dissolving 1% of the F-T NPs to a suitable polar solvent for polar compounds and non-polar solvents for nonpolar compounds. The solvent should be pure, optically transparent, chemically inert, and dissolve the sample . F-T TiO2 NPs being a polar compound; polar solvents such as water and ethanol (EtOH) and polar aprotic solvents such as acetonitrile, dimethylformamide (DMF), dimethylsulfoxide (DMSO) are used for this purpose. Distilled water was found not to dissolve, acetonitrile is only transparent in the UV region, and DMF and DMSO are transparent in the UV-Vis range; however, they could have potential interactions with our F-T NPs. Et OH was the preferred solvent due to its purity, wide solubility range, chemical inertness, and optical transparency in the UV-Vis region. However, it is worth noting that not all the NPs dissolved.
The reflectance spectra of F-T NPs were investigated using a UV Vis 1800 Shimadzu model run between 200 and 1100 nm, and the results were used to analyze optical properties, as shown in Figures 6 (a) and (b).
Figure 5 (a) shows that 5%F-T NPs had the least reflectance of 38.31%, translating to the highest transmittance of 61.69% as T = 100- R, where T is% transmittance, and R is % reflectance. 0% F-T NPs had the highest reflectance of 68.24%. The slight insolubility of the F-T NPs caused them to have high values of% light transmitted. The estimated values of % R of the different% F-T NP samples are tabulated in Table 3.
Tauc relation Eq (5) was used to calculate the band gap energy of the synthesized F-T NPs .
 (Ahv)γ=(hv-Eg)(5)
Where Athe absorbance value, hѵ, is the incident photon energy, Eg, band gap energy, and γnature of transition, it takes values such as12 and 2 for indirect allowed and direct allowed transitions, respectively..
Direct optical band gap values were estimated by drawing a tangent of  (A hv)2Tauc’s plot and extrapolating to the x-axis ( (A hv)2= 0) as shown in Figure 5 (b). The bulk band gap of T NPs for the anatase phase is 3.2 eV, the obtained values from the Tauc plot displayed greater optical values that are 4.43, 4.71, 4.52, 4.78, 4.86, 4.41, 4.48, and 4.77 for 0, 1, 2, 3, 5, 7, 9 and 10% F-T NPs respectively. The highest band gap, as tabulated in Table 3, was that of 5% F-T NPs, with an estimated value of an increase of 0.44 from the 0% F-T NPs. The 5% F-T NPs had the highest% transmittance, showing that% Transmittance is directly proportional to the optical band gap. The discrepancies between the bulk and synthesized F-T NPs occur due to quantum confinement effects where electrons are confined in three dimensions, leading to discrete energy levels, surface states, and defects attributed to high surface-to-volume ratio and size-dependent electronic properties where the energy levels of the conduction and valence bands shift influencing the overall band gap.
Table 3. Estimated values of Reflectance edge, % Reflectance, and band gap energy for the different% F-T NPs.

% F-T NPs

Reflectance edge (nm)

% Reflectance

Estimated Band gap energy(Eg),(eV)

0% F-T NPs

335.48

68.24

4.43

1% F-T NPs

325.24

52.75

4.71

2% F-T NPs

327.57

61.12

4.52

3% F-T NPs

328.45

52.59

4.78

5% F-T NPs

325.88

38.31

4.86

7% F-T NPs

320.66

67.58

4.41

9% F-T NPs

325.57

64.42

4.48

10% F-T NPs

324.63

44.24

4.77

3.4. Morphological Analysis
Morphological properties were aided by a Scanning Electron Microscope (SEM). The SEM representative images for 0, 5, and 10% F-T NPs are shown in Figure 6.
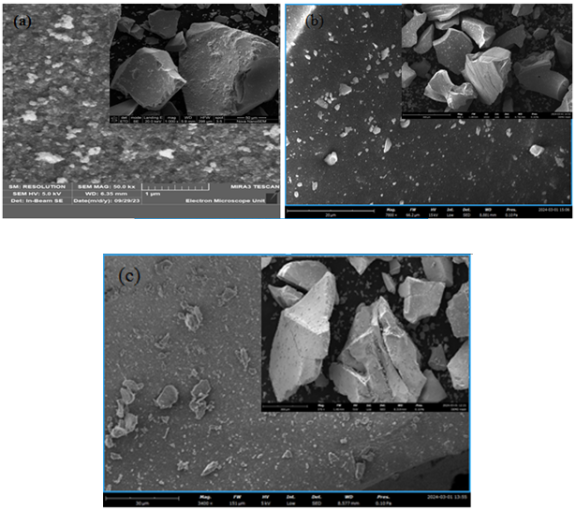
Figure 6. SEM representative images for (a) 0, (b) 5, and (c) 10% F-T NPs.
The 5 and 10% F-T NP images show a dense, smooth particle compared to the 0% F-T NPs. The porosity and rough texture present at 0% F-T NPs are due to nucleation on primary particles of TiO2. The smooth surface and decreased porosity for 5 and 10% F-T NPs lead to a more compact structure resulting from substitution and interstitial doping, as earlier confirmed by XRD and FTIR analysis. The increased particle size and formation of larger crystals for the doped samples result from increased agglomeration and aggregation, which further confirms doping helps improve the morphological properties of TiO2. The coalescing of the particles to form a single unified entity for the F-T NPs samples aligns with the improvement and increased crystallite size shown by XRD analysis.
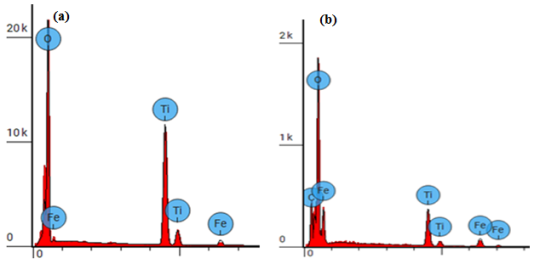
Figure 7. EDS spectra for (a) 5%F-T NPs and (b) 10% F-T NPs.
Table 4. Elemental compositions for 5% F-T NPs.

Element Number

Element Symbol

Element Name

Atomic Conc.

Weight Conc.

8

O

Oxygen

81.865

59.800

22

Ti

Titanium

16.645

36.400

26

Fe

Iron

1.490

3.800

Table 5. Elemental compositions for 10% F-T NPs.

Element Number

Element Symbol

Element Name

Atomic Conc.

Weight Conc.

6

C

Carbon

10.436

4.396

8

O

Oxygen

52.166

29.271

22

Ti

Titanium

24.799

41.658

26

Fe

Iron

12.598

24.675

As shown in Figure 7 (a) and (b) and tabulated in Table 4 and 5; for 5 and 10% F-T NPs, respectively, the Energy-Dispersive X-ray Spectroscopy (EDS) showed the elements present in the F-T NPs: Ti, O, and Fe. The Fe atomic concentration for 10% was higher than that of 5% F-T NPs, which aligns with the different doping concentrations. The carbon present in Figure 7 (b) with an atomic concentration of 10.436 is from the carbon stick used to hold the sample during analysis.
4. Conclusions
The Sol-gel synthesis method successfully prepared F-T NPs. FTIR spectra confirmed the effects of doping concentration with different stretching orientations for interstitial and substitution doping. Due to the mismatch in ionic radius of 0.05 Å, low concentration Fe doping for 1- 3% forms interstitial, and substitution doping occurs at and above 5%. Effects of doping are also shown by XRD spectra where two peaks at planes 105 and 211 for 2θ (53.51° and 54.47°, respectively) merge. Peak 105 and 204 are found to diminish and grow new peaks at 2θ (44.86°, 64.28°), respectively, that increase in intensity as the doping concentration increases. As reported in the literature, the crystallite size was inversely proportional to dislocation density, SSA, FWHM, and strain. The introduction of Fe contributed to an increase in the average strain of the T NPs and a decrease in average crystallite size. For large crystals, 2% F-T NPs are the best, and 7% F-T NPs will be effective where small crystals are preferred. The optical band gap of the synthesized T and F-T NPs was higher than the bulk of 3.2 eV. The highest Eg was for 5% F-T NPs with 4.86 eV.% Transmittance is directly proportional to the optical band gap. The discrepancy in the optical band gap of bulk TiO2 and the synthesized F-T NPs is attributed to quantum confinement effects, surface state, and defects in the F-T NPs. Improved surface texture due to agglomeration and aggregation can also be achieved through doping without annealing TiO2 NPs at high temperature.
Abbreviations

DSSC

Dye Sensitized Solar Cell

EDS

Energy Dispersive Spectroscopy

EtOH

Ethanol

F-T NPs

Fe Doped TiO2 Nanoparticles

FWHM

Full Width at Half Maximum

SEM

Scanning Electron Microscope

SSA

Specific Surface Area

TTIP

Tetra Isopropyl Orthotitanate

UV

Ultra Violet

UV VIS

Ultra Violet Visible Spectroscopy

XRD

X-ray Diffraction

Acknowledgments
The authors thank DSA and Deep Learning Indaba for their financial support through the African AI Research Grant and Murang’a University of Technology for granting access to various synthesis and characterization equipment.
Author Contributions
Simon Waweru Gakuru: Conceptualization, Data curation, Formal Analysis, Investigation, Methodology, Software, Writing – original draft, Writing – review & editing
Sharon Kiprotich: Conceptualization, Formal Analysis, Funding acquisition, Investigation, Methodology, Project administration, Resources, Software, Supervision, Validation, Writing – original draft, Writing – review & editing
Peter Waithaka: Formal Analysis, Funding acquisition, Investigation, Methodology, Resources, Software, Supervision, Validation, Writing – original draft, Writing – review & editing
Conflicts of Interest
The authors declare no conflicts of interest.
References
[1] Abdu Y, Mustafa MK, Ahmad MK. Survey of the Achievement of a ZnO Dye-Synthesized Solar Cell. British Journal of Physics Studies. 2023; 1(1): 27-39.
[2] Javed HM, Adnan M, Qureshi AA, Javed S, Adeel M, Akram MA, Shahid M, Ahmad MI, Afzaal M, Abd-Rabboh HS, Arif M. Morphological, structural, thermal and optical properties of Zn/Mg-doped TiO2 nanostructures for optoelectronic applications. Optics & Laser Technology. 2022 Feb 1; 146: 107566.
[3] Bayan EM, Pustovaya LE, Volkova MG. Recent advances in TiO2-based materials for photocatalytic degradation of antibiotics in aqueous systems. Environmental Technology & Innovation. 2021 Nov 1; 24: 101822.
[4] Awsha AA, Alazoumi SH, Elhub B. A Review of the development of TiO2 photoanode for Solar Applications. Albahit J. Appl. Sci.. 2021 Jul 31; 2(2).
[5] Sun S, Song P, Cui J, Liang S. Amorphous TiO2 nanostructures: synthesis, fundamental properties, and photocatalytic applications. Catalysis Science & Technology. 2019; 9(16): 4198-215.
[6] Tetteh EK, Rathilal S, Asante-Sackey D, Chollom MN. Prospects of synthesized magnetic TiO2-based membranes for wastewater treatment: A review. Materials. 2021 Jun 24; 14(13): 3524.
[7] Meda US, Vora K, Athreya Y, Mandi UA. Titanium dioxide-based heterogeneous and heterojunctionphotocatalysts for pollution control applications in the construction industry. Process Safety and Environmental Protection. 2022 May 1; 161: 771-87.
[8] Mazhar F, Kausar A, Iqbal M. Photocatalytic hydrogen generation using TiO2: a state-of-the-art review. Zeitschriftfür Physikalische Chemie. 2022 Dec 16; 236(11-12): 1697-728.
[9] Apostolov AT, Apostolova IN, Wesselinowa JM. Differences between the multiferroic properties of hexagonal and orthorhombic ion-doped YFeO3 nanoparticles. International Journal of Modern Physics B. 2023 Aug 20; 37(21): 2350201.
[10] Milojković N, Simović B, Žunić M, Dapčević A. Effect of dopants on anatase structure. In28th Conference of the Serbian Crystallographic Society, Čačak, Serbia 2023 (p. 24). Serbian Crystallographic Society, Belgrade, Serbia
[11] Barrocas B, Chiavassa LD, Oliveira MC, Monteiro OC. Impact of Fe, Mn co-doping in titanate nanowires photocatalytic performance for emergent organic pollutants removal. Chemosphere. 2020 Jul 1; 250: 126240.
[12] Paul TC, Babu MH, Podder J, Dev BC, Sen SK, Islam S. Influence of Fe3+ ions doping on TiO2 thin films: Defect generation, dd transition and band gap tuning for optoelectronic device applications. Physica B: Condensed Matter. 2021 Mar 1; 604: 412618.
[13] Ghorbanpour M, Feizi A. Iron-doped TiO2 catalysts with photocatalytic activity. Journal of Water and Environmental Nanotechnology. 2019 Jan 1; 4(1): 60-6.
[14] Valero-Romero MJ, Santa Clara JG, Oar-Arteta L, Van Koppen L, Osadchii DY, Gascon J, Kapteijn F. Photocatalytic properties of TiO2 and Fe-doped TiO2 prepared by metal organic framework-mediated synthesis. Chemical Engineering Journal. 2019 Mar 15; 360: 75-88.
[15] Kanjana N, Maiaugree W, Poolcharuansin P, Laokul P. Synthesis and characterization of Fe-doped TiO2 hollow spheres for dye-sensitized solar cell applications. Materials Science and Engineering: B. 2021 Sep 1; 271: 115311.
[16] Pant B, Park M, Park SJ. Recent advances in TiO2 films prepared by sol-gel methods for photocatalytic degradation of organic pollutants and antibacterial activities. Coatings. 2019 Sep 25; 9(10): 613.
[17] Sun L, Zhai J, Li H, Zhao Y, Yang H, Yu H. Study of homologous elements: Fe, Co, and Ni dopant effects on the photoreactivity of TiO2 nanosheets. ChemCatChem. 2014 Jan; 6(1): 339-47.
[18] Gakuru SW, Kiprotich S, & Waithaka P. (2024). Effects of growth temperature on structural and optical properties of synthesized titanium dioxide nanoparticles. American Journal of Materials Science, 14(1): 12-20.
[19] Mustapha S, Tijani JO, Ndamitso MM, Abdulkareem AS, Shuaib DT, Amigun AT, Abubakar HL. Facile synthesis and characterization of TiO2 nanoparticles: X-ray peak profile analysis using Williamson–Hall and Debye–Scherrer methods. International Nano Letters. 2021 Sep; 11(3): 241-61.
[20] Sivkov A, Vympina Y, Ivashutenko A, Rakhmatullin I, Shanenkova Y, Nikitin D, Shanenkov I. Plasma dynamic synthesis of highly defective fine titanium dioxide with tunable phase composition. Ceramics International. 2022 Apr 15; 48(8): 10862-73.
[21] Maryam R, Arif M, Hussain R, Khan BA, Shah A, Ahmad R, Mahmood A, Shah ZU, Rahman S. Enhanced photocatalytic and antibacterial activity of NiSe2–TiO2 nanocomposites under visible light. Optical Materials. 2023 Sep 1; 143: 114183.
[22] Velumani S, Mathew X, Sebastian PJ, Narayandass SK, Mangalaraj D. Structural and optical properties of hot wall deposited CdSe thin films. Solar energy materials and solar cells. 2003 Mar 31; 76(3): 347-58.
[23] Pratiwi RA, Nandiyanto AB. How to read and interpret UV-VIS spectrophotometric results in determining the structure of chemical compounds. Indonesian Journal of Educational Research and Technology. 2022 Jun; 2(1): 1-20.
[24] Tauc J, editor. Amorphous and liquid semiconductors. Springer Science & Business Media; 2012 Dec 6.
[25] Johannes AZ, Pingak RK, Bukit M. Tauc Plot Software: Calculating energy gap values of organic materials based on Ultraviolet-Visible absorbance spectrum. InIOP conference series: materials science and engineering 2020 Apr 1 (Vol. 823, No. 1, p. 012030). IOP Publishing.
[26] Haryński Ł, Olejnik A, Grochowska K, Siuzdak K. A facile method for Tauc exponent and corresponding electronic transitions determination in semiconductors directly from UlV–Vis spectroscopy data. Optical Materials. 2022 May 1; 127: 112205.
Cite This Article
  • APA Style

    Gakuru, S. W., Kiprotich, S., Waithaka, P. (2024). Structural and Optical Properties of Fe Doped Tio2 Nanoparticles: Investigation of Effects of Different Doping Concentration. Advances in Materials, 13(2), 20-30. https://doi.org/10.11648/j.am.20241302.11

    Copy | Download

    ACS Style

    Gakuru, S. W.; Kiprotich, S.; Waithaka, P. Structural and Optical Properties of Fe Doped Tio2 Nanoparticles: Investigation of Effects of Different Doping Concentration. Adv. Mater. 2024, 13(2), 20-30. doi: 10.11648/j.am.20241302.11

    Copy | Download

    AMA Style

    Gakuru SW, Kiprotich S, Waithaka P. Structural and Optical Properties of Fe Doped Tio2 Nanoparticles: Investigation of Effects of Different Doping Concentration. Adv Mater. 2024;13(2):20-30. doi: 10.11648/j.am.20241302.11

    Copy | Download

  • @article{10.11648/j.am.20241302.11,
      author = {Simon Waweru Gakuru and Sharon Kiprotich and Peter Waithaka},
      title = {Structural and Optical Properties of Fe Doped Tio2 Nanoparticles: Investigation of Effects of Different Doping Concentration
    },
      journal = {Advances in Materials},
      volume = {13},
      number = {2},
      pages = {20-30},
      doi = {10.11648/j.am.20241302.11},
      url = {https://doi.org/10.11648/j.am.20241302.11},
      eprint = {https://article.sciencepublishinggroup.com/pdf/10.11648.j.am.20241302.11},
      abstract = {Fe-doped TiO2 nanoparticles (F-T NPs) were synthesized using the sol-gel method where different molar concentrations (0, 1, 2, 3, 5, 7, 9, and 10%) of Iron (iii) nitrate were added to a constant amount of the metal precursor TetraisopropylOrthotitanate (TTIP) solution, the solvent precursor ethanol and refluxing agent diethanolamine at the ratios of 1:6:1 respectively. The gel formed was annealed at 500°C in a muffle furnace for 2h. Fourier Transform Infrared (FTIR) showed Fe-O symmetrical stretching vibration for the 5% doping and above and Ti-O-Fe asymmetrical stretching vibration at wavenumber 668 cm-1 and 1033cm-1, respectively. Fe-O stretching vibration confirms substitution doping. The crystallite size was calculated using the Debye Scherer equation; 2% F-T NPs had the largest crystallite size at 16.45 nm, and 7% F-T NPs had the least size at 10.95 nm, a decrease of 2.80 nm from the 0% F-T NPs. X-ray diffraction spectra showed a merging of peaks at planes 105 and 211. The peak at plane 204 is found to diminish, and the growth of another peak at 2θ (64.28°). Optical analysis was studied using UV-Vis, where the Tauc plot estimated the calculated band gap (Eg). It was the least at 7% F-T NPs with a value of 4.41 eV, and 5% F-T NPs were found to have the highest value of 4.86 eV.% Transmittance is directly proportional to the optical band gap. Scanning Electron Microscope showed improved agglomeration and aggregation with a dense and smooth particle. Energy Dispersive Spectroscopy confirmed the presence of Fe, Ti, and O in the F-T NPs.
    },
     year = {2024}
    }
    

    Copy | Download

  • TY  - JOUR
    T1  - Structural and Optical Properties of Fe Doped Tio2 Nanoparticles: Investigation of Effects of Different Doping Concentration
    
    AU  - Simon Waweru Gakuru
    AU  - Sharon Kiprotich
    AU  - Peter Waithaka
    Y1  - 2024/05/30
    PY  - 2024
    N1  - https://doi.org/10.11648/j.am.20241302.11
    DO  - 10.11648/j.am.20241302.11
    T2  - Advances in Materials
    JF  - Advances in Materials
    JO  - Advances in Materials
    SP  - 20
    EP  - 30
    PB  - Science Publishing Group
    SN  - 2327-252X
    UR  - https://doi.org/10.11648/j.am.20241302.11
    AB  - Fe-doped TiO2 nanoparticles (F-T NPs) were synthesized using the sol-gel method where different molar concentrations (0, 1, 2, 3, 5, 7, 9, and 10%) of Iron (iii) nitrate were added to a constant amount of the metal precursor TetraisopropylOrthotitanate (TTIP) solution, the solvent precursor ethanol and refluxing agent diethanolamine at the ratios of 1:6:1 respectively. The gel formed was annealed at 500°C in a muffle furnace for 2h. Fourier Transform Infrared (FTIR) showed Fe-O symmetrical stretching vibration for the 5% doping and above and Ti-O-Fe asymmetrical stretching vibration at wavenumber 668 cm-1 and 1033cm-1, respectively. Fe-O stretching vibration confirms substitution doping. The crystallite size was calculated using the Debye Scherer equation; 2% F-T NPs had the largest crystallite size at 16.45 nm, and 7% F-T NPs had the least size at 10.95 nm, a decrease of 2.80 nm from the 0% F-T NPs. X-ray diffraction spectra showed a merging of peaks at planes 105 and 211. The peak at plane 204 is found to diminish, and the growth of another peak at 2θ (64.28°). Optical analysis was studied using UV-Vis, where the Tauc plot estimated the calculated band gap (Eg). It was the least at 7% F-T NPs with a value of 4.41 eV, and 5% F-T NPs were found to have the highest value of 4.86 eV.% Transmittance is directly proportional to the optical band gap. Scanning Electron Microscope showed improved agglomeration and aggregation with a dense and smooth particle. Energy Dispersive Spectroscopy confirmed the presence of Fe, Ti, and O in the F-T NPs.
    
    VL  - 13
    IS  - 2
    ER  - 

    Copy | Download

Author Information