Research Article | | Peer-Reviewed

Bayesian Spatial Modeling of Malaria Incidence in Selected Counties of Western Kenya Using Conditional Autoregressive and Besag-York-Mollie Models

Received: 21 May 2026     Accepted: 1 June 2026     Published: 27 June 2026
Views:       Downloads:
Abstract

The incidence of malaria varies significantly in heterogeneity and overdispersion between areal units resulting in latent spatial dependence and structured variability. Models that assume independence can give biased parameter estimates and underestimated standard errors. The inability to consider correlated residual structures may confound the true relative risk patterns and compromise inferential validity. As a consequence, spatial statistical modeling enables the proper quantification of dependence structures, stabilize risk patterns, and better predictive accuracy. The study proposed the Bayesian hierarchical spatial modeling techniques through Conditional Autoregressive (CAR) and Besag-York-Mollie (BYM) models. Specifically, the research intended to analyze the spatial distribution and clustering of malaria incidence, estimate both the CAR and BYM models with the data and compare the predictive performance of the two models accurately. This study employed secondary data accessed from the Kenya Malaria Indicator Survey and the Demographic Health Survey. Spatial autocorrelation analysis was conducted to identify patterns of malaria incidence. Markov Chain Monte Carlo (MCMC) methods were used to estimate the parameters of the models. The Deviance Information Criterion (DIC) was utilized to compare the two models and determine the better fit. Model diagnostics indicated statistically significant spatial autocorrelation (Moran's I = 0.4462, Z = 2.5566, p < 0.05), confirming rejection of the null hypothesis of spatial independence and establishing a clustered spatial stochastic process. Information-theoretic criteria yielded DIC values of 79.87 (CAR) and 79.81 (BYM), and Watanabe-Akaike Information Criterion (WAIC) values of 78.94 (CAR) and 78.39 (BYM), while predictive assessment produced Log Marginal Predictive Likelihood (LMPL) values of -57.53 (CAR) and -45.19 (BYM), indicating superior posterior predictive performance for the BYM specification. Bayesian hierarchical spatial modeling was recommended for malaria incidence as it improves inferential precision. The study results facilitated the identification of high-risk clusters, thereby providing a statistical basis for evidence-based public health policy formulation.

Published in American Journal of Theoretical and Applied Statistics (Volume 15, Issue 3)
DOI 10.11648/j.ajtas.20261503.13
Page(s) 104-111
Creative Commons

This is an Open Access article, distributed under the terms of the Creative Commons Attribution 4.0 International License (http://creativecommons.org/licenses/by/4.0/), which permits unrestricted use, distribution and reproduction in any medium or format, provided the original work is properly cited.

Copyright

Copyright © The Author(s), 2026. Published by Science Publishing Group

Keywords

Bayesian Hierarchical Modeling, CAR Model, BYM Model, Malaria Incidence, Spatial Autocorrelation

1. Introduction
Globally, there was an increase of malaria cases from 245 million in 2020 to 247 million in 2021 . Most of the increase comes from the countries in the WHO African region. Research shows that Africa bears the high frequency of malaria with 215 million cases of malaria and 384,000 malaria deaths in 2019 . In Kenya, transmission patterns across distinct geographical locations are highly diverse due to ecological, climatic, and socioeconomic variation . According to the national estimates the prevalence of malaria in Kenya is 6% and the Western Kenya has historically recorded significantly higher prevalence averages with over 20% in the Lake Victoria basin . The identification of malaria patterns is a strategy that can be employed to develop appropriate interventions. It is best accomplished by use of spatial modeling.
The spatial modeling of malaria risk provides a quantitative model for identifying the hotspots of malaria transmission. It understands that correlated disease outcomes observed in the adjacent areas are usually related through shared sociodemographic, and ecological factors . Existing statistical models have yielded useful information, but they usually do not account for spatial dependence, that is, the tendency of geographically neighboring regions to exhibit similar disease trends. In a Bayesian hierarchical model, spatial modeling uses a likelihood with prior distributions which encode spatial structure, to yield posterior distributions which measure uncertainty in disease risk forecasts . The strategy is applicable to the malaria incidence where the geographic distribution is involved in the form of nearness to Lake Victoria .
Disease mapping is a specific form of spatial modeling that tries to estimate and visualize geographic variability in disease risk across administrative units. The overall aim is to produce the smoothed representations of relative risk that reduce the instability of small population sizes and preserve substantial spatial patterns . Hierarchical models in the Bayesian mapping of disease help in separating structured spatial variation and unstructured heterogeneity. The models utilize the power of their neighbors to stabilize the risk surfaces over which hotspots are detected and evidence-based health planning achieved using adjacency matrices. According to , disease mapping also help in formulating more precise intervention plans by depicting the amount of uncertainty surrounding estimates.
Standard Poisson regression is a model that is employed to model count data, in which the number of times a particular unit occurs is seen to follow a Poisson distribution. It is suitable in the modeling of incidence counts but assumes independence between spatial units. Spatial clustering often violate this assumption because of environmental and ecological resemblance between areas that are near to each other . Moreover, lack of consideration of spatial autocorrelation can give biased estimates of parameters, underestimation of standard errors and misleading inference. Negative binomial regression and logistic regression models also assume independence and lack explicit structuring of spatial random effects.
Bayesian hierarchical models offer a coherent probabilistic model to account for spatially organized disease data and breaks down variability into three levels. The first level commonly assumes a Poisson distribution. The second level links the log-relative risk to covariates and spatial random effects. At the third level, prior distributions are assigned to regression coefficients and spatial parameters. The posterior distribution is then obtained through Bayes' theorem. This version can propagate the uncertainty in the parameters with posterior distributions and therefore bring more credible inference in the frequentist models . Bayesian hierarchical models mitigate statistical challenges of spatial autocorrelation, small-area instability, and spatial confounding .
Conditional Autoregressive (CAR) model is a form of spatial prior specification, used to model the spatial autocorrelation using a neighborhood structure. The CAR model expresses each localized effect as the average of its neighboring effects, resulting in a Gaussian Markov Random Field (GMRF) with a sparse precision matrix . The structure causes local smoothing of the estimates by shrinking them to the mean of nearby regions, therefore stabilizing estimates in areas with sparse counts. CAR model shows greater benefits in the context of areal disease mapping as it can address the first-order spatial dependence and it retains computational efficiency .
The Besag-York-Mollie (BYM) model considers both spatially structured and unstructured random effects. According to , BYM model splits the leftover variation into a structured component which measures the spatial autocorrelation and an exchangeable component which measures the area-specific heterogeneity. Its structured component is modeled with a CAR prior and the unstructured component is an independent Gaussian process, which makes it possible to separate latent spatial processes and random variation in the model. This decomposition plays a very important role in disease mapping since it avoids a confounding factor of both spatial dependence and overdispersion .
The high prevalence of malaria in the Lake endemic region is still disproportionately high despite widespread control measures. Inadequate application of robust spatial modeling techniques continues to limit accurate identification and targeting of high-risk clusters. This study fitted Conditional Autoregressive (CAR) and Besag-York-Mollie (BYM) models in depicting spatial dependency, and quantifying uncertainties. The two models were compared to determine the one that had a better fit. The specific objectives were: (1) to examine the spatial distribution and clustering patterns of malaria incidence in selected counties of Western Kenya; (2) to fit CAR and BYM models for estimating malaria incidence; (3) to compare the predictive performance of the CAR and BYM models.
2. Materials and Methods
2.1. Study Area
The study was done in Western Kenya which is a malaria endemic region with significant ecological and climatic changes. It includes eight counties: Kisumu, Siaya, Homa Bay, Migori, Kakamega, Bungoma, Busia, and Vihiga, which have reported high levels of malaria burden compared to any other parts of the nation. According to Kenya National Bureau of Statistics (2019), the population of the counties was Kisumu (1,155,574), Siaya (993,183), Homa Bay (1,131,950), Migori (1,116,436), Kakamega (1,870,766), Bungoma (1,670,570), Busia (893,681), and Vihiga (590,013). Western Kenya lies within the Lake Victoria basin where variations in altitude, rainfall, temperature, land use, and proximity to water bodies create heterogeneous transmission environments.
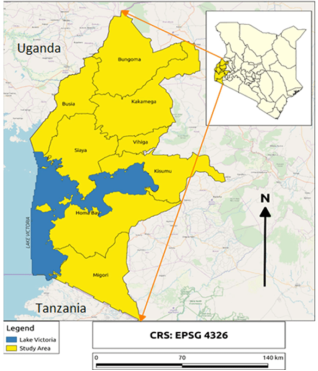
Figure 1. A Map showing the Study Areas.
2.2. Data Collection
The data for this study was obtained from the 2015 and 2020 Kenya Malaria Indicator Survey (KMIS), including the 2022 Demographic and Health Survey (DHS) Program. The study used secondary data that was extracted from the chosen counties. To accomplish spatial modeling, two variables were used, namely the number of cases of malaria, and the spatial component (geographical positioning). The dependent variable was the number of reported malaria cases aggregated at the county level, representing the outcome of interest in the spatial analysis. The independent variable was the spatial component which was measured using geographic identifiers and administrative boundary units which captures the location of every observation.
2.3. Spatial Autocorrelation Analysis
To examine the spatial distribution and clustering patterns of malaria incidence, spatial autocorrelation techniques were integrated to quantify geographic dependence in the observed incidence rates. The Global Moran's I statistic was calculated to identify the existence of spatial clustering . The statistic is given by:
I=(n/S0)*[sum_ijw_ij(x_i-x_bar)(x_j-x_bar)]/[sum_i(x_i-x_bar)^2]
where n is the number of counties, x_i and x_j are the observed malaria case counts, w_ij are elements of the adjacency matrix, and S_0 = sum_i sum_j w_ij. Values of Moran's I range from -1 to +1: positive values indicate clustering of similar values, negative values indicate dispersion, and values near zero suggest randomness. Local Moran's I (LISA) statistics were also computed to detect specific spatial clusters and outliers.
2.4. Statistical Models
2.4.1. Conditional Autoregressive (CAR) Model
Let Y_i denote the observed number of malaria cases in county i and E_i the expected number of cases based on population size. The outcome variable followed a Poisson distribution:
Y_i~Poisson(E_i*theta_i)
where theta_i represents the relative risk of malaria in county i. The log-relative risk was modeled as:
log(theta_i)=alpha+u_i,i=1,2,.,n
where alpha denotes the overall log-relative risk and u_i represents the spatially structured random effect capturing correlated heterogeneity between neighboring counties. The CAR prior defines the conditional distribution of u_i given the neighboring effects u_{-i} as:
u_i|u_{-i},tau_u~N(u_bar_i,1/(tau_u*n_i))
where u_bar_i = (sum_j w_ij * u_j) / (sum_j w_ij), w_ij are elements of the adjacency matrix, n_i is the number of neighbors, and tau_u is the precision parameter.
2.4.2. Besag-york-mollie (BYM) Model
The BYM model extends the CAR framework by including both spatially structured and unstructured random effects:
log(theta_i)=alpha+u_i+v_i
where u_i represents the spatially structured random effect following an intrinsic CAR prior, and v_i represents the unstructured random effect capturing independent area-specific heterogeneity: v_i ~ N(0, tau_v^{-1}). The total residual spatial effect is phi_i = u_i + v_i.
2.5. Model Comparison Metrics
The Deviance Information Criterion (DIC) was calculated as DIC = D_bar + p_D, where D_bar is the posterior mean deviance and p_D is the effective number of parameters. The Watanabe-Akaike Information Criterion (WAIC) was computed as:
WAIC=-2[sum_ilog(E_theta[p(y_i|theta)])-sum_iVar_theta[logp(y_i|theta)]]
The Log Marginal Predictive Likelihood (LMPL) was obtained by leave-one-out cross-validation using the Conditional Predictive Ordinate (CPO):
LMPL=sum_ilog(CPO_i)
2.6. Parameter Estimation
Both models were fitted using Markov Chain Monte Carlo (MCMC) simulation via the CARBayes package in R. 100,000 iterations were completed, which included a burn-in period of 20,000 and thinning of 10, giving 8,000 posterior samples. Convergence was evaluated through acceptance rates and trace plots.
3. Results
3.1. Descriptive Statistics and Spatial Distribution
Table 1 presents the number of malaria cases and population for the selected counties. The highest count of malaria was realized in Bungoma (604) followed by Busia (535) and Kakamega (506). Vihiga recorded the least cases of malaria (284).
Table 1. Malaria Cases and Population by County.

County

Total Cases

Population

Busia

535

893,681

Bungoma

604

1,670,570

Homabay

413

1,131,950

Kakamega

506

1,867,579

Kisumu

380

1,155,574

Migori

479

1,116,436

Siaya

476

993,183

Vihiga

284

590,013

Table 2 shows the prevalence rates per county. The highest prevalence of malaria was recorded in Busia County (0.5986), followed by Vihiga (0.4813) and Siaya (0.4793). Kakamega County had the lowest prevalence value (0.2709).
Table 2. Malaria Prevalence by County.

County

Total Cases

Population

Prevalence

Busia

535

893,681

0.5986

Bungoma

604

1,670,570

0.3616

Homabay

413

1,131,950

0.3649

Kakamega

506

1,867,579

0.2709

Kisumu

380

1,155,574

0.3288

Migori

479

1,116,436

0.4290

Siaya

476

993,183

0.4793

Vihiga

284

590,013

0.4813

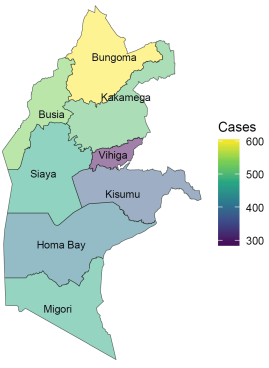
Figure 2. A Mapping of Malaria Cases.
3.2. Spatial Autocorrelation Results
The Global Moran's I analysis revealed statistically significant spatial autocorrelation. Table 3 presents the Moran's I statistics.
Table 3. Moran's I Statistics for Spatial Autocorrelation.

Statistic

Value

Moran's I

0.4462

Expected Moran's I

-0.1428

Variance

0.05309

Z-score

2.5566

p-value

0.005244

The observed Moran's I value of 0.4462 is substantially higher than the expected value of -0.1428 under spatial randomness. The Z-score of 2.5566 and p-value of 0.005244 indicate that the spatial clustering is statistically significant at the 5% significance level. Thus, the null hypothesis of spatial randomness was rejected, confirming significant positive spatial autocorrelation.
Table 4. Local Moran's I Statistics by County.

Ii

E (Ii)

Var (Ii)

Z (Ii)

p-value

0.593548

-0.03579

0.115025

1.855607

0.06351

0.421142

-0.34686

0.402754

1.210164

0.226216

0.749268

-0.51327

0.444131

1.894478

0.058162

0.358887

-0.09454

0.085605

1.549751

0.121201

-0.12899

-0.00446

0.007897

-1.40132

0.16112

1.628954

-0.10551

0.754991

1.996151

0.045918

-0.08676

-0.03618

0.018596

-0.37097

0.710661

0.033948

-0.00625

0.011036

0.382613

0.702007

3.3. Fitted CAR and BYM Models
A binary adjacency matrix W of dimension 8 x 8 was constructed using queen contiguity. The posterior mean relative risks (RR) and 95% credible intervals for both models are given in Table 5.
Table 5. Observed cases, expected cases, SIR, and posterior mean relative risks (RR) with 95% credible intervals for CAR and BYM models.

County

Y

E

SIR

CAR RR (95% CrI)

BYM RR (95% CrI)

Busia

535

348.9

1.5335

1.509 (1.380, 1.647)

1.510 (1.284, 1.737)

Bungoma

604

652.2

0.9262

0.929 (0.855, 1.007)

0.929 (0.790, 1.069)

Homabay

413

441.9

0.9346

0.939 (0.852, 1.028)

0.938 (0.798, 1.079)

Kakamega

506

729.1

0.6940

0.707 (0.645, 0.772)

0.705 (0.599, 0.811)

Kisumu

380

451.1

0.8424

0.853 (0.771, 0.936)

0.851 (0.724, 0.979)

Migori

479

435.8

1.0990

1.096 (1.001, 1.197)

1.095 (0.931, 1.259)

Siaya

476

387.7

1.2277

1.220 (1.113, 1.332)

1.219 (1.036, 1.402)

Vihiga

284

230.3

1.2330

1.210 (1.079, 1.349)

1.214 (1.032, 1.396)

Busia exhibited the highest RR (1.509, 95% CrI: 1.380, 1.647 in CAR; 1.510, 95% CrI: 1.284, 1.737 in BYM), followed by Siaya and Vihiga. Kakamega had the lowest RR (0.707 in CAR; 0.705 in BYM). The credible intervals for Bungoma, Homabay, Kisumu and Migori all included 1, indicating that their risk is not significantly different from the regional average after accounting for spatial dependence.
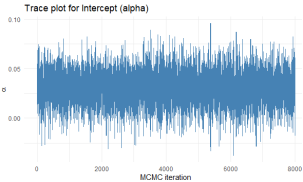
Figure 3. Trace Plot for Intercept - CAR Model.
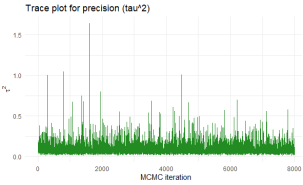
Figure 4. Trace Plot for Precision - CAR Model.
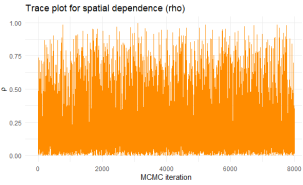
Figure 5. Trace Plot for Spatial Dependence - CAR Model.
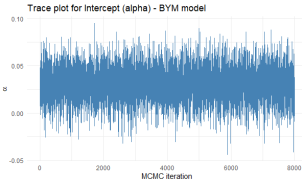
Figure 6. Trace Plot for Intercept - BYM Model.
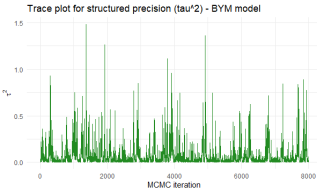
Figure 7. Trace Plot for Structured Precision - BYM Model.
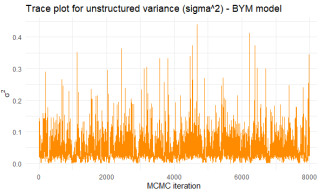
Figure 8. Trace Plot for Unstructured Variance - BYM Model.
The posterior mean proportion of total residual variance attributable to the spatially structured component was 0.998, with a 95% credible interval from 0.993 to 1.000, indicating that over 99% of the extra-Poisson variation is spatially structured, with negligible unstructured heterogeneity.
3.4. Model Comparison
Table 6 presents the model comparison criteria.
Table 6. Model Comparison Criteria.

Model

DIC

WAIC

LMPL

CAR

79.87

78.94

-57.53

BYM

79.81

78.39

-45.19

The BYM model produced a slightly lower DIC (79.81 vs 79.87), lower WAIC (78.39 vs 78.94), and a substantially higher LMPL (-45.19 vs -57.53). The difference in LMPL of 12.34 indicates that the BYM model has markedly superior out-of-sample predictive performance.
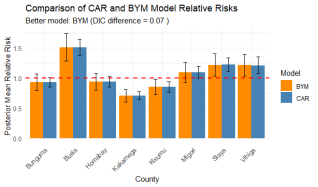
Figure 9. Comparison of CAR and BYM Model Relative Risks.
4. Discussion
The statistically significant Global Moran's I value of 0.4462 (Z = 2.5566, p < 0.05) confirmed the presence of significant positive spatial autocorrelation in malaria incidence, consistent with previous spatial epidemiological studies . This finding invalidates the assumption of spatial independence inherent in conventional regression frameworks and justifies the incorporation of spatial random effects.
Both the CAR and BYM models produced nearly identical posterior mean relative risk estimates, with a Pearson correlation coefficient of 1.000. However, the BYM model demonstrated improved variance decomposition through the inclusion of an unstructured heterogeneity component. The posterior mean proportion of variance attributable to spatial structure was 0.998, indicating that the overwhelming majority of residual variation is spatially structured. Nevertheless, the BYM model's ability to capture both structured and unstructured components resulted in wider credible intervals and enhanced uncertainty quantification .
The model comparison criteria consistently favored the BYM model. The DIC difference of 0.07, the WAIC difference of 0.55 and the substantial LMPL difference of 12.34 indicated superior predictive performance for the BYM specification. These findings align with , who demonstrated that the BYM model provides more intuitive variance decomposition and better uncertainty quantification. also found the BYM model effective in estimating and mapping tuberculosis relative risk.
5. Conclusion
The statistical analysis consistently demonstrated the presence of significant spatial dependence in malaria incidence. The significant Global Moran's I and LISA statistics confirmed that the spatial distribution of malaria incidence was characterized by clustering and heterogeneity. Busia, Siaya, and Vihiga counties were identified as high-risk areas with relative risks significantly greater than 1.
Based on the totality of the evidence including lower DIC, lower WAIC, substantially higher LMPL, and variance decomposition indicating a small but significant unstructured component, the Besag-York-Mollie model is the better model for estimating malaria incidence. The BYM model's ability to separate structured and unstructured variation provides more honest uncertainty quantification and superior predictive performance.
Abbreviations

BYM

Besag-york-mollie

CAR

Conditional Autoregressive

DIC

Deviance Information Criterion

DHS

Demographic Health Survey

GMRF

Gaussian Markov Random Field

KMIS

Kenya Malaria Indicator Survey

LISA

Local Moran’s I

LMPL

Log Marginal Predictive Likelihood

MCMC

Markov Chain Monte Carlo

RR

Relative Risks

WAIC

Watanabe Akaike Information Criterion

Acknowledgments
It is with a great sense of gratitude that I would like to express utmost words of appreciation to my super supervisors Dr. Kilai Mutua and Dr. Peter Kinyua Gachoki. Their excellent guidance, and invaluable eort has been instrumental. They never stopped pushing me with their constructive criticisms, and outstanding mentorship which made me pursue excellence. Every step of this work has given me an encouragement. I am deeply thankful to them. I also wish to give my sincere appreciation to my friend Gideon Kipngetich due to his uncompromised support during this journey. I am really thankful to everyone who contributed to my success.
Author Contributions
Norman Kibet: Conceptualization, Investigation, Methodology, Project administration, Writing – original draft, Writing – review & editing
Kilai Mutua: Data curation, Software, Supervision
Peter Kinyua Gachoki: Formal Analysis, Resources, Supervision, Validation
Conflicts of Interest
The authors declare no conflicts of interest.
References
[1] World Health Organization. (2022). World malaria report 2022. World Health Organization.
[2] Odhiambo, F. O., O'Meara, W. P., Abade, A., Owiny, M., Odhiambo, F., & Oyugi, E. O. (2023). Adherence to national malaria treatment guidelines in private drug outlets: a cross-sectional survey in the malaria-endemic Kisumu County, Kenya. Malaria Journal, 22(1), 307.
[3] Alegana, V. A., Macharia, P. M., Muchiri, S., Mumo, E., Oyugi, E., Kamau, A., & Snow, R. W. (2021). Plasmodium falciparum parasite prevalence in Kenya: a study of three malaria indicator surveys. Wellcome Open Research, 6.
[4] Wang, Y., Chen, X., & Xue, F. (2024). A review of Bayesian spatiotemporal models in spatial epidemiology. ISPRS International Journal of Geo-Information, 13(3), 97.
[5] Mahama, T. (2022). Bayesian hierarchical modeling for small-area estimation of disease burden. International Journal of Science and Research Archive, 7(2), 807-827.
[6] Lawson, A. B. (2018). Bayesian disease mapping: hierarchical modeling in spatial epidemiology. CRC Press.
[7] Odhiambo, J. N., Kalinda, C., Macharia, P. M., Snow, R. W., & Sartorius, B. (2020). Spatial and spatio-temporal methods for mapping malaria risk: a systematic review. BMJ Global Health, 5(10), e002919.
[8] Khagayi, S., Desai, M., Amek, N., Were, V., Obor, D., Munga, S., & Laserson, K. F. (2017). Spatial analysis of malaria prevalence in the Lake Victoria basin, Kenya. PLoS ONE, 12(10), e0186260.
[9] Samat, N. A., & Mey, L. W. (2017). Malaria disease mapping in Malaysia based on Besag-York-Mollie (BYM) model. Journal of Physics: Conference Series, 890(1), 012167.
[10] Morales-Otero, M., & Nunez-Anton, V. (2021). Comparing Bayesian spatial conditional overdispersion and the Besag-York-Mollie models: application to infant mortality rates. Mathematics, 9(3), 282.
[11] Chen, Y. (2023). An analytical process of spatial autocorrelation functions based on Moran's I. Mathematical Geosciences, 55(3), 315-339.
[12] Nigussie, T. Z., Zewotir, T. T., & Muluneh, E. K. (2022). Detection of temporal, spatial and spatiotemporal clustering of malaria incidence in northwest Ethiopia, 2012-2020. Scientific Reports, 12(1), 3635.
[13] Habtewold, F. G., & Arero, B. G. (2025). Modeling and mapping under-nutrition among under-five children in Ethiopia: a Bayesian spatial analysis. Frontiers in Public Health, 13, 1553908.
[14] Riebler, A., Sorbye, S. H., Simpson, D., & Rue, H. (2016). An intuitive Bayesian spatial model for disease mapping that accounts for scaling. Statistical Methods in Medical Research, 25(4), 1145-1165.
[15] Sasmita, N. R., Arifin, M., Kesuma, Z. M., Rahayu, L., Mardalena, S., & Kruba, R. (2024). Spatial estimation for tuberculosis relative risk in each province, Indonesia: A Bayesian conditional autoregressive approach with the Besag-York-Mollie (BYM) model. Journal of Applied Data Sciences, 5(2), 342-356.
Cite This Article
  • APA Style

    Kibet, N., Mutua, K., Gachoki, P. K. (2026). Bayesian Spatial Modeling of Malaria Incidence in Selected Counties of Western Kenya Using Conditional Autoregressive and Besag-York-Mollie Models. American Journal of Theoretical and Applied Statistics, 15(3), 104-111. https://doi.org/10.11648/j.ajtas.20261503.13

    Copy | Download

    ACS Style

    Kibet, N.; Mutua, K.; Gachoki, P. K. Bayesian Spatial Modeling of Malaria Incidence in Selected Counties of Western Kenya Using Conditional Autoregressive and Besag-York-Mollie Models. Am. J. Theor. Appl. Stat. 2026, 15(3), 104-111. doi: 10.11648/j.ajtas.20261503.13

    Copy | Download

    AMA Style

    Kibet N, Mutua K, Gachoki PK. Bayesian Spatial Modeling of Malaria Incidence in Selected Counties of Western Kenya Using Conditional Autoregressive and Besag-York-Mollie Models. Am J Theor Appl Stat. 2026;15(3):104-111. doi: 10.11648/j.ajtas.20261503.13

    Copy | Download

  • @article{10.11648/j.ajtas.20261503.13,
      author = {Norman Kibet and Kilai Mutua and Peter Kinyua Gachoki},
      title = {Bayesian Spatial Modeling of Malaria Incidence in Selected Counties of Western Kenya Using Conditional Autoregressive and Besag-York-Mollie Models},
      journal = {American Journal of Theoretical and Applied Statistics},
      volume = {15},
      number = {3},
      pages = {104-111},
      doi = {10.11648/j.ajtas.20261503.13},
      url = {https://doi.org/10.11648/j.ajtas.20261503.13},
      eprint = {https://article.sciencepublishinggroup.com/pdf/10.11648.j.ajtas.20261503.13},
      abstract = {The incidence of malaria varies significantly in heterogeneity and overdispersion between areal units resulting in latent spatial dependence and structured variability. Models that assume independence can give biased parameter estimates and underestimated standard errors. The inability to consider correlated residual structures may confound the true relative risk patterns and compromise inferential validity. As a consequence, spatial statistical modeling enables the proper quantification of dependence structures, stabilize risk patterns, and better predictive accuracy. The study proposed the Bayesian hierarchical spatial modeling techniques through Conditional Autoregressive (CAR) and Besag-York-Mollie (BYM) models. Specifically, the research intended to analyze the spatial distribution and clustering of malaria incidence, estimate both the CAR and BYM models with the data and compare the predictive performance of the two models accurately. This study employed secondary data accessed from the Kenya Malaria Indicator Survey and the Demographic Health Survey. Spatial autocorrelation analysis was conducted to identify patterns of malaria incidence. Markov Chain Monte Carlo (MCMC) methods were used to estimate the parameters of the models. The Deviance Information Criterion (DIC) was utilized to compare the two models and determine the better fit. Model diagnostics indicated statistically significant spatial autocorrelation (Moran's I = 0.4462, Z = 2.5566, p < 0.05), confirming rejection of the null hypothesis of spatial independence and establishing a clustered spatial stochastic process. Information-theoretic criteria yielded DIC values of 79.87 (CAR) and 79.81 (BYM), and Watanabe-Akaike Information Criterion (WAIC) values of 78.94 (CAR) and 78.39 (BYM), while predictive assessment produced Log Marginal Predictive Likelihood (LMPL) values of -57.53 (CAR) and -45.19 (BYM), indicating superior posterior predictive performance for the BYM specification. Bayesian hierarchical spatial modeling was recommended for malaria incidence as it improves inferential precision. The study results facilitated the identification of high-risk clusters, thereby providing a statistical basis for evidence-based public health policy formulation.},
     year = {2026}
    }
    

    Copy | Download

  • TY  - JOUR
    T1  - Bayesian Spatial Modeling of Malaria Incidence in Selected Counties of Western Kenya Using Conditional Autoregressive and Besag-York-Mollie Models
    AU  - Norman Kibet
    AU  - Kilai Mutua
    AU  - Peter Kinyua Gachoki
    Y1  - 2026/06/27
    PY  - 2026
    N1  - https://doi.org/10.11648/j.ajtas.20261503.13
    DO  - 10.11648/j.ajtas.20261503.13
    T2  - American Journal of Theoretical and Applied Statistics
    JF  - American Journal of Theoretical and Applied Statistics
    JO  - American Journal of Theoretical and Applied Statistics
    SP  - 104
    EP  - 111
    PB  - Science Publishing Group
    SN  - 2326-9006
    UR  - https://doi.org/10.11648/j.ajtas.20261503.13
    AB  - The incidence of malaria varies significantly in heterogeneity and overdispersion between areal units resulting in latent spatial dependence and structured variability. Models that assume independence can give biased parameter estimates and underestimated standard errors. The inability to consider correlated residual structures may confound the true relative risk patterns and compromise inferential validity. As a consequence, spatial statistical modeling enables the proper quantification of dependence structures, stabilize risk patterns, and better predictive accuracy. The study proposed the Bayesian hierarchical spatial modeling techniques through Conditional Autoregressive (CAR) and Besag-York-Mollie (BYM) models. Specifically, the research intended to analyze the spatial distribution and clustering of malaria incidence, estimate both the CAR and BYM models with the data and compare the predictive performance of the two models accurately. This study employed secondary data accessed from the Kenya Malaria Indicator Survey and the Demographic Health Survey. Spatial autocorrelation analysis was conducted to identify patterns of malaria incidence. Markov Chain Monte Carlo (MCMC) methods were used to estimate the parameters of the models. The Deviance Information Criterion (DIC) was utilized to compare the two models and determine the better fit. Model diagnostics indicated statistically significant spatial autocorrelation (Moran's I = 0.4462, Z = 2.5566, p < 0.05), confirming rejection of the null hypothesis of spatial independence and establishing a clustered spatial stochastic process. Information-theoretic criteria yielded DIC values of 79.87 (CAR) and 79.81 (BYM), and Watanabe-Akaike Information Criterion (WAIC) values of 78.94 (CAR) and 78.39 (BYM), while predictive assessment produced Log Marginal Predictive Likelihood (LMPL) values of -57.53 (CAR) and -45.19 (BYM), indicating superior posterior predictive performance for the BYM specification. Bayesian hierarchical spatial modeling was recommended for malaria incidence as it improves inferential precision. The study results facilitated the identification of high-risk clusters, thereby providing a statistical basis for evidence-based public health policy formulation.
    VL  - 15
    IS  - 3
    ER  - 

    Copy | Download

Author Information
  • Abstract
  • Keywords
  • Document Sections

    1. 1. Introduction
    2. 2. Materials and Methods
    3. 3. Results
    4. 4. Discussion
    5. 5. Conclusion
    Show Full Outline
  • Abbreviations
  • Acknowledgments
  • Author Contributions
  • Conflicts of Interest
  • References
  • Cite This Article
  • Author Information