Abstract
This study investigates the broad economic, behavioral, and psychological impacts of rising fuel prices on urban residents in Vadodara, India. Primary data was collected from two key areas Fatehgunj and Tarsali using structured questionnaires to capture citizens’ responses to the ongoing increase in fuel costs. The study had multiple objectives: to evaluate the direct consequences of rising fuel prices on household expenditure, assess the readiness of people to adopt alternative transportation methods, analyze fuel spending across different age groups and income levels, and understand how individuals are adjusting to manage this financial pressure. Furthermore, the study explores the impact of fuel inflation on mental health and seeks citizens’ suggestions on how this issue might be addressed. An additional comparative objective was introduced to examine whether similar fuel pricing challenges are experienced in another developing country, specifically Kenya. A range of statistical tools were employed for data processing and analysis, including SPSS, R, Python, Microsoft Excel, and Power BI. These tools were used to conduct descriptive and inferential analysis, create data visualizations, and draw correlations between demographic variables and spending behaviors. The results reveal a significant shift in travel habits, increased financial stress among middle- and lower-income households, and growing public concern about long-term affordability. Many respondents reported cutting back on non-essential expenses, while others expressed willingness to switch to fuel-efficient vehicles or public transportation. These findings provide valuable insights for policymakers, economists, and urban planners aiming to develop effective strategies to ease the burden of rising fuel prices on the general public.
Keywords
Prices, Fuel, Citizens, Cost
1. Introduction
The ongoing rise in fuel prices has placed a significant burden on nearly every segment of society across the nation, making it increasingly difficult for individuals to manage their household budgets. Petrol is now being sold at over Rs 100 per litre throughout the country, while diesel prices have also reached historically high levels. Between March 22 and April 6, petrol and diesel prices increased by Rs 10 per litre marking the steepest hike over a 16-day period since fuel prices were deregulated two decades ago
| [7] | BTS/EIA (2022). “Record Breaking Increases in Motor Fuel Prices in 2022.”Documents a 49% rise in regular gasoline prices and 55% in diesel from Jan-June 2022 bts.gov |
[7]
. This sharp escalation in fuel costs poses a direct challenge to the country’s economic growth and future development plans. Indirectly, it drives up the cost of essential goods and services such as food items and public transport, affecting consumers on a daily basis
| [5] | EIA (2023, Apr). “STEO Perspectives: How do Household Gasoline Costs Change When Oil Prices Vary?”Projects lower average 2023 household spending ($2,780) amid changing crude price scenarios eia.gov |
| [2] | Financial Health Network (2022, Dec 1). “Financial Health Pulse: Gas Price Increases and Consumption Behavior.”Reports that financially vulnerable consumers split fuel purchases into smaller, more frequent transactions amid price hikes finhealthnetwork.org |
[5, 2]
. For private vehicle owners, the increased fuel expenses have made travel more costly, prompting them to adopt more frugal and cautious spending habits to cope with the financial pressure
| [1] | Gelman, M. et al. (2023). “The Response of Consumer Spending to Changes in Gasoline Prices.” American Economic Journal: Macroeconomics, 15(2), 129-160. This paper uses high-frequency transaction data to estimate that consumer spending is highly responsive to fuel price changes, showing large aggregate effects arxiv.org, aeaweb.org |
| [3] | UpSide (2023). “Consumer Behavior at the Pump This Summer.”Finds a 5.7% rise in consumers “shopping around” when prices are elevated, with 2.2% more transactions per 1% sign price increase upside.com |
[1, 3]
. As a result, people have started reducing their overall expenditures. Many private vehicle users have been compelled to reconsider their travel choices some opting to switch from cars to motorcycles or rely more on public transportation to manage their budgets more efficiently
| [6] | ScienceDirect (2023). “The effect of record-high gasoline prices on consumers' new vehicle purchase intention.”Quantitative study linking fuel price increases to shifts in vehicle-buying decisions, controlling for demographics sciencedirect.com |
| [4] | Yodlee (2024). “Pumped Up or Pared Down? Unpacking America’s Gasoline Spending Trends.”Through transaction data (2021-2024), this analysis reveals income-based disparities in fuel spending and shifting consumer behavior yodlee.com |
[6, 4]
. Recent studies show that global crude oil prices have climbed to their highest levels in nearly ten years, largely due to the conflict between Russia and Ukraine, which threatens to disrupt global oil supply
| [8] | Global Energy Crisis Wikipedia (2023). “Global energy crisis (2021-2023).”Highlights statistical links between price spikes and increased household poverty in Europe—estimating 11 million more at risk in 2022 en.wikipedia.org, yodlee.com |
[8]
. Experts had already anticipated a fuel price surge following the final phase of election polling. An increase in oil and gas prices generally leads to a higher consumer price index for petroleum products, impacting households directly. For producers, rising input and operational costs are often passed on to consumers in the form of more expensive goods and services
| [10] | Clemson News (2025). “The hidden impact of data on gas prices.”Analyses consumer behavioral shifts during rising prices and how price transparency changes station pricing strategies news.clemson.edu |
[10]
. This has a ripple effect on the wider economy, increasing production costs and, consequently, the final cost of goods. For households, rising domestic fuel prices affect real income both directly through higher costs for fuel and indirectly through inflated prices on goods and services that rely on petroleum in their production or delivery processes
| [9] | Household Energy Insecurity Wikipedia (2025). “Energy insecurity and the ‘heat or eat’ dilemma.”Covers 2022-23 findings on how rising energy prices force trade-offs in low-income households en.wikipedia.org |
[9]
.
2. Objectives
To determine consequences of rising fuel prices on citizens.
To check whether people are ready to opt for an alternative method?
To identify, by age group and monthly income, how much people spend on fuel each month.
To identify how will people overcome this situation.
To know how much the rising fuel prices affecting people’s monthly expenditure.
To gather public opinion on potential solutions to this problem.
To determine whether there is a link between in rising fuel prices and people’s mental health.
To determine whether India and Kenya face similar challenges related to fuel pricing.
3. Pilot Study
For more sample size determination I conducted pilot study.
Question for pilot study;
How much people are concerned with rising fuel prices? (45 responses)
After calculating the responses of above questions and I got values of P=0.83 and q-0.17
Sample Size Determination
N=Population of Fatehgunj and Tarsali (as per 2011 census).
p=proportion of people who are concerning and facing impacts of rising fuel prices = 0.83.
q= proportion of people who are not concerning and facing impacts of rising fuel prices = 0.17.
∈ = margin of error = 0.05.
= critical value of the normal distribution at required confidence level = 1.96.
By substituting all these values in the above formula, the sample size obtained is; n=313.
4. Sampling Techniques
Stratified sampling: Divided the population in 2 areas: Fatehgunj and Tarsali.
Using proportional Allocation; 95 samples has been collected from Fatehgunj and 218 samples have been collected from Tarsali.
5. Data Collection
Data collected from the primary source i.e. from two areas - Fatehgunj and Tarsali, also I collected some data from google form and some from hard copies of the questionnaire.
6. Data Visualization
Some factors of the data have been visualized using Power BI. Microsoft Power BI is a powerful data visualization tool and a very popular one. It is well known for its easy-to-use functionality for data preparation and data visualization.
7. Statistical Analysis on Personal Details
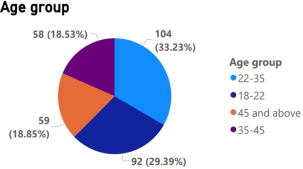
7.1. Age group
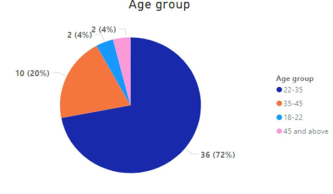
Data of all age groups have been collected for the fair responses.
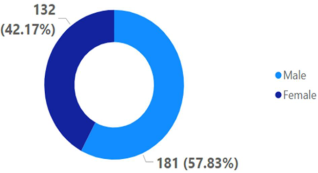
7.2. Gender
In the data collection there are 58% males and 42% females.
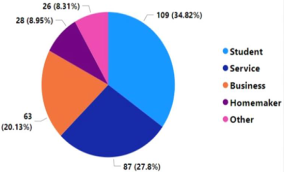
7.3. Occupation
Approximately 35% students have provided their valuable response.
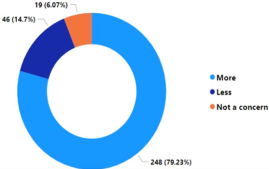
7.4. How Much Are You Concerned With the Continuous Hike in Fuel Price
Figure 4. Perceived Concern Levels.
Approximately 80% people are more concerned with the continuous hike in fuel prices.
7.5. Which Type of Vehicle Do You Own
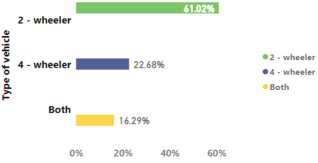
Figure 5. Type of vehicle.
Approximately 61% people are using two- wheeler, 23% people are using four- wheeler and 16% have both types of vehicles.
7.6. Type of Vehicle and Monthly Expenditure on Fuel
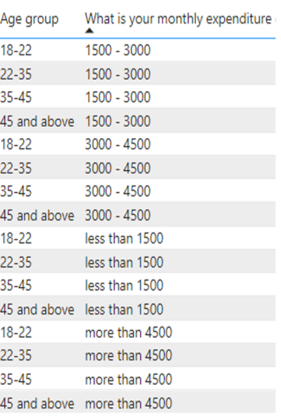
Figure 6. Monthly Expenditure by Age Group.
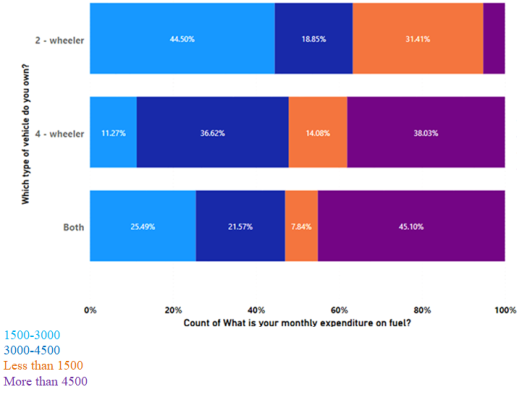
Figure 7. Monthly Fuel Expenditure by Vehicle Type. From the collection of data, I found that 61.02% people use 2-wheeler since it’s a cheap means of transport compare to the response of 22.68% of people who use 4- wheeler.
When I compare the monthly expenditure on fuel consumed by 2- wheelers and 4-wheelers, I see that 44.50% of respondents spend 1500-3000 on 2-wheelers and 11.27% spend 1500-3000 on 4-wheelers, as shown in the graph.
I conclude that a 2-wheeler is the most fuel-efficient mode of transportation when compare to a 4-wheeler.
7.7. Monthly Expenditure on Fuel of Different Age Groups
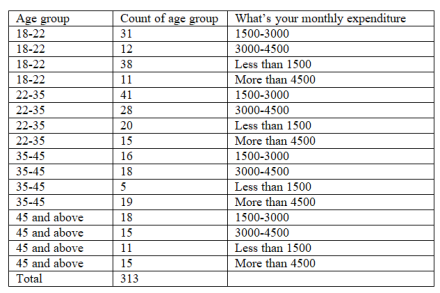
Figure 8. Monthly Expenditure by Age Group.
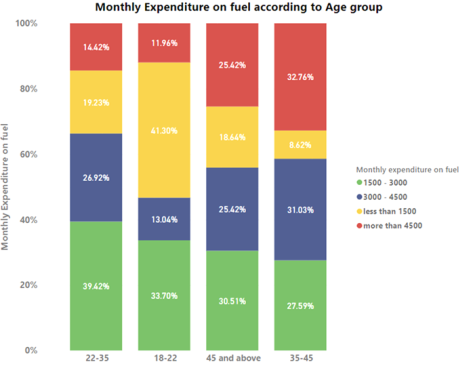
Figure 9. Monthly Expenditure on fuel according to Age group.
I see that from the response most people between age 22-35%, 39.42% responds that they spend 1500-3000 monthly expenditure on fuel, age group 18-22, 41.30% respondents spend less than 1500 monthly expenditure on fuel, age 45 and above I received 30.51% respondents said they spend 1500-3000 and age group 35-45 I received 32.76% respondents said they spend more than 4500.
7.8. Alternate Methods
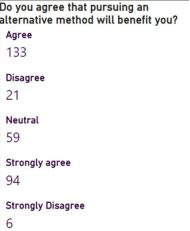
Figure 10. Agreement on the Benefits of Pursuing an Alternative Method.
From the survey, 42.49% responds that pursuing an alternative method will benefit them.
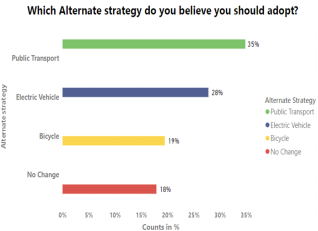
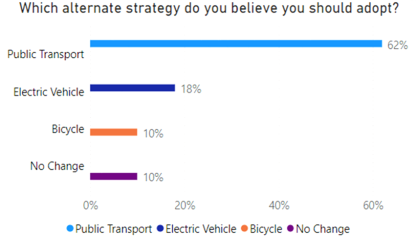
Figure 11. Alternate strategy to be adopt.
According to the graph, 35% of people agree on pursuing an alternative method of transport, public transport since it’s cheaper as compared to private vehicle.
7.9. Effects on Mental Health
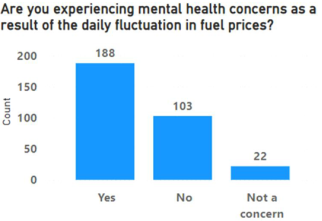
Figure 12. Mental Health Concerns as a Result of Fuel Price Fluctuations.
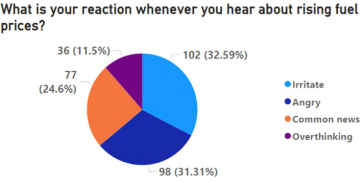
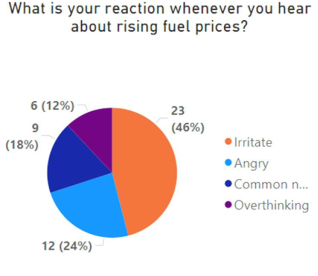
Figure 13. Reaction about the risisng fuel prices.
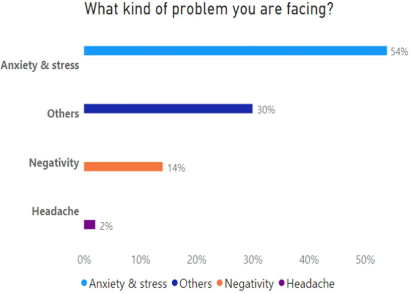
Figure 14. problems people are facing.
From the above graphs, I realized that most people are experiencing mental problems when fuel prices are increased since it interfere with their monthly budget as they have to spend more on fuel. 32.59% responds that when they realized about rising on fuel prices, they get irritated, 31.31% responds that they are angry, 24.6% that they just find it as common news and those who overthinks 11.5% responds. According to my survey I conclude that people face different problems since individual has different perspective about the rise of fuel price.
7.10. Which Category Is Suffering the Most
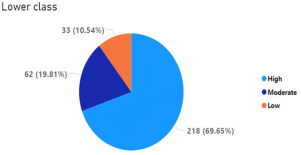
Figure 15. Lower Class Fuel Price Impact.
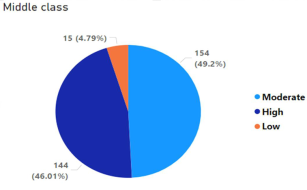
Figure 16. Middle Class Fuel Price Impact.
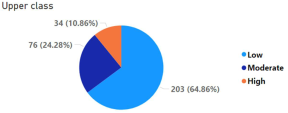
Figure 17. Upper Class Fuel Price Impact.
Here, I can conclude that most of the people have perception that lower class is affected the most as compared to middle and upper class.
7.11. Currently Monthly Expenditure Compared to Three Years Back Monthly Expenditure
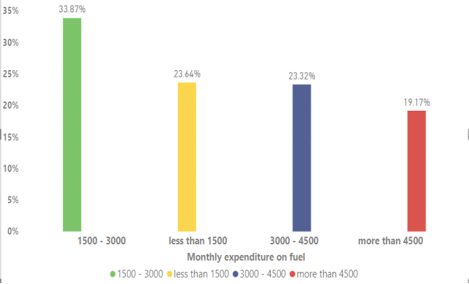
Figure 18. Distribution of Monthly Fuel Expenditure.
It’s seen that 23.64% people are spending less than 1500 on fuel and 19.17% people’s expenditure on fuel is more than 4500.
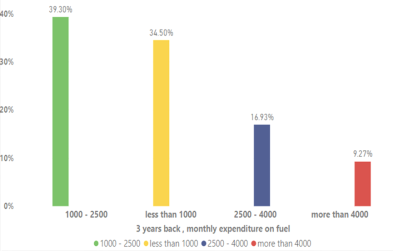
Figure 19. Monthly Fuel Expenditure 3 Years Ago.
In 3 years back, 34.5% people’s expenditure was less than 1000 and only 9.27% people were spending more than 4000.
7.12. Responsible Elements for Continuous Hike in Fuel Prices
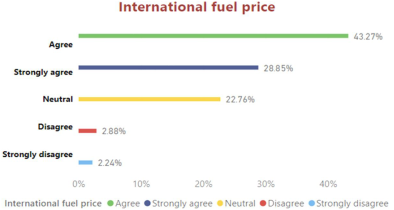
Figure 20. International fuel price.
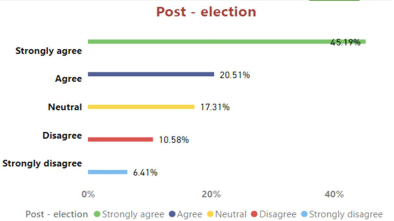
Figure 21. post-election.
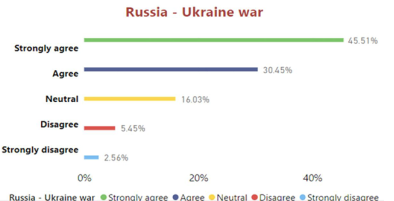
Figure 22. Russia-Ukraine war.
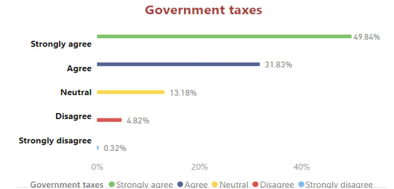
Figure 23. Government taxes.
Here, 43.27% people agree that international fuel price is one of the elements that cause the rise of fuel price.
Here 45.19% respondents strongly agree that post-election is contributing to the cause of increase in rise fuel price.
45.51% responds that Russia-Ukraine war is also another cause causing rise in fuel price, 30.45% also responds that they agree about it. When we compare according to the responds, we realize that most people agree as compared to those who disagree.
Among all the elements, government taxes are leading with 49.84% responds. Most people believe that increase of taxes is the main cause of rise in fuel prices.
8. Some Visualization of Kenya’s Data
8.1. Age Group
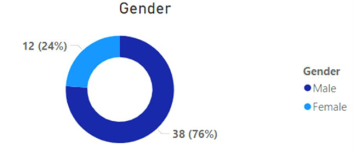
8.2. Gender
8.3. How Much Kenyan People Are Concerned with the Continuous Hike in Fuel Price
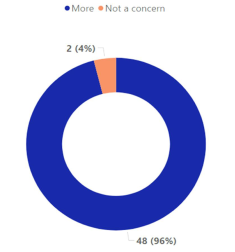
Figure 26. Fuel Price Fluctuation Concern Level.
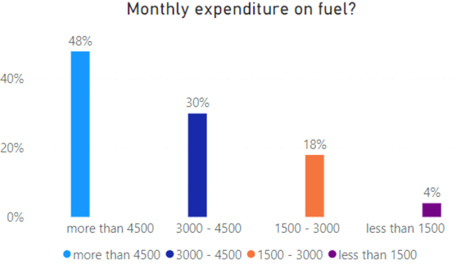
Figure 27. monthly expenditure on fuel.
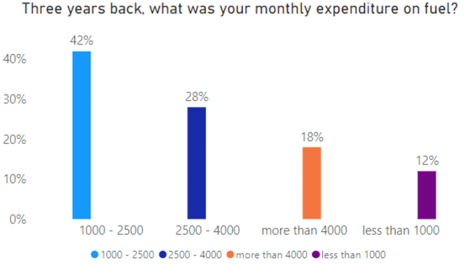
Figure 28. Monthly Fuel Expenditure 3 Years Ago.
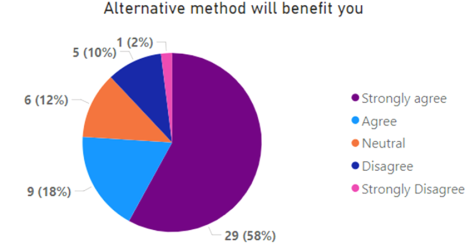
Figure 29. Perceived Benefits of Alternative Methods.
Figure 30. Alternate strategy to adopt.
Figure 31. Reaction about the rising fuel prices.
Figure 32. kind of problems faced.
Above graph shows that people are facing problems when there is rise in fuel prices, for instance, 54% of respondents are anxiety and stress.
After analyzing, we can conclude that like India, Citizens of other countries also facing the consequences of rising fuel prices. Most of the graphs are common and people have same perception. So, rise in fuel prices is not just a country’s problem, It is a world-wide problem.
9. Statistical Analysis
Statistical tools used for the analysis are -:
SPSS, R and Python, MS Excel and Power BI.
9.1. Chi-Square Test
The Chi-Square test is a statistical method used to assess whether there is a significant difference between expected and actual outcomes in categorical data. It helps determine if any observed variation is simply due to random chance or if it indicates a meaningful association between the variables involved.
Formula for Chi-Square Test;
Where;
C- Degrees of freedom
O-Observed value
E- Expected value
i. Is there any Association between Monthly Income and Monthly Expenditure on Fuel?
Hypothesis:
: There is no association between monthly income and monthly expenditure on fuel.
: There is an association between monthly income and monthly expenditure on fuel.
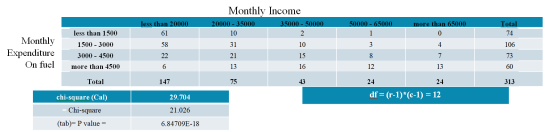
Observed Frequency:
Figure 33. Monthly Expenditure on Fuel vs. Monthly Income.
Here Chi-square (cal) > chi-square (tab), 29.704 > 21.026.
I conclude that there is an association between monthly income and monthly expenditure on fuel.
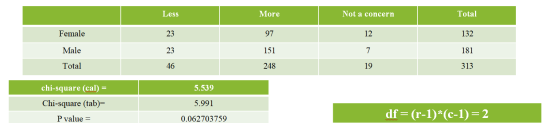
ii. Is there any association between gender and people are concerned with hike fuel price?
Hypothesis;
: There is no association between gender and people are concern with hike fuel price.
: There is an association between gender and people are concern with hike fuel price.
Figure 34. Gender vs. Concern Level.
Chi-square (cal) < chi-square (tab), 5.539 < 5.991
I conclude that there is no association between gender and people concern with hike fuel price.
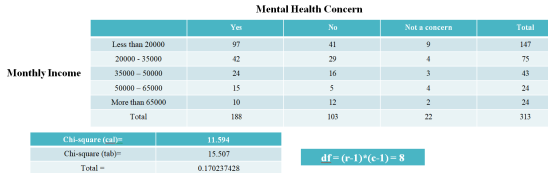
iii. Is there any association between monthly income and mental health concern?
Hypothesis;
: There is no association between monthly income and mental health concern.
: There is an association between monthly income and mental health concern.
Figure 35. Mental Health Concern.
Chi-square (cal) < chi-square (tab)
11.594 < 15.507
I conclude that there is no association between monthly income and mental health concern.
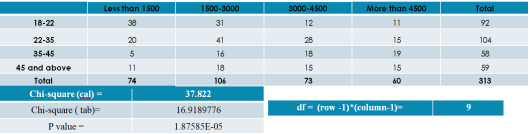
iv. Is there any association between age group and monthly expenditure on fuel?
Hypothesis;
: There is no association between age group and monthly expenditure on fuel.
: There is an association between age group and monthly expenditure on fuel.
Figure 36. Age Group vs. Monthly Fuel Expenditure.
Chi-square (cal) > chi-square (tab)
37.822 > 16.9189776
I conclude that there is an association between age group and monthly expenditure on fuel.
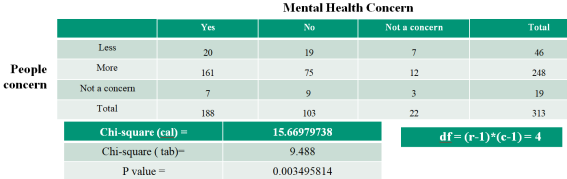
v. Is there any association between people concern and mental health concern?
Hypothesis;
: There is no association between people concern and mental health concern.
: There is an association between people concern and mental health concern.
Figure 37. mental health concern.
Chi-square (cal) > chi-square (tab), 15.67 > 9.48
I conclude that there is an association between people concern and mental health concern.
9.2. Multiple Response Analysis
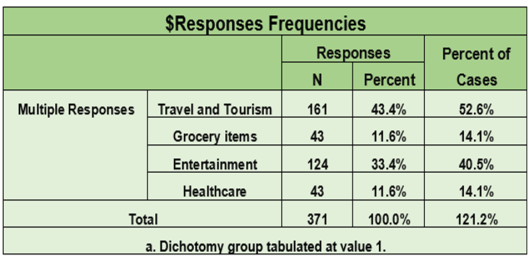
9.2.1. Where Are You Going to Cut Costs to Satisfy the Fuel Price Requirements
I observe from this analysis that 43.4% respondents reduce their expenditure on travel and tourism, 33.4% respondents reduce their expenditure on Entertainment, and 11.6% respondents reduce their expenditure on Grocery and Healthcare due to increase in fuel price.
Figure 38. Responses Frequencies.
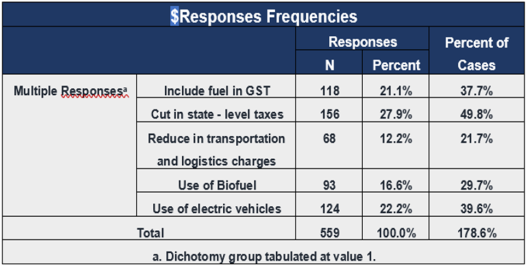
9.2.2. What in Your Opinion Will Be the Most Effective Remedy for Decreasing Fuel Prices
Figure 39. Responses Frequencies.
I observe from this analysis that 27.9% respondents prefer Cut in state - level taxes because most effective remedy for decreasing fuel price.
10. Conclusion
According to the survey, I found that 79.23% people are more concerned with the continuous hike in fuel prices. According to type of vehicle, I found that 61.02% people own 2-wheeler as compare to 22.68% people who own 4-wheeler, this is because 2-wheeler consumes less fuel as compare to 4-wheeler hence cheaper means of transport. Monthly expenditure on fuel according to age group, I found that the age group between 18-22 years, 41.30% spend monthly expenditure of less than 1500 on fuel, age group between 22-35 years, 39.42% spend 1500-3000 monthly expenditure on fuel, age group between 35-45%, 31.03% spend monthly expenditure of 3000-4500 on fuel and above age of 45 years I found 30.51% spend 1500-3000 on monthly expenditure of fuel. Due to rise in fuel price, 133 respondents agree that pursuing an alternative method will benefit them, 35% of the respondents proposes that use of public transport will safe them on their monthly expenditure of fuel since it’s cheaper than using private means. Also, I realized that most people face mental problems, 188 respondents agree that they experience mental health concern as a result of the daily fluctuation in fuel prices. The government must investigate the factors that contribute to rising fuel prices and identify solutions, as this has an impact on citizens' living standards, as people divert funds from other areas to pay for fuel. In our survey, 69.65% of people have perception that lower class is affected the most has compared to middle and upper class. In three years back, 34.5% people’s expenditure was less than 1000 and only 9.27% peoples were spending more than 4000. Now, in the current price of fuel, 23.64% of people are spending less than 1500 on fuel and 19.17% of people’s expenditure on fuel is more than 4500. People’s perception on elements causing rising of fuel prices is that 49.84% responds agree that government taxes contribute to increase in fuel prices, followed by Russian Ukraine war with 45.15% response, post-election with 45.19% and international fuel price with 43.27% response. We managed to collect data from few people from Kenya and according to their response, 96% of people are concerned with the increase in fuel price. We also find that the two countries face similar problems of fuel price, India with Rs 100 per litre and Kenya with Ksh 144.62 (Rs 102) per litre. The price of gasoline is an important macroeconomic indicator. Higher oil prices could harm the economies of oil-importing countries, as well as the global economy. Several countries are seeing higher inflation rates as a result of the oil prices have risen dramatically over the world. As a result, Inflationary pressures harm both production and consumers, resulting in a substantial difference between oil- importing and oil-exporting countries. As per the research, rising product and service prices have a macroeconomic impact, resulting in higher production costs and, as a result, higher production output costs. Households' real income will be affected by rising domestic petroleum prices directly through higher prices paid for direct petroleum use, and indirectly through higher prices paid for indirect petroleum use. In our report also, people were demanding to cut on taxes which would definitely reduce the fuel prices. And the step taken by government will definitely provide relief to citizens and it will help them to reduce their stress and anxiety.
Abbreviations
Vs | Verses |
Cal | Calculated |
Tab | Tabulated |
Acknowledgments
I take this opportunity to express out profound gratitude and deep regard to my guide Prof. K. Muralidharan for his exemplary guidance, monitoring and constant encouragement. His willingness to share his vast knowledge made me understand this project and its manifestations in great depths and helped me to complete the assigned tasks on time. I would like to thank Prof. V. A. Kalamkar, Head of the Department of Statistics for providing me the opportunity for the project work in my post-Graduation course (MSc. Statistics). I’m also thankful to all the teachers of department, who have extended help and guidance whenever required. I would also like to thank my colleagues who helped me in finishing the project in major or minor way. I would like to thank Citizens of Vadodara district who gave their valuable responses. Last but not least, we are thankful to those, who helped me in completing the project knowingly or unknowingly.
Conflicts of Interest
The author declares no conflicts of interest.
References
| [1] |
Gelman, M. et al. (2023). “The Response of Consumer Spending to Changes in Gasoline Prices.” American Economic Journal: Macroeconomics, 15(2), 129-160. This paper uses high-frequency transaction data to estimate that consumer spending is highly responsive to fuel price changes, showing large aggregate effects
arxiv.org, aeaweb.org
|
| [2] |
Financial Health Network (2022, Dec 1). “Financial Health Pulse: Gas Price Increases and Consumption Behavior.”Reports that financially vulnerable consumers split fuel purchases into smaller, more frequent transactions amid price hikes
finhealthnetwork.org
|
| [3] |
UpSide (2023). “Consumer Behavior at the Pump This Summer.”Finds a 5.7% rise in consumers “shopping around” when prices are elevated, with 2.2% more transactions per 1% sign price increase
upside.com
|
| [4] |
Yodlee (2024). “Pumped Up or Pared Down? Unpacking America’s Gasoline Spending Trends.”Through transaction data (2021-2024), this analysis reveals income-based disparities in fuel spending and shifting consumer behavior
yodlee.com
|
| [5] |
EIA (2023, Apr). “STEO Perspectives: How do Household Gasoline Costs Change When Oil Prices Vary?”Projects lower average 2023 household spending ($2,780) amid changing crude price scenarios
eia.gov
|
| [6] |
ScienceDirect (2023). “The effect of record-high gasoline prices on consumers' new vehicle purchase intention.”Quantitative study linking fuel price increases to shifts in vehicle-buying decisions, controlling for demographics
sciencedirect.com
|
| [7] |
BTS/EIA (2022). “Record Breaking Increases in Motor Fuel Prices in 2022.”Documents a 49% rise in regular gasoline prices and 55% in diesel from Jan-June 2022
bts.gov
|
| [8] |
Global Energy Crisis Wikipedia (2023). “Global energy crisis (2021-2023).”Highlights statistical links between price spikes and increased household poverty in Europe—estimating 11 million more at risk in 2022
en.wikipedia.org, yodlee.com
|
| [9] |
Household Energy Insecurity Wikipedia (2025). “Energy insecurity and the ‘heat or eat’ dilemma.”Covers 2022-23 findings on how rising energy prices force trade-offs in low-income households
en.wikipedia.org
|
| [10] |
Clemson News (2025). “The hidden impact of data on gas prices.”Analyses consumer behavioral shifts during rising prices and how price transparency changes station pricing strategies
news.clemson.edu
|
Cite This Article
-
-
@article{10.11648/j.ajtas.20251404.13,
  author = {Sheila Cherono},
  title = {Statistical Analysis on Consequences of Rising Fuel Prices on Citizens
},
  journal = {American Journal of Theoretical and Applied Statistics},
  volume = {14},
  number = {4},
  pages = {138-154},
  doi = {10.11648/j.ajtas.20251404.13},
  url = {https://doi.org/10.11648/j.ajtas.20251404.13},
  eprint = {https://article.sciencepublishinggroup.com/pdf/10.11648.j.ajtas.20251404.13},
  abstract = {This study investigates the broad economic, behavioral, and psychological impacts of rising fuel prices on urban residents in Vadodara, India. Primary data was collected from two key areas Fatehgunj and Tarsali using structured questionnaires to capture citizens’ responses to the ongoing increase in fuel costs. The study had multiple objectives: to evaluate the direct consequences of rising fuel prices on household expenditure, assess the readiness of people to adopt alternative transportation methods, analyze fuel spending across different age groups and income levels, and understand how individuals are adjusting to manage this financial pressure. Furthermore, the study explores the impact of fuel inflation on mental health and seeks citizens’ suggestions on how this issue might be addressed. An additional comparative objective was introduced to examine whether similar fuel pricing challenges are experienced in another developing country, specifically Kenya. A range of statistical tools were employed for data processing and analysis, including SPSS, R, Python, Microsoft Excel, and Power BI. These tools were used to conduct descriptive and inferential analysis, create data visualizations, and draw correlations between demographic variables and spending behaviors. The results reveal a significant shift in travel habits, increased financial stress among middle- and lower-income households, and growing public concern about long-term affordability. Many respondents reported cutting back on non-essential expenses, while others expressed willingness to switch to fuel-efficient vehicles or public transportation. These findings provide valuable insights for policymakers, economists, and urban planners aiming to develop effective strategies to ease the burden of rising fuel prices on the general public.},
 year = {2025}
}
 Copy
|
Copy
|
 Download
-
TY  - JOUR
T1  - Statistical Analysis on Consequences of Rising Fuel Prices on Citizens

AU  - Sheila Cherono
Y1  - 2025/08/04
PY  - 2025
N1  - https://doi.org/10.11648/j.ajtas.20251404.13
DO  - 10.11648/j.ajtas.20251404.13
T2  - American Journal of Theoretical and Applied Statistics
JF  - American Journal of Theoretical and Applied Statistics
JO  - American Journal of Theoretical and Applied Statistics
SP  - 138
EP  - 154
PB  - Science Publishing Group
SN  - 2326-9006
UR  - https://doi.org/10.11648/j.ajtas.20251404.13
AB  - This study investigates the broad economic, behavioral, and psychological impacts of rising fuel prices on urban residents in Vadodara, India. Primary data was collected from two key areas Fatehgunj and Tarsali using structured questionnaires to capture citizens’ responses to the ongoing increase in fuel costs. The study had multiple objectives: to evaluate the direct consequences of rising fuel prices on household expenditure, assess the readiness of people to adopt alternative transportation methods, analyze fuel spending across different age groups and income levels, and understand how individuals are adjusting to manage this financial pressure. Furthermore, the study explores the impact of fuel inflation on mental health and seeks citizens’ suggestions on how this issue might be addressed. An additional comparative objective was introduced to examine whether similar fuel pricing challenges are experienced in another developing country, specifically Kenya. A range of statistical tools were employed for data processing and analysis, including SPSS, R, Python, Microsoft Excel, and Power BI. These tools were used to conduct descriptive and inferential analysis, create data visualizations, and draw correlations between demographic variables and spending behaviors. The results reveal a significant shift in travel habits, increased financial stress among middle- and lower-income households, and growing public concern about long-term affordability. Many respondents reported cutting back on non-essential expenses, while others expressed willingness to switch to fuel-efficient vehicles or public transportation. These findings provide valuable insights for policymakers, economists, and urban planners aiming to develop effective strategies to ease the burden of rising fuel prices on the general public.
VL  - 14
IS  - 4
ER  -
Copy
|
Download