
The green synthesis of zinc oxide (ZnO) nanoparticles has attracted significant attention as an eco-friendly alternative to conventional chemical methods. In this study, ZnO nanoparticles were synthesized using aqueous leaf extract of Zanthoxylum gilletii, where plant phytochemicals acted as reducing and stabilizing agents. Key synthesis parameters, including precursor concentration, reaction pH, and temperature, were systematically optimized to obtain nanoparticles with desirable physicochemical properties. Optimal synthesis conditions were achieved at 0.7 M precursor concentration, pH 10, and 60°C, resulting in well-defined and stable nanoparticles. The synthesized ZnO nanoparticles were characterized using UV–Visible spectroscopy, Fourier Transform Infrared (FTIR) spectroscopy, X-ray diffraction (XRD), and photoluminescence (PL) analysis. UV–Vis results showed a characteristic absorption peak at 356 nm with a band gap of 3.12 eV, confirming ZnO formation. FTIR analysis revealed a Zn–O stretching vibration at ~410 cm-1, while XRD confirmed a hexagonal wurtzite structure with an average crystallite size of 29.70 nm. PL spectra exhibited an emission peak at 401 nm, indicating defect-related optical behaviour. The antimicrobial activity of the synthesized nanoparticles was evaluated against Escherichia coli, Staphylococcus aureus, Pseudomonas aeruginosa, and Candida albicans using the agar disc diffusion method. The nanoparticles exhibited significant antimicrobial activity, with mean zones of inhibition ranging from 18.67 mm to 22.00 mm. Statistical analysis (one-way ANOVA, p > 0.05) indicated no significant difference among the tested microorganisms, demonstrating consistent broad-spectrum antimicrobial performance. These findings demonstrate that Zanthoxylum gilletii-mediated green synthesis provides an effective and sustainable approach for producing ZnO nanoparticles with controlled structural and optical properties and strong antimicrobial potential.
| Published in | American Journal of Science, Engineering and Technology (Volume 11, Issue 3) |
| DOI | 10.11648/j.ajset.20261103.11 |
| Page(s) | 92-103 |
| Creative Commons |
This is an Open Access article, distributed under the terms of the Creative Commons Attribution 4.0 International License (http://creativecommons.org/licenses/by/4.0/), which permits unrestricted use, distribution and reproduction in any medium or format, provided the original work is properly cited. |
| Copyright |
Copyright © The Author(s), 2026. Published by Science Publishing Group |
ZnO Nanoparticles, Green Synthesis, Zanthoxylum Gilletii, Nanoparticle Characterization, Antimicrobial Activity
2 θ Degrees | d (Å) spacing | βhkl | 𝜀(strain) ×10-3 | 𝛿(nm-2) | hkl | D (nm) |
|---|---|---|---|---|---|---|
31.67 | 2.82 | 0.16994 | 2.62 | 4.24×10⁻⁴ | 100 | 48.58 |
34.08 | 2.63 | 0.30902 | 4.39 | 1.10×10⁻³ | 002 | 30.13 |
36.80 | 2.44 | 0.33891 | 4.44 | 1.38×10⁻³ | 101 | 26.88 |
47.77 | 1.90 | 0.28831 | 2.84 | 1.64×10⁻³ | 102 | 24.71 |
56.43 | 1.63 | 0.49467 | 4.03 | 3.02×10⁻³ | 110 | 18.20 |
Microorganism | Replicate 1 | Replicate 2 | Replicate 3 | Mean ± SD (mm) | Positive Control |
|---|---|---|---|---|---|
Escherichia coli | 17 | 20 | 19 | 18.67 ± 1.25 | 11 (Amoxicillin) |
Staphylococcus aureus | 18 | 20 | 21 | 19.67 ± 1.25 | 20 (Amoxicillin) |
Pseudomonas aeruginosa | 20 | 22 | 18 | 20.00 ± 1.63 | 12 (Amoxicillin) |
Candida albicans | 20 | 22 | 24 | 22.00 ± 1.63 | 14 (Fluconazole) |
ZnO | Zinc Oxide |
UV–Vis | Ultraviolet–Visible Spectroscopy |
FTIR | Fourier Transform Infrared Spectroscopy |
XRD | X-ray Diffraction |
PL | Photoluminescence |
ROS | Reactive Oxygen Species |
NPs | Nanoparticles |
| [1] | Ibrahim Khan KS, Khan I. Nanoparticles: Properties, applications and toxicities. Arab J Chem. 2019; 12(7): 908–31. |
| [2] | Sirelkhatim A, Mahmud S, Seeni A, Kaus NHM, Ann LC, Bakhori SKM, et al. Review on zinc oxide nanoparticles: antibacterial activity and toxicity mechanism. Nano-Micro Lett. 2015; 7(3): 219–42. |
| [3] | Raghupathi KR, Koodali RT, Manna AC. Size-dependent bacterial growth inhibition and mechanism of antibacterial activity of zinc oxide nanoparticles. Langmuir. 2011; 27(7): 4020–8. |
| [4] | Kołodziejczak-Radzimska A, Jesionowski T. Zinc oxide—from synthesis to application: a review. Materials. 2014; 7(4): 2833–81. |
| [5] | Iravani S. Green synthesis of metal nanoparticles using plants. Green Chem. 2011; 13(10): 2638–50. |
| [6] | Ahmed S, Ahmad M, Swami BL, Ikram S. A review on plants extract mediated synthesis of silver nanoparticles for antimicrobial applications: a green expertise. J Adv Res. 2016; 7(1): 17–28. |
| [7] | Wekesa EN, Kimani NM, Kituyi SN, Omosa LK, Santos CB. Therapeutic potential of the genus Zanthoxylum phytochemicals: A theoretical ADME/Tox analysis. South African Journal of Botany. 2023 Nov 1; 162: 129-41. |
| [8] | Al-Harbi HF, Awad MA, Ortashi KM, Al-Humaid LA, Ibrahim AA, Al-Huqail AA. Green synthesis of zinc oxide nanoparticles: physicochemical Characterization, photocatalytic Performance, and evaluation of their impact on seed germination parameters in crops. Catalysts. 2025; 15(10): 924. |
| [9] | Alqahtani OS, Muddapur UM, Kamat K, Shenvi A, Shaikh IA, Aljaezi I, Al Kazman BS, Alshamrani MA, Khan AA, Al-Qahtani AM, Mannasaheb BA. Sustainable green synthesis of zinc oxide nanoparticles utilizing Zingiber officinale peel aqueous extract, characterization, and determination of its anticancer and antimicrobial potential. PLoS One. 2025 Nov 19; 20(11): e0334685. |
| [10] | Lestari D, Masriaha I, Hasibuana AYP, Pratiwi PB. FTIR Analysis of ZnO-Functionalized Activated Carbon Derived from Oil Palm Empty Fruit Bunches for Potential Photocatalytic Applications. J Bio-Geo Mater Dan Energi. 2026; 6(1): 51–7. |
| [11] | Aouadi A, Hamada Saud D, Rebiai A, Achouri A, Benabdesselam S, Mohamed Abd El-Mordy F, et al. Introducing the antibacterial and photocatalytic degradation potentials of biosynthesized chitosan, chitosan–ZnO, and chitosan–ZnO/PVP nanoparticles. Sci Rep. 2024; 14(1): 14753. |
| [12] | Ravi P, Babu S. Recent development in plant-mediated zinc oxide nanoparticles with biomedical applications. Chem Phys Impact. 2025; 10: 100870. |
| [13] | López-López JR, Hernández-Chávez MA, López-López M de J, Tejeda-Ochoa A, Cervantes-Gaxiola ME, Parra-Unda JR, et al. Tagetes erecta—mediated green synthesis of ZnO–Ag nanocomposites: characterization and dual applications in solar photocatalytic degradation and antibacterial activity. Ceramics. 2025; 8(2): 45. |
| [14] | Harish V, Ansari MM, Tewari D, Gaur M, Yadav AB, García-Betancourt ML, et al. Nanoparticle and nanostructure synthesis and controlled growth methods. Nanomaterials. 2022; 12(18): 3226. |
| [15] | Dejene F. Characterization of low-temperature-grown ZnO nanoparticles: The effect of temperature on growth. J Phys Commun. 2022; 6(7): 075011. |
| [16] | Jamdagni P, Khatri P, Rana JjjS. Green synthesis of zinc oxide nanoparticles using flower extract of Nyctanthes arbor-tristis and their antifungal activity. J King Saud Univ-Sci. 2018; 30(2): 168–75. |
| [17] | Ifeanyichukwu UL, Fayemi OE, Ateba CN. Green synthesis of zinc oxide nanoparticles from pomegranate (Punica granatum) extracts and characterization of their antibacterial activity. Molecules. 2020; 25(19): 4521. |
| [18] | Kamarajan G, Anburaj DB, Porkalai V, Muthuvel A, Nedunchezhian G, Mahendran N. Green synthesis of ZnO nanoparticles and their photocatalyst degradation and antibacterial activity. 2022. |
| [19] | Ullah S, Gulnaz A, Anwar S, Kamal A, Wali H. Synthetization and characterization of zinc oxide nanoparticles by X-ray diffractometry (XRD), fourier transforms, infra-red spectroscopy (FT-IR), scanning electron microscopy (SEM) and antibacterial activity test. Am J Phys Sci. 2024; 2(1): 1–25. |
| [20] | Jepngetich J, Njoroge PW, Opiyo S, Kiprotich S. Synthesis and characterization of Ag-ZnO using citrus reticulata peel extract. Mater Res Express. 2025; 12(5): 055003. |
| [21] | Basak S, Sikdar S, Ali S, Mondal M, Haydar MS, Sarkar K, et al. Rational synthesis and characterization of temperature switching ZnFe 2 O 4/ZnO nanocomposites used for anti-bacterial, anti-oxidant and seed germination properties. New J Chem. 2024; 48(8): 3624–37. |
| [22] | Chitradevi T, Jestin Lenus A, Victor Jaya N. Structure, morphology and luminescence properties of sol-gel method synthesized pure and Ag-doped ZnO nanoparticles. Mater Res Express. 2020; 7(1): 015011. |
| [23] | Abebe B, Zereffa EA, Tadesse A, Murthy HA. A review on enhancing the antibacterial activity of ZnO: Mechanisms and microscopic investigation. Nanoscale Res Lett. 2020; 15(1): 190. |
APA Style
Kathoka, B., Ayabei, K., Onyambu, Z. M., Kiprotich, S. (2026). Green Synthesis, Characterization, and Antimicrobial Activity of ZnO Nanoparticles Using Zanthoxylum gilletii Leaf Extract. American Journal of Science, Engineering and Technology, 11(3), 92-103. https://doi.org/10.11648/j.ajset.20261103.11
ACS Style
Kathoka, B.; Ayabei, K.; Onyambu, Z. M.; Kiprotich, S. Green Synthesis, Characterization, and Antimicrobial Activity of ZnO Nanoparticles Using Zanthoxylum gilletii Leaf Extract. Am. J. Sci. Eng. Technol. 2026, 11(3), 92-103. doi: 10.11648/j.ajset.20261103.11
@article{10.11648/j.ajset.20261103.11,
  author = {Benjamin Kathoka and Kiplagat Ayabei and Zipporah Moraa Onyambu and Sharon Kiprotich},
  title = {Green Synthesis, Characterization, and Antimicrobial Activity of ZnO Nanoparticles Using Zanthoxylum gilletii Leaf Extract},
  journal = {American Journal of Science, Engineering and Technology},
  volume = {11},
  number = {3},
  pages = {92-103},
  doi = {10.11648/j.ajset.20261103.11},
  url = {https://doi.org/10.11648/j.ajset.20261103.11},
  eprint = {https://article.sciencepublishinggroup.com/pdf/10.11648.j.ajset.20261103.11},
  abstract = {The green synthesis of zinc oxide (ZnO) nanoparticles has attracted significant attention as an eco-friendly alternative to conventional chemical methods. In this study, ZnO nanoparticles were synthesized using aqueous leaf extract of Zanthoxylum gilletii, where plant phytochemicals acted as reducing and stabilizing agents. Key synthesis parameters, including precursor concentration, reaction pH, and temperature, were systematically optimized to obtain nanoparticles with desirable physicochemical properties. Optimal synthesis conditions were achieved at 0.7 M precursor concentration, pH 10, and 60°C, resulting in well-defined and stable nanoparticles. The synthesized ZnO nanoparticles were characterized using UV–Visible spectroscopy, Fourier Transform Infrared (FTIR) spectroscopy, X-ray diffraction (XRD), and photoluminescence (PL) analysis. UV–Vis results showed a characteristic absorption peak at 356 nm with a band gap of 3.12 eV, confirming ZnO formation. FTIR analysis revealed a Zn–O stretching vibration at ~410 cm-1, while XRD confirmed a hexagonal wurtzite structure with an average crystallite size of 29.70 nm. PL spectra exhibited an emission peak at 401 nm, indicating defect-related optical behaviour. The antimicrobial activity of the synthesized nanoparticles was evaluated against Escherichia coli, Staphylococcus aureus, Pseudomonas aeruginosa, and Candida albicans using the agar disc diffusion method. The nanoparticles exhibited significant antimicrobial activity, with mean zones of inhibition ranging from 18.67 mm to 22.00 mm. Statistical analysis (one-way ANOVA, p > 0.05) indicated no significant difference among the tested microorganisms, demonstrating consistent broad-spectrum antimicrobial performance. These findings demonstrate that Zanthoxylum gilletii-mediated green synthesis provides an effective and sustainable approach for producing ZnO nanoparticles with controlled structural and optical properties and strong antimicrobial potential.},
 year = {2026}
}
TY  - JOUR
T1  - Green Synthesis, Characterization, and Antimicrobial Activity of ZnO Nanoparticles Using Zanthoxylum gilletii Leaf Extract
AU  - Benjamin Kathoka
AU  - Kiplagat Ayabei
AU  - Zipporah Moraa Onyambu
AU  - Sharon Kiprotich
Y1  - 2026/07/17
PY  - 2026
N1  - https://doi.org/10.11648/j.ajset.20261103.11
DO  - 10.11648/j.ajset.20261103.11
T2  - American Journal of Science, Engineering and Technology
JF  - American Journal of Science, Engineering and Technology
JO  - American Journal of Science, Engineering and Technology
SP  - 92
EP  - 103
PB  - Science Publishing Group
SN  - 2578-8353
UR  - https://doi.org/10.11648/j.ajset.20261103.11
AB  - The green synthesis of zinc oxide (ZnO) nanoparticles has attracted significant attention as an eco-friendly alternative to conventional chemical methods. In this study, ZnO nanoparticles were synthesized using aqueous leaf extract of Zanthoxylum gilletii, where plant phytochemicals acted as reducing and stabilizing agents. Key synthesis parameters, including precursor concentration, reaction pH, and temperature, were systematically optimized to obtain nanoparticles with desirable physicochemical properties. Optimal synthesis conditions were achieved at 0.7 M precursor concentration, pH 10, and 60°C, resulting in well-defined and stable nanoparticles. The synthesized ZnO nanoparticles were characterized using UV–Visible spectroscopy, Fourier Transform Infrared (FTIR) spectroscopy, X-ray diffraction (XRD), and photoluminescence (PL) analysis. UV–Vis results showed a characteristic absorption peak at 356 nm with a band gap of 3.12 eV, confirming ZnO formation. FTIR analysis revealed a Zn–O stretching vibration at ~410 cm-1, while XRD confirmed a hexagonal wurtzite structure with an average crystallite size of 29.70 nm. PL spectra exhibited an emission peak at 401 nm, indicating defect-related optical behaviour. The antimicrobial activity of the synthesized nanoparticles was evaluated against Escherichia coli, Staphylococcus aureus, Pseudomonas aeruginosa, and Candida albicans using the agar disc diffusion method. The nanoparticles exhibited significant antimicrobial activity, with mean zones of inhibition ranging from 18.67 mm to 22.00 mm. Statistical analysis (one-way ANOVA, p > 0.05) indicated no significant difference among the tested microorganisms, demonstrating consistent broad-spectrum antimicrobial performance. These findings demonstrate that Zanthoxylum gilletii-mediated green synthesis provides an effective and sustainable approach for producing ZnO nanoparticles with controlled structural and optical properties and strong antimicrobial potential.
VL  - 11
IS  - 3
ER  -
Department of Chemistry and Biochemistry, University of Eldoret, Eldoret, Kenya
Biography: Benjamin Kathoka is a postgraduate student in the Department of Chemistry and Biochemistry at the University of Eldoret, Kenya. He holds a bachelor’s degree in chemistry and is currently pursuing a Master’s degree with a focus on nanotechnology and green synthesis of metal oxide nanoparticles. His research interests include nanoparticle synthesis, characterization techniques, and antimicrobial applications of nanomaterials. He has been involved in experimental research focusing on environmentally friendly approaches to nanomaterial production. His current work centers on the synthesis and evaluation of ZnO nanoparticles using plant-mediated methods for biomedical and environmental applications.

Department of Chemistry and Biochemistry, University of Eldoret, Eldoret, Kenya
Biography: Kiplagat Ayabei is a lecturer in the Department of Chemistry and Biochemistry at the University of Eldoret, Kenya. He holds a PhD. in Chemistry and is actively involved in research and teaching in analytical and materials chemistry. His research interests include nanomaterials, environmental chemistry, and sustainable synthesis methods. He has supervised several undergraduate and postgraduate research projects and contributes to academic development through mentorship and research guidance.

Department of Chemistry and Biochemistry, University of Eldoret, Eldoret, Kenya
Biography: Zipporah Moraa Onyambu is a Doctor of Analytical Chemistry from the University of Eldoret, specializing in food security, nutrition, and cosmetic product analysis. Her research focuses on the bioaccessibility of key nutrients, such as Vitamin B and beta-carotene, in thermally processed African indigenous vegetables, contributing to improved dietary insights and food security. She has also examined the safety of cosmetic products in Kenya, particularly studying heavy metal levels in aloe vera-based creams, soaps, and skincare products. Her work highlights potential health risks and supports stronger quality standards in the cosmetics industry. Dr. Onyambu has authored several peer-reviewed articles and a master’s thesis, with her research gaining academic citations. She continues to contribute to advancing knowledge in analytical chemistry, public health, and consumer safety.

Department of Physical and Biological Sciences, Murang’a University, Murang'a, Kenya
Biography: Sharon Kiprotich is the Head of the Department (HOD) of Physical and Biological Sciences at Murang’a University of Technology, Kenya. She holds a PhD in Physics and has extensive experience in interdisciplinary research bridging physical and biological systems. Her research focuses on applied physics, nanomaterials, and materials science, with particular emphasis on the structural, optical, and luminescence properties of nanoparticles such as cadmium telluride (CdTe) quantum dots and zinc oxide (ZnO) nanostructures. Her work explores how synthesis conditions influence material performance, contributing to advancements in nanotechnology and energy-related applications. Dr. Kiprotich has authored numerous peer-reviewed publications in reputable journals, with her research widely cited in the field of materials science. As both a scholar and academic leader, she continues to advance research, innovation, and teaching in physics and related disciplines.

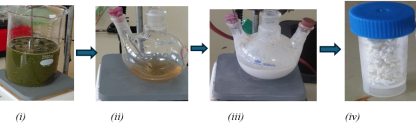
Figure 1. Visual observation of ZnO nanoparticle synthesis showing (i) aqueous Zanthoxylum gilletii leaf extract, (ii) reaction mixture after addition of zinc nitrate precursor, (iii) formation of a turbid whitish ZnO nanoparticle suspension, and (iv) dried ZnO nanoparticles obtained after purification and annealing.
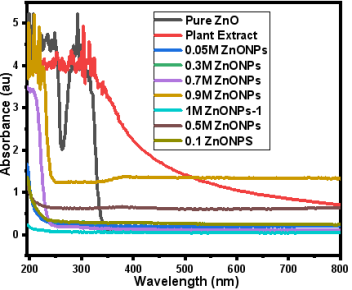
Figure 2. UV–Vis spectra for concentration series.
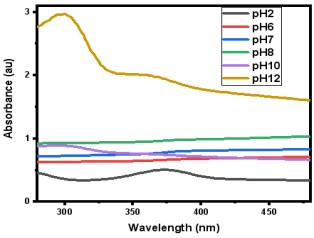
Figure 3. UV–Vis spectra for pH variation.
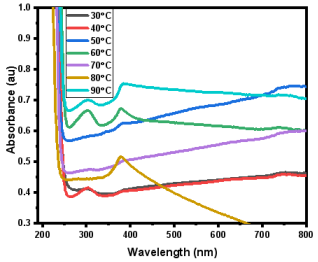
Figure 4. UV–Vis spectra for temperature variation.
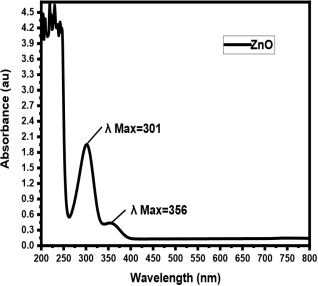
Figure 5. UV–Visible absorption spectrum of ZnO nanoparticles showing characteristic peak at 356 nm.
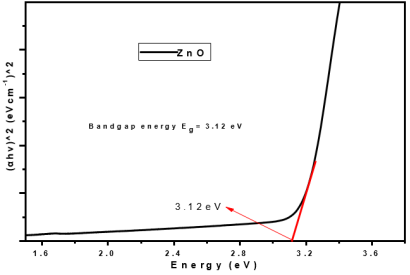
Figure 6. Tauc plot of ZnO nanoparticles used to estimate the optical band gap energy (3.12 eV).
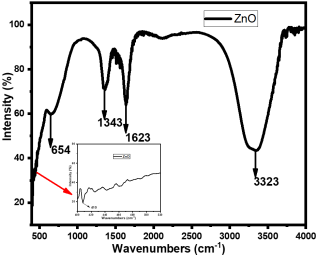
Figure 7. FTIR spectrum of ZnO nanoparticles showing Zn–O stretching and functional groups responsible for capping and stabilization.
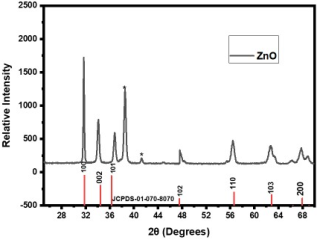
Figure 8. XRD pattern of ZnO nanoparticles confirming hexagonal wurtzite structure.
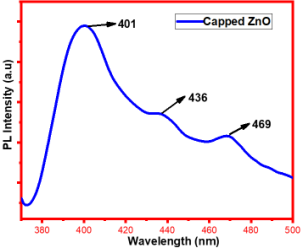
Figure 9. Photoluminescence spectrum of ZnO nanoparticles showing near band edge and defect-related emissions.
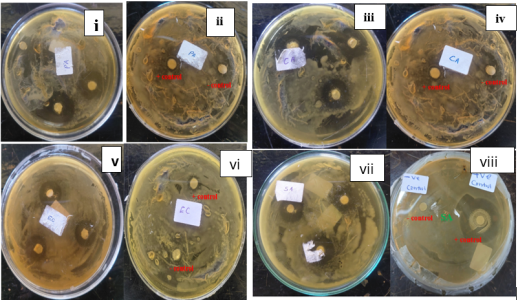
Figure 10. Zones of inhibition produced by ZnO nanoparticles and positive control agents against (i) Pseudomonas aeruginosa treated with ZnO nanoparticles, (ii) Pseudomonas aeruginosa treated with amoxicillin, (iii) Candida albicans treated with ZnO nanoparticles, (iv) Candida albicans treated with fluconazole, (v) Escherichia coli treated with ZnO nanoparticles, (vi) Escherichia coli treated with amoxicillin, (vii) Staphylococcus aureus treated with ZnO nanoparticles, and (viii) Staphylococcus aureus treated with amoxicillin.

Information



 Share This Article
 Twitter
 Linked In
 Facebook
 Copy
Copy Download