2. Materials & Methodology
2.1. Description of the Study Area
Baro-Akobo Sub Basin lines in the south west of Ethiopia between latitudes of 5° 31` and 10° 54` N, and longitudes of 33° 0` and 36° 17` E. The basin area is about 76,000 km2 and is bordered by the Sudan in the West, northwest and southwest, Abbay and Omo-Gibe Basins in the east. The major rivers within the Baro-Akobo basin are Baro and its tributaries Alwero, Gilo and the Akobo. These rivers, which arise in the eastern part of the highlands, flow westward to join the White Nile in Sudan. The mean annual runoff of the basin is estimated to be about 23 km3 as gauged at Gambella station. Elevation of the study area varies between 440 and 3000 m a.m.s.l. The higher elevation ranges are located in the North East and Eastern part of the basin while the remaining part of the basin is found in lower elevation. In the study area, there is high variability in temperature with large differences between the daily maximum and minimum temperatures
| [15] | C. D. Guzman, S. A. Tilahun, A. D. Zegeye, and T. S. Steenhuis, “Suspended sediment concentration – discharge relationships in the ( sub- ) humid Ethiopian highlands,” pp. 1067–1077, 2013, https://doi.org/10.5194/hess-17-1067-2013 |
[15]
.
One of the tributaries of the Baro River is a river in southwestern Ethiopia, which defines part of Ethiopia's border with South Sudan. The Baro River is created by the confluence of the Birbir and Gebba rivers, east of Metu in the Illubabor Zone of the Oromia Region. From its source in the Ethiopian Highlands it flows west for 306 kilometers (190 mi) to join the Pibor River. The Baro-Pibor confluence marks the beginning of the Sobat River, a tributary of the White Nile. The Baro and its tributaries drain a watershed 41,400 km2 (16,000 sq. mi) in size. The river's mean annual discharge at its mouth is 241 m³/s (8,510 ft³/s).
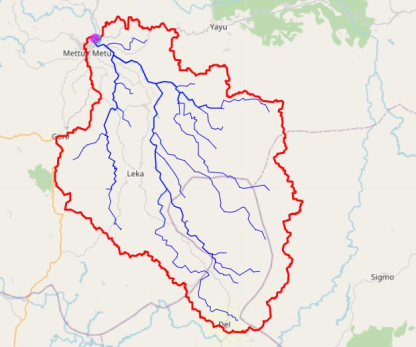
The Sore watershed (approximately 1665.5 km2), a sub-watershed of the Baro river basin, was chosen for this particular study (
Figure 1). The Sore watershed is between 937 and 3001 metres above sea level in elevation. Sore's climate is divided into warm to chilly, semi humid areas rainfall distribution zones based on altitude and local temperature. The Sore watershed experiences annual rainfall ranging from 1533 mm to 2046 mm on average. The studied area's rainfall distribution pattern has a unimodal trend with constant highs from March to October
Figure 1. Location of Sore Watershed.
2.2. Data Sources and Availability
For this study, it was necessary to collect meteorological (Rainfall, Maximum & Minimum temperature, Evapotranspiration), hydrological (River discharge & sediment) and GIS (Land use land cover, Soil) data. These data were collected from Meteorological Agency of Ethiopia and Ministry of Water & Electricity. To calibrate and validate the model we used 2005-2018 years of recorded period.
Meteorological data
The required meteorological data, including daily precipitation, daily maximum, and daily minimum air temperatures, were collected from the Gambella branch of the Ethiopian National Meteorological Agency, which provided the inputs for PED models. It is the major source of meteorological data. These data were used for hydrological model development. The reason for selecting the representative meteorological stations that represent the catchments depends on the availability of climatic variables, the length of the record period, and others. The 13 years of meteorological data from 2005–2018 for the Sore watershed were used for calibrating and validating the selected hydrological models.
Hydrological data
The Sore catchment's daily stream flow and sediment (produced by the sediment rating curve) were used to calibrate and validate the model (PED-WM) using data gathered from the Ministry of Water and Electricity (MoWE) for the Sore watershed from 2005 to 2018 at Sore near the Metu measuring station.
Digital Elevation Model (DEM)
The digital elevation model (DEM) is the digital representation of a topographic surface and it is specifically made available in the form of raster or regular grid of spot heights. The DEM data was used for watershed delineation and river network generation for the selected catchment. The Digital Elevation Model was obtained from Ministry of Water and Electricity and it has a horizontal resolution of 30m x30m.
Soil map/Soil shape file
The soil map (shape file) data was used to show the distribution of the soil type in the catchments and the various parameters describing the soil's hydrological and textural properties. The shapefile, which describes the distribution of soil in the study area, was obtained from the base line maps available at the Ministry of Water and Electricity at a scale of 1:250,000.
2.3. Data Quality Analysis
Initial data screening has been conducted by visually observing the data for outliers and missing values. Missed values and outstanding outliers at initial screening was systematically ignored and refilled by simple normal ratio (rainfall), arithmetic mean and XLSTAT excel model (maximum & minimum temperature). After initial screening was completed, all the meteorological data was subjected to detail hydrologic screening to check the data quality against different indexes.
Filling the missing data
Rainfall data play a central role in developing rainfall - runoff - soil loss models. Measured precipitation data is important to many problems in hydrologic analysis and design. For gauges that require periodic observation, the failure of the observer to make the necessary visit to the gage may result in missing data. Damage of recording gauge is another problem that results in incomplete data records, and instrument failure because of mechanical or electrical malfunctioning can result in missing data. For this study, the two procedures for estimating daily totals rely on the data from any adjacent stations. The locations of the adjacent stations are such that they are close to and approximately evenly spaced around the site with the missing data. When the difference between the average annual rainfall at any of the adjacent stations and the missing data station is greater than 10% a normal ratio method is normally used (Silva et al., 2007).
(1)
Where Px is the precipitation for the station with missing records and P1, P2, P3 are the adjacent stations precipitation values. N1, N2, N3 are the long-term mean annual precipitation values at the respective stations and “n” is the number of stations surrounding the station X.
2.4. Methodology
Parameter Efficient semi-Distributed Watershed model (PED-WM) was used to predict discharge and sediment load in Baro watershed.
2.4.1. Parameter Efficient Semi-Distributed Watershed Model (PED-W)
PED model combines the semi-distributed conceptual water balance model developed by
| [5] | T. S. Steenhuis et al., “Predicting discharge and sediment for the Abay ( Blue Nile ) with a simple model,” vol. 3737, no. November, pp. 3728–3737, 2009, https://doi.org/10.1002/hyp |
[5]
with the sediment model developed by
| [14] | A. S. Collick et al., “A simple semi-distributed water balance model for the Ethiopian highlands,” vol. 3727, no. December, pp. 3718–3727, 2009, https://doi.org/10.1002/hyp |
[14]
. The first is takes into account saturation excess runoff principles
| [2] | S. Tilahun, C. D. Guzman, A. D. Zegeye, and E. K. Ayana, “the Semi-humid Ethiopian Highlands : A Case co d Pr oo f,” no. May, 2015, https://doi.org/10.1007/978-3-319-02720-3 |
| [15] | C. D. Guzman, S. A. Tilahun, A. D. Zegeye, and T. S. Steenhuis, “Suspended sediment concentration – discharge relationships in the ( sub- ) humid Ethiopian highlands,” pp. 1067–1077, 2013, https://doi.org/10.5194/hess-17-1067-2013 |
| [16] | M. A. Moges, F. A. Zemale, M. L. Alemu, and G. K. Ayele, “Sediment concentration rating curves for a monsoonal climate : upper Blue Nile,” pp. 337–349, 2016, https://doi.org/10.5194/soil-2-337-2016 |
[2, 15, 16]
. The PED-W model represents the hydrological and erosion process. The model input requirement for PED model are daily rainfall, evapo-transpiration, the areal fraction, maximum storage for each zone and the inter flow and base flow time. In PED model the watershed (study area) is divided into three zones: two zones producing surface runoff and one zone contributing to the interflow and base flow of the watershed.
Predicting Direct Runoff, Interflow and Base Flow
The general methodology was used based on detail descriptions in
| [5] | T. S. Steenhuis et al., “Predicting discharge and sediment for the Abay ( Blue Nile ) with a simple model,” vol. 3737, no. November, pp. 3728–3737, 2009, https://doi.org/10.1002/hyp |
[5]
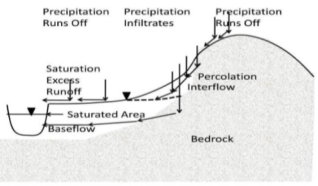
. The Sore watershed will divided into two major areas, runoff contributing areas and hill slopes. Runoff contributing areas were in turn divided into two: exposed hardpan or bed rock areas which produce runoff for little rainfall and the flatter bottom lands which produce runoff after saturation. From a schematic of conceptual model formulations presented in
Figure 2, all excess water from these contributing areas becomes surface runoff while excess water in the root zone of high infiltration upslope areas infiltrates and is released to the stream over a period of time. The water infiltrated in the upslope areas joins the river either through interflow or base flow
| [2] | S. Tilahun, C. D. Guzman, A. D. Zegeye, and E. K. Ayana, “the Semi-humid Ethiopian Highlands : A Case co d Pr oo f,” no. May, 2015, https://doi.org/10.1007/978-3-319-02720-3 |
| [14] | A. S. Collick et al., “A simple semi-distributed water balance model for the Ethiopian highlands,” vol. 3727, no. December, pp. 3718–3727, 2009, https://doi.org/10.1002/hyp |
| [15] | C. D. Guzman, S. A. Tilahun, A. D. Zegeye, and T. S. Steenhuis, “Suspended sediment concentration – discharge relationships in the ( sub- ) humid Ethiopian highlands,” pp. 1067–1077, 2013, https://doi.org/10.5194/hess-17-1067-2013 |
[2, 14, 15]
.
Figure 2. Schematic for rainfall-runoff processes at hillside watershed (Steenhuis et al., 2009).
The total discharge at the outlet point of the watershed is estimated by Equation (
2):
A1, A2 and A3 are area fractions of the saturated, degraded areas and the recharge hill side area respectively. Q1 and Q2 are saturation excess runoff from saturated and degraded areas (mm d−1), QB and QI are base flow and interflow (mm d−1) respectively.
Surface run off generated from the saturated and degraded area calculated by:
=(3)
When, (P − PET) ∆t > St−∆t −
Where, P is precipitation (mm d−1), PET is potential evapotranspiration (mm d−1), , previous time step storage (mm) and Δt is the time step (d−1), is the maximum water storage capacity of the three areas;
The basic equation used to estimate the amount of water stored, S (mm), in the topmost soil layer of hill-slope and runoff source areas for a time step ∆t, is the Thornthwaite Mather water balance equation as modified by (Collick et al., 2009).
When P≥ 𝑃𝐸𝑇
Where S is water stored in topsoil (mm), St–∆t, previous time step storage (mm), P is precipitation (mm/ time step), PET, potential Evapo-transpiration (mm/ time step), and ∆t is the time step.
=(5)
Base flow QB is calculated as a first order reservoir and interflow QI as a zero order reservoir
| [2] | S. Tilahun, C. D. Guzman, A. D. Zegeye, and E. K. Ayana, “the Semi-humid Ethiopian Highlands : A Case co d Pr oo f,” no. May, 2015, https://doi.org/10.1007/978-3-319-02720-3 |
| [5] | T. S. Steenhuis et al., “Predicting discharge and sediment for the Abay ( Blue Nile ) with a simple model,” vol. 3737, no. November, pp. 3728–3737, 2009, https://doi.org/10.1002/hyp |
| [17] | A. Van Griensven, V. U. Brussel, T. Meixner, S. Grunwald, and T. F. Bishop, “A Global Sensitivity Analysis Tool for the Parameters of Multi-Variable A global sensitivity analysis tool for the parameters of multi-variable catchment models,” no. July 2018, pp. 9–23, 2006, doi: 10.1016/j.jhydrol.2005.09.008. |
[2, 5, 17]
. The groundwater storage and the recharge to the interflow compartment, 𝑃𝑒𝑟𝑐, calculations depend on whether the groundwater storage has reached its maximum value of
. Recharge to the Interflow only occurs when the base flow reservoir is full.
PED-W Sediment model
In the sediment model, the two runoff source areas are considered the main sources of sediment. The seepage from the subsurface flow to the stream channels unlike earlier application of the model. Sediment yield is depending on the suspended sediment concentration and discharge of the rivers
| [14] | A. S. Collick et al., “A simple semi-distributed water balance model for the Ethiopian highlands,” vol. 3727, no. December, pp. 3718–3727, 2009, https://doi.org/10.1002/hyp |
[14]
. Erosion originates from the run-off producing zones. Erosion is negligible from the non-degraded hill slopes because almost all water infiltrates before it reaches the stream. The maximum sediment concentration that a stream can carry sediment derived from the stream power function.
Where, transport limiting capacity (Ct, g L-1) qr is the runoff rate per unit area from each runoff producing area (mm d-1), and at is a variable derived from the stream power [(g L1) (mm d-1)-n]. Variable at is a function of the slope, Manning’s roughness coefficient, slope length, and effective deposit ability (Guzman et al., 2013).
When cohesive soils eroded from the watershed sediment concentration will not always reach the transport limit. The sediment concentration is at the transport limit only when rills are actively formed in newly plowed soils (Tebebu et al., 2010). Once the rill networks has been formed no further erosion takes places, the sediment source becomes limited and the sediment concentration falls below the transport limit. In other cases, when the sediment concentration below transport limit, it does not down from sediment sources.
Where, as is the source limit and is assumed to be independent of the flow rate for a particular watershed (as compared to plots). Introducing a new variable, H, defined as the fraction of the runoff-producing area with active rill formation, the sediment concentration from the runoff-producing area (Cr, g L-1) can then be written as:
Base flow and interflow play an important role in the calculation of the daily sediment concentration and sediment yield. In monsoon climate, base flow at the end of the rainy season can be a significant portion of the total flow.
Sediment load per unit watershed area (Y, g m-2 d-1) can be obtained by multiplying sediment concentration from the runoff-producing area (Cr, g L-1) by the relative area and the flux per unit area (Zimale et al., 2016).
(10)
Where, qr1 and qr2 are the runoff rates expressed in depth units for contributing area A1 (fractional saturated area) and A2 (fractional degraded area), respectively. Theoretically, for both turbulent flow and a wide field, n is equal 0.4 ( Tilahun et al., 2015).
Potential Evapo-transpiration (PET)
For this specific study temperature based (Enku & Melesse, 2014) was used to calculate the daily potential evaporation during PED –W model calibration and validation.
Where, ETo is the reference evapo-transpiration (mm/day), n is 2.5 which can be calibrated for local conditions, k is Coefficient which can be calibrated for local conditions. The coefficient, k could be approximated as k = 48 ∗ − 330 where is the mean annual maximum temperature.
2.4.2. PED-W Model Sensitivity Analysis
Sensitivity analysis is defined as the technique of identifying the responsiveness of different parameters involving in the simulation of a hydrological model. Sensitivity analysis performed to limit the number of optimized parameters to obtain a good fit between the simulated and measured data. It helps to determine the relative ranking of which parameters most affect the output variance due to input variability
| [18] | T. Gebrie, W. R. Engineering, D. Tabor, and M. Jemberie, “Sediment Yield Modeling of Dedissa Sub Basin, Abay Basin,” pp. 120–127, 2016. |
[18]
, which reduces uncertainty of the out puts of the model and provides parameter estimation guidance for the calibration step of the model. In Parameter Efficient semi-Distributed watershed (PED-W) model the sensitivity was done manually by changing one parameter and all other parameters are kept constant.
2.4.3. PED-W Model Calibration and Validation
In order to know the model performance the model must be proven for its reliability, accuracy and predictive capabilities by using model calibration and validation. Calibration is tuning of model parameters based on checking results against observations to ensure the same response over time. Initially the model would not often give satisfactory result. Due to these reason hydrological models requires adjustment of the values of model parameters to match model output with measured data for selected period. After calibrating, the model should be validated against independent data without making farther adjustments to test model simulation capabilities. So, for this study model was calibrated and validated using 9 & 4 years recording discharge and sediment data of a river.
2.5. Model Evaluation and Selection Criteria
The performance of PED-WM was evaluated by using statistical measures to determine the quality and reliability of prediction when compared to observed values. In this study, the goodness of fit was quantified by four model evaluation statistics including: Nash-Sutcliffe efficiency (NSE), the ratio of root mean square error to the standard deviation of measured data (RSR) and coefficient of determination (R2).
The Nash-Sutcliffe simulation efficiency (NSE) indicates how well the plot of observed versus simulated value fits the 1:1 line. If the measured value is the same as all predictions, ENS is 1. If the ENS is between 0 and 1, it indicates deviations between measured and predicted values. If ENS is negative, predictions are very poor, and the average value of output is a better estimate than the model prediction (Nash and Sutcliffe, 1970). The R2 value is an indicator of strength of relationship between the observed and simulated values. NSE is calculated using Equation (
12).
(12)
Where, NSE is the prediction efficiency, is the observed condition at time i, is the mean of the observed values over all times, Pi is the predicted value at time I. The index i refer to storm number for calculating the prediction efficiencies for sediment yield, and refer to time during the storm for calculating the efficiency of a hydrograph for a particular storm.
Root mean square error (RMSE) observations standard deviation ratio (RSR) is calculated as the ratio of the RMSE and standard deviation of measured data, as shown in Equation (
13).
(13)
Many researchers use different models selection criteria to predict discharge and sediment yield in watershed
| [2] | S. Tilahun, C. D. Guzman, A. D. Zegeye, and E. K. Ayana, “the Semi-humid Ethiopian Highlands : A Case co d Pr oo f,” no. May, 2015, https://doi.org/10.1007/978-3-319-02720-3 |
| [11] | S. G. Setegn, R. Srinivasan, A. M. Melesse, and B. Dargahi, “SWAT model application and prediction uncertainty analysis in the Lake Tana Basin, Ethiopia,” vol. 367, no. September 2009, pp. 357–367, 2010, https://doi.org/10.1002/hyp |
| [14] | A. S. Collick et al., “A simple semi-distributed water balance model for the Ethiopian highlands,” vol. 3727, no. December, pp. 3718–3727, 2009, https://doi.org/10.1002/hyp |
| [19] | M. Dessie et al., “Analyzing runoff processes through conceptual hydrological modeling in the Upper Blue Nile Basin, Ethiopia,” pp. 5149–5167, 2014, https://doi.org/10.5194/hess-18-5149-2014 |
[2, 11, 14, 19]
. These criteria are including: Prediction accuracy as indicated by the level of agreement between measured and predicted discharge & soil erosion or sediment yield data, Potential to provide information about dominant soil erosion and sediment transport processes within catchments, Detail and amount of required input data and model calibration requirements and models potential for use in scenario studies of changing climate, land use, and land management. Appropriate models are need for the better assessment of the hydrology and soil erosion processes as well as decision support system for planning and implementations of appropriate measures
| [6] | S. G. Setegn, R. Srinivasan, and B. Dargahi, “Hydrological Modelling in the Lake Tana Basin, Ethiopia Using SWAT Model,” Open Hydrol. J., vol. 2, no. 1, pp. 49–62, 2008, https://doi.org/ 10.2174/1874378100802010049 |
[6]
.
For this study PED-W model was used to predict the discharge and sediment yield in Sore watershed. The selection is based on: i) the model simulated the major hydrological process in the catchments. ii) PED-W model is suitable for monsoonal climate watersheds. iii) Because of its semi-distributed nature and its structure is more physically-based than the structure of lumped model, and it is less demanding on input data than fully distributed model. On the other hand, PED model have been selected by many researchers due to recent innovation and account saturation excess runoff principles than others (infiltration process principles)
| [2] | S. Tilahun, C. D. Guzman, A. D. Zegeye, and E. K. Ayana, “the Semi-humid Ethiopian Highlands : A Case co d Pr oo f,” no. May, 2015, https://doi.org/10.1007/978-3-319-02720-3 |
| [5] | T. S. Steenhuis et al., “Predicting discharge and sediment for the Abay ( Blue Nile ) with a simple model,” vol. 3737, no. November, pp. 3728–3737, 2009, https://doi.org/10.1002/hyp |
| [20] | S. Molla and T. Abdisa, “INVESTIGATING CLIMATE CHANGE IMPACT ON STREAM FLOW OF BARO-AKOBO RIVER BASIN CASE STUDY OF BARO CATCHMENT,” vol. 6, no. 5, 2018. |
[2, 5, 20]
. PED model performed well in predicting discharge and sediment concentrations for three small upland watersheds in the Ethiopian highlands as well as for the entire Blue Nile Basin at the Sudan Ethiopian border
.
3. Result and Discussion
The findings and analyses of this study are reported in the following three main sub-sections: The results of this study were given for the PED-W hydrological model and included model calibration, validation, and efficiency evaluation. PED-W models were used to present the predicted stream flow and sediment for the Sore watershed, respectively. By comparing anticipated and actual discharge and sediment flow at the outlet point, the model's appropriateness for the Sore watershed in the Baro Akobo basin was determined.
3.1. PED-W Model Results of Sore Watershed
Both the observed and the simulated daily discharge and sediment for the Sore watershed show satisfactory agreement for the calibration period 2005 to 2013 (NSE = 0.40, 0.44), using a runoff contributing area of 0.088% (0.024% saturated and 0.064% degraded) and an aquifer half-life of 70 days and 64 days, respectively. Once more, throughout the validation period of 2014 to 2018, the anticipated and actual daily discharge and sediment yielded inadequate results (NSE = 0.22, -0.82). In the Sore watershed, monthly calibration and validation findings for discharge indicate acceptable agreement between observed and predicted values (NSE = 0.52, 0.47), whereas the results for sediment calibration and validation show reasonable agreement (NSE = 0.30, 0.19). The calibration of discharge and sediment in the Sore watershed revealed good and satisfactory agreement between the observed and simulated values according to the results of the coefficient of determination R2 and root mean square error (RMSE).
PED-W Calibrated Parameters:
The fractional areas for Sore watershed add up to only 0.69 or 69% (
Table 1). An area proportion of one means the calculated interflow, base flow and storm flow are equal to the long term discharge measured at the outlet. In other words since the long term average of the discharge in the PED-W model equals the average of the net precipitation (i.e., rainfall minus evaporation), all precipitation reaches the outlet eventually. However, the total contributing fractional areas of Sore watershed 0.69 or 69% means that the net input precipitation is much more than the discharge at the outlet (Sore near mettu gaging station). Because, the unaccounted net precipitation either flows subsurface under the gauge to the Sore near mettu or the discharge was not measured correctly. According to Moges et al.,
| [17] | A. Van Griensven, V. U. Brussel, T. Meixner, S. Grunwald, and T. F. Bishop, “A Global Sensitivity Analysis Tool for the Parameters of Multi-Variable A global sensitivity analysis tool for the parameters of multi-variable catchment models,” no. July 2018, pp. 9–23, 2006, doi: 10.1016/j.jhydrol.2005.09.008. |
[17]
the under prediction of high flows for Ribb river is the consequence of the increased bed levels, can observed clearly by
| [21] | T. Mekuriaw, “Evaluating Impact of Land-use / land-cover change on Surface runoff using Arc SWAT model in Sore and Geba watershed, Ethiopia Evaluating Impact of Land-Use / Land-Cover Change on Surface Runoff using Arc SWAT Model in Sore and Geba Watershed, Ethiopia,” no. October 2019, 2020, https://doi.org/10.7176/JEES/9-10-02 |
[21]
. The result shows that measured flow is much less than the predicted. The final reason for contributing areas not adding up to one is the missing rainfall, this is facilitated subsurface flows and reduces the flow at the gauging stations, and also for this study the same phenomenon was happened.
Table 1. PED parameters value of discharge and sediment load for Sore River.
Hydrology | Parameters | Unit | Calibration |
Discharge | Saturated area | Area A1 | % | 0.024 | |
A1 | mm | 300 | |
Degraded area | Area A2 | % | 0.064 | |
A2 | mm | 50 | |
Infiltration area | Area A3 | % | 0.6 | |
A3 | mm | 5 | |
Subsurface | | mm | 20 | |
| days | 70 | |
| days | 64 | |
Sediment | Sub- surface flow | | (gL-1) (mmd-1)-0.4 | 0.1 | |
| (gL-1) (mmd-1)-0.4 | 0.0 | |
Saturated area | | (gL-1) (mmd-1)-0.4 | 1.0 | |
| (gL-1) (mmd-1)-0.4 | 1.5 | |
Degraded area | | (gL-1) (mmd-1)-0.4 | 4.0 | |
| (gL-1) (mmd-1)-0.4 | 1.5 | |
A1, A2 and A3 are area fractions of the saturated, degraded and recharge hillside areas respectively. Smax is the maximum water storage capacity; BSmax is the maximum base flow storage of linear reservoir; t ½ is time taken in days to reduce volume of the base flow reservoir by half under no recharge conditions or base flow half-life tine in days; τ∗ is the duration of the period after a single rainstorm (until interflow ceases) or inter flow in days; as and at are coefficient of sediment source and transport model for components of base-flow (B), interflow (I), saturated area (1) and degraded area (2).
Both sediment parameter coefficients, transport limiting and source limiting, were found to demonstrate difference between the two basins (Upper Blue Nile and Baro-Akobo Basin). The transport and source limiting capacity from saturated area and degraded areas at the outlet point of Sore catchment were found to be at = 1 & as = 1.5 and at = 4 & as = 1.5 respectively. The result is found to be less than Ribb (at = 1) and Kessie (at = 5) watersheds in Upper Blue Nile Basin shown by
| [17] | A. Van Griensven, V. U. Brussel, T. Meixner, S. Grunwald, and T. F. Bishop, “A Global Sensitivity Analysis Tool for the Parameters of Multi-Variable A global sensitivity analysis tool for the parameters of multi-variable catchment models,” no. July 2018, pp. 9–23, 2006, doi: 10.1016/j.jhydrol.2005.09.008. |
[17]
. There is no clear reason why this should be the case, but it may be the active gully formation and it is the reason why in Sore watershed (smallest area) time of concentration is much more than Ribb and Kessie (largest area).
3.1.1. PED-W Sensitivity Analysis
The results of sensitivity analysis in stream flow gave the degree of sensitivity of nine parameters which was important for the manual calibration methods. Among these parameters the saturated area (A1), degraded area (A2), hill- side area (A3), maximum soil storage for base flow (BSmax) and base flow half-life (t
1/2) are sensitive parameters. From nine inputs PED- W model parameter five parameters were found the most sensitive, including: saturated area (A1), degraded area (A2), hillside (A3), maximum soil storage in saturated area (Smax) and recession coefficient (K). Portion of infiltration area, A3 was the most sensitivity parameters for both watersheds, meaning maximum runoff were generated from the hillside area. Similarly, in sediment load analysis sensitivity was done by manual calibration methods by using two parameters: including sediment transport and sediment source from A1 (saturated area) and A2 (degraded area) (at, as). From these parameters sediment transport (transport limit) from degraded area is the most sensitivity for the watershed. The degree of sensitivity of the parameters is different in different watershed (
Table 2).
Table 2. Calibrated parameters for PED-W model in to sensitivity watersheds and their sensitivity rank (discharge and sediment).
| Parameters | Sensitivity rank |
Discharge component | Area, A1 | 2 |
A1 | 9 |
Area, A2 | 3 |
A2 | 8 |
Area, A3 | 1 |
A3 | 5 |
| 4 |
| 7 |
| 2 |
Sediment component | | 1 |
| 2 |
3.1.2. PED-W Model Calibration and Validation
For PED-W model, all nine input parameters for discharge and six parameters for sediment were calibrated. The starting values for calibrating parameter were based on
| [5] | T. S. Steenhuis et al., “Predicting discharge and sediment for the Abay ( Blue Nile ) with a simple model,” vol. 3737, no. November, pp. 3728–3737, 2009, https://doi.org/10.1002/hyp |
| [15] | C. D. Guzman, S. A. Tilahun, A. D. Zegeye, and T. S. Steenhuis, “Suspended sediment concentration – discharge relationships in the ( sub- ) humid Ethiopian highlands,” pp. 1067–1077, 2013, https://doi.org/10.5194/hess-17-1067-2013 |
[5, 15]
for discharge and
| [14] | A. S. Collick et al., “A simple semi-distributed water balance model for the Ethiopian highlands,” vol. 3727, no. December, pp. 3718–3727, 2009, https://doi.org/10.1002/hyp |
[14]
for sediment. These initial values were changed manually through randomly varying input parameters in order that the best “closeness “and “goodness of-fit” was achieved between predicted and observed suspended sediment flow in the watersheds. The hydrograph shape for the Sore watershed from 2005 to 2013 was calibrated in the PED-W model after the sediment was calibrated. From 2014 to 2018, the calibrated model underwent validation. With an NSE of 0.44 for the calibration period and -0.82 for the validation period, the sediment was either predicted or simulated at a daily time step. The model was calibrated with an NSE of 0.47 and 0.19 for the Sore watershed during the calibration period, showing a reasonable and usable difference between the observed and simulated sediment load throughout the validation period. The observed and simulated sediment result of the Sore watershed was lower than
| [17] | A. Van Griensven, V. U. Brussel, T. Meixner, S. Grunwald, and T. F. Bishop, “A Global Sensitivity Analysis Tool for the Parameters of Multi-Variable A global sensitivity analysis tool for the parameters of multi-variable catchment models,” no. July 2018, pp. 9–23, 2006, doi: 10.1016/j.jhydrol.2005.09.008. |
[17]
at the Ribb watershed, Upper Blue Nile Basin, throughout the calibration and validation period of the PED-W model on a daily time step NSE value of (0.44, -0.82).
Table 3. Calibration & validation performance of discharge (PED-W model).
| description | Daily | Monthly |
R2 | NSE | RMSE | R2 | NSE | RMSE |
Sore | Calibration | 0.44 | 0.40 | 2.16 | 0.59 | 0.52 | 10.04 |
Validation | 0.50 | 0.22 | 2.53 | 0.63 | 0.30 | 12.58 |
Table 4. Calibration and validation performance of sediment yield by PED-W model.
| description | Daily | Monthly |
R2 | NSE | RMSE | R2 | NSE | RMSE |
Sore | Calibration | 0.52 | 0.44 | 0.04 | 0.66 | 0.47 | 0.18 |
Validation | 0.49 | -0.82 | 0.00 | 0.66 | 0.19 | 0.22 |
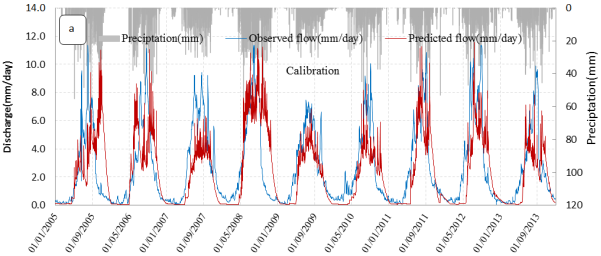
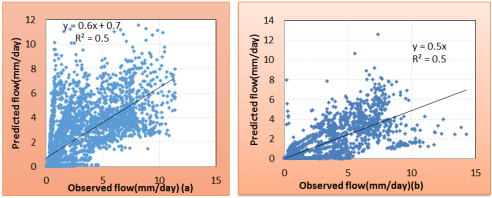
Based on the Nash and Sutcliffe efficiency, the coefficient of determination and R2 results from the calibration period of 2002 to 2011 (0.62 and 0.55), and the hydrograph pattern for the Sore watershed, it can be seen that the relationship between the daily observed and simulated sediment load was satisfactory (
Figure 3). For the Sore watershed over the calibration and validation periods, the hydrograph displays the observed and simulated discharge and sediment linked peak to peak, rising to rising, and recession to recession.
Figure 3. Daily predicted and observed stream flow for Sore watershed during (a)calibration and (b) validation period (2005-2013) and (2014-2018).
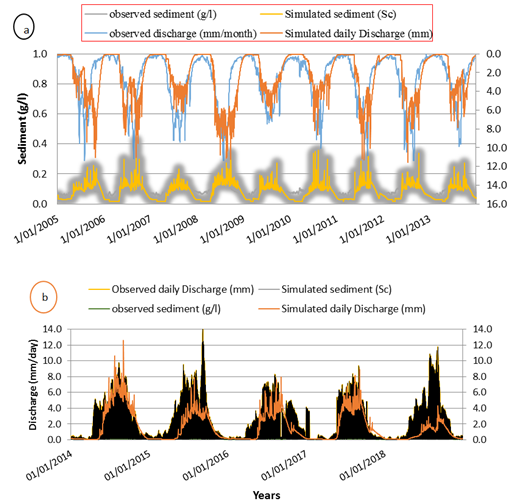
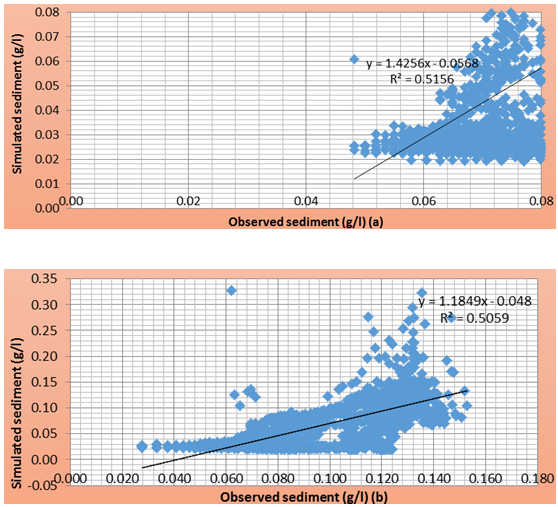
Figure 4. Daily predicted and observed sediment for Sore watershed during (a) calibration and (b) validation period (2005-2013) and (2014-2018).
The Sore watershed's monthly calibration reveals that the model was able to simulate the peak flows and sediment loads in a moderately accurate manner (Good for stream flow and sediment load), as well as the characteristics of dry periods. For flow and sediment load, respectively, the Nash-Sutcliffe Efficiency (NSE) values were 0.52 and 0.47. This demonstrates a good match between the simulated and measured flow and sediment. Results that were predicted outperformed those that were simulated. Problems with discharge and sediment measurement as well as shortcomings in the chosen hydrological models were to blame for this.
Figure 5. Daily observed and simulated discharge for Sore watershed a) Calibration and b) Validation period (2005-2013) and (2014-2018).
Figure 6. Daily observed and simulated sediment for Sore watershed a) Calibration and b) Validation period (2005-2013) and (2014-2018).
3.1.3. Discharge & Sediment Yield
In this study, the PED models were used to forecast the sediment yield at Sore near Mettu as well as their relative distribution among the sub basins. These models were calibrated and validated at the Sore watershed gauging station. Based on this simulation, the daily and monthly average yearly sediment yields for the Sore watershed at the Sore near Mettu outlet are 0.08 g/l and 2.94 g/l on average from 2005 to 2013, respectively. Similarly, simulated discharge levels at the same outlet point are higher than those that were observed during both the calibration and validation periods. The lack of prior research on the watershed by PED made it challenging to compare and build the daily and monthly simulated values of the PED models.
Table 5. Average values of observed and simulated discharge and sediment yield by PED-W model.
| Observed values | Simulated values |
Parametres | Calibration | Validation | Calibration | Validation |
Daily | monthly | Daily | monthly | Daily | monthly | Daily | monthly |
Discharge (mm) | 2.68 | 81.55 | 3.06 | 93.09 | 2.26 | 68.74 | 1.56 | 47.4 |
Sediment (g/l) | 0.10 | 2.49 | 0.1 | 2.14 | 0.08 | 2.96 | 0.07 | 3.04 |
3.2. Model Results Comparison
During the Sore watershed's calibration and validation periods, a daily time step of the observed sediment was reproduced using the PED model with NSE of 0.44 and -0.82, R2 of 0.52 and 0.49, and RMSE of 0.04 and 0.01. Similar to that, the catchment was calibrated and verified at monthly time steps, with RMSE of 0.18 and 0.22 at the outflow point, NSE of (0.47 and 0.19), R2 of 0.66 and 0.66, and NSE of (0.47 and 0.19). The result of PED-W model on discharge & sediment prediction was less than the similar studies in Baro Akobo Basin, Baro catchment
| [20] | S. Molla and T. Abdisa, “INVESTIGATING CLIMATE CHANGE IMPACT ON STREAM FLOW OF BARO-AKOBO RIVER BASIN CASE STUDY OF BARO CATCHMENT,” vol. 6, no. 5, 2018. |
| [21] | T. Mekuriaw, “Evaluating Impact of Land-use / land-cover change on Surface runoff using Arc SWAT model in Sore and Geba watershed, Ethiopia Evaluating Impact of Land-Use / Land-Cover Change on Surface Runoff using Arc SWAT Model in Sore and Geba Watershed, Ethiopia,” no. October 2019, 2020, https://doi.org/10.7176/JEES/9-10-02 |
[20, 21]
. They applied SWAT model to predict discharge of the catchment, very good agreement between observed and simulated values.
Although, PED-W model data input requirement is less relative to SWAT model, the overall model performance indicated that PED-W model at daily time step was less accurate and unsuitable to simulate flow and sediment in sore watershed at daily time steps. Because, PED-W model runoff simulations mechanisms were based on saturation excess and the sediment model scaling up plot erosion estimates. For monthly time steps of discharge and sediment calibration and validation of PED model result was proportionally the same as SWAT model applied previously.