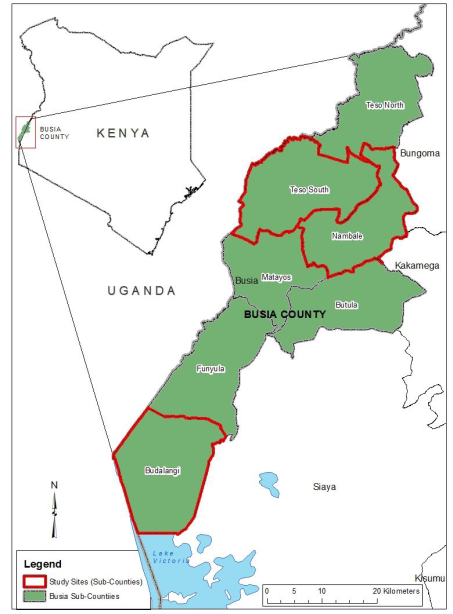
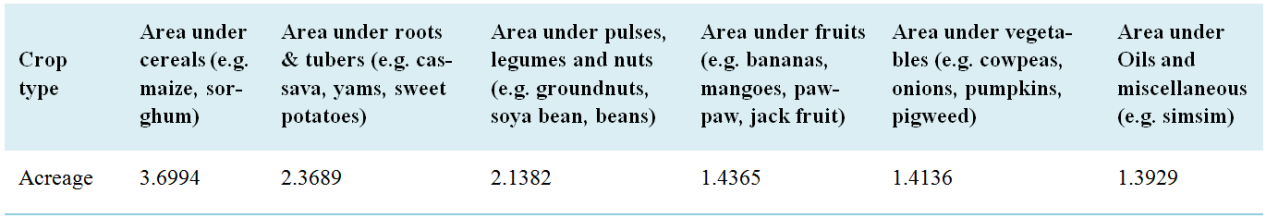
Food insecurity is a major problem in Busia County as studies show that 54 percent of households face food insufficiency and child malnutrition. This problem is compounded by small land holdings per household, with just 155,990 acres under food crops. Studies that have been done in the County to show the major food crops that are cultivated, however, no single one has been done showing the variations of these food crops within regions, while it is well known that diversity in terms of space has a bearing in food security at household level. This research sought to find out how food crops are diversified within space and its implications on household food security. Mixed design approach was used (descriptive and correlational). Nine research assistants were involved to collect data in the cropping season using interview schedules and observation schedules. Primary data was collected in one cropping season using interview and observation schedules. Gibbs and Martins Index of crop diversification was applied to determine crop diversification. Household Dietary Diversity Score (HDDS) was used to determine food security status. Multi-stage mixed sampling techniques involving purposive, simple random stratified proportionate was used. Qualitative data was used to address research questions while quantitative data addressed the hypotheses. The results showed that there was a wide range of food crops grown in the County with cereals taking the largest portion while oils and miscellaneous crops had the lowest acreage. The study further revealed that Busia County had household food security index of 3.52 in the range of 1 to 6. It also found no statistically significant difference in regional diversification of food crops (p= .126). Finally, it revealed a very low negative correlation (r= -.080) with an insignificant relationship (p= .13) between crop diversification and household food security.
| Published in | World Journal of Agricultural Science and Technology (Volume 2, Issue 2) |
| DOI | 10.11648/j.wjast.20240202.13 |
| Page(s) | 54-68 |
| Creative Commons |
This is an Open Access article, distributed under the terms of the Creative Commons Attribution 4.0 International License (http://creativecommons.org/licenses/by/4.0/), which permits unrestricted use, distribution and reproduction in any medium or format, provided the original work is properly cited. |
| Copyright |
Copyright © The Author(s), 2024. Published by Science Publishing Group |
Spatial Analysis, Crop Diversification, Food Crops, Food Security, Busia County
Characteristic | Frequency | Percent |
|---|---|---|
Sub-county (n=384) | ||
Butula | 129 | 33.6 |
Bunyala | 129 | 33.6 |
Teso South | 126 | 32.8 |
Total | 384 | 100.0 |
Ward (n=384) | ||
Kingandole | 43 | 11.2 |
Marachi Central | 43 | 11.2 |
Elugulu | 43 | 11.2 |
Bwiri | 43 | 11.2 |
Ageng'a Nanguba | 43 | 11.2 |
Nangina | 43 | 11.2 |
Chakol South | 43 | 11.2 |
Chakol North | 43 | 11.2 |
Ang'orom | 40 | 10.4 |
Total | 384 | 100.0 |
Household head (n=380) | ||
Father | 279 | 73.4 |
Mother | 89 | 23.4 |
Child-headed | 12 | 3.2 |
Total | 380 | 100.0 |
Level of education of household head (n=384) | ||
Didn't complete class 8 | 89 | 23.2 |
Kenya Certificate of Primary Education (KCPE) | 213 | 55.5 |
Kenya Certificate of Secondary Education (KCSE) | 67 | 17.4 |
College graduate | 9 | 2.3 |
University graduate | 6 | 1.6 |
Total | 384 | 100.0 |
Household size (n=384) | ||
1-3 | 82 | 21.4 |
4-6 | 188 | 49.0 |
7-10 | 81 | 21.1 |
> 10 | 33 | 8.6 |
Total | 384 | 100.0 |
Family land size in acres (n=384) | ||
< 0.49 | 23 | 6.0 |
0.5-1.49 | 95 | 24.7 |
1.5-2.99 | 100 | 26.0 |
3-4.49 | 79 | 20.6 |
> 4.5 | 87 | 22.7 |
Total | 384 | 100.0 |
Land size on food crops (n=380) | ||
< 0.25 | 24 | 6.3 |
0.25-0.49 | 19 | 5.0 |
0.5-0.99 | 82 | 21.6 |
1-1.25 | 14 | 3.7 |
>1.25 | 241 | 63.4 |
Total | 380 | 100.0 |
Land ownership (n=374) | ||
Collective/communal | 23 | 6.1 |
Individual | 351 | 93.9 |
Total | 374 | 100.0 |
Land registration status (n=368) | ||
Titled | 222 | 60.3 |
Not titled | 146 | 39.7 |
Total | 368 | 100.0 |
Item | Response | Likelihood | Response | |||||||
|---|---|---|---|---|---|---|---|---|---|---|
No | Not sure | Yes | Total | Rarely | Sometimes | Often | Total | |||
In the past 24 hours, did you worry that your household would not have enough food? | n | 203 | - | 181 | 384 | How often it happened | 99 | 70 | - | 177 |
f | 52.9 | 47.1 | 100 | 59.9 | 39.5 | 4.5 | 100 | |||
In the past 24 hours, were you or any household member not able to eat the kinds of foods you preferred because of a lack of resources? | n | 174 | 210 | 384 | How often it happened | 92 | 100 | 18 | 210 | |
f | 45.3 | 54.7 | 43.8 | 47.6 | 8.6 | 100 | ||||
In the past 24 hours, did you or any household member have to eat some foods that you really did not want to eat because of a lack of resources to obtain other types of food? | n | 234 | 150 | 384 | How often it happened | 68 | 77 | 5 | 150 | |
f | 60.9 | 39.1 | 100 | 45.3 | 51.3 | 3.3 | 100 | |||
In the past 24 hours, did you or any household member have to eat a smaller meal than you felt you needed because there was not enough food? | n | 282 | 102 | 384 | How often it happened | 45 | 52 | 5 | 102 | |
f | 73.4 | 26.6 | 100 | 44.1 | 51.0 | 4.9 | 100 | |||
In the past 24 hours, did you or any other household member have to eat fewer meals in a day because there was not enough food? | n | 198 | 10 | 169 | 377 | How often it happened | 78 | 100 | 8 | 186 |
f | 52.5 | 27 | 44.8 | 100 | 41.9 | 53.8 | 4.3 | 100 | ||
In the past 24 hours, was there ever no food to eat of any kind in your household because of lack of resources to get food? | n | 286 | 86 | 372 | How often it happened | 4 | 4 | |||
f | 76.9 | 23.1 | 100 | 100 | 100 | |||||
Food class variation | Frequency | Percent |
|---|---|---|
4 types | 154 | 42.2 |
3 types | 79 | 21.6 |
2 types | 65 | 17.8 |
5 types | 55 | 15.1 |
1 type | 9 | 2.5 |
All (6) types | 3 | .8 |
Total | 365 | 100.0 |
Area under various crop types | Count | Response range (land size in acres) | Total | ||||
|---|---|---|---|---|---|---|---|
< 0.25 | 0.25-0.49 | 0.5-0.99 | 1-1.25 | >1.25 | |||
Cereals (e.g. maize, sorghum) | n | 25 | 28 | 93 | 54 | 126 | 326 |
f | 7.7 | 8.6 | 28.5 | 16.6 | 38.7 | 100 | |
Roots & tubers (e.g. cassava, yams, sweet potatoes) | n | 105 | 78 | 82 | 45 | 18 | 328 |
f | 32.0 | 23.8 | 25.0 | 13.7 | 5.5 | 100 | |
Vegetables (e.g. cowpeas, onions, pumpkins, pigweed) | n | 195 | 78 | 22 | - | - | 295 |
f | 66.1 | 26.4 | 7.5 | - | 100 | ||
Fruits (e.g. bananas, mangoes, pawpaw, jack fruit) | n | 183 | 41 | 15 | 13 | - | 252 |
f | 72.6 | 16.3 | 6.0 | 5.2 | - | 100 | |
Pulses, legumes and nuts (e.g. groundnuts, soybean, beans) | n | 92 | 41 | 53 | 24 | 7 | 217 |
f | 42.4 | 18.9 | 24.4 | 11.1 | 3.2 | 100 | |
Oils and miscellaneous (e.g. simsim) | n | 17 | 11 | - | - | - | 28 |
f | 60.7 | 39.3 | - | - | - | 100 | |
N | Minimum | Maximum | Mean | |
|---|---|---|---|---|
How many types of food did your household consume in the last 24 hours (in the category of: cereals, roots and tubers, vegetables, fruits, pulses, legumes and nuts, oils and miscellaneous) | 365 | 1.00 | 6.00 | 3.5205 |
Valid N (list wise) | 365 |
Sum of Squares | df | Mean Square | F | Sig. | |
|---|---|---|---|---|---|
Between Groups | 1.885 | 8 | 15.043 | 2.351 | .126 |
Within Groups | 2361.097 | 369 | 6.399 | ||
Total | 2376.140 | 377 |
Diversity index | Pearson Correlation | 1 | -.080 |
Sig. (2-tailed) | .131 | ||
N | 371 | 356 | |
Household food security | Pearson Correlation | -.080 | 1 |
Sig. (2-tailed) | .131 | ||
N | 356 | 365 |
HDDS | Household Dietary Diversity Score |
GDP | Gross Domestic Product |
SDGs | Sustainable Development Goals |
SSA | Sub-Saharan Africa |
CDI | Crop Diversification Index |
ANOVA | Analysis of Variance |
KCPE | Kenya Certificate of Primary Education |
KCSE | Kenya Certificate of Secondary Education |
| [1] | USAID. (2023). Agriculture, Food and Water Security. Washington DC: United States Agency For International Development. |
| [2] | United Nations Kenya (2023). Our Work on the Sustainable Development Goals in Kenya. Nairobi: United Nations. Retrieved from |
| [3] | Adjimoti, G. O., Kwadzo, G. T. M. (2018). Crop diversification and household food security status: evidence from rural Benin. Agric & Food Secur 7, 82 |
| [4] | World Bank. (2019). Kenya Economic Update: Transforming Agricultural Productivity to Achieve Food Security for All. Retrieved from |
| [5] | IFAD (2022). Investing in rural people in Kenya. Retrieved from |
| [6] |
Busia County Government. (2018). County Integrated Development Plan 2018-2022. Retrieved from
https://www.devolution.go.ke/wp-content/uploads/2020/02/Busia-CIDP-2018-2022.pdf |
| [7] | Republic of Kenya (2016). Busia County Biodiversity Policy. Busia: the county government of busia. |
| [8] |
Adeleke S., Abdul, B. K, & Zuzana B. (2010). Smallholder Agriculture in East Africa: Trends, Constraints and Opportunities. African Development Bank Group. Retrieved from
https://www.afdb.org/sites/default/files/documents/publications/working_105_pdf_d.pdf |
| [9] | Manana, M. N. G. (2014). Challenges faced in the management of small scale farm enterprises in trans-nzoia county, Kenya. International Journal of Advanced Rsearch, volume 2, issue 7 845-950. |
| [10] | Makate C, Wang R, Makate M, Mango N. Crop diversification and livelihoods of smallholder farmers in Zimbabwe: adaptive management for environmental change. Springer Plus. 2016; 5(1): 1 18. |
| [11] | Mango, N. (2018). The role of crop diversification in improving household food security in central Malawi. Retrieved from |
| [12] | Di Falco S, Chavas J. P. On crop biodiversity, risk exposure and food security in the highlands of Ethiopia. Am J Agric Econ. 2009; 91(3): 599–613. |
| [13] | Appiah-Twumasi, M. & Asale, M. A. (2022). Crop diversification and farm household food and nutrition security in Northern Ghana. Environ Dev Sustain. 2022 Oct 15: 1 29. Retrieved from |
| [14] | Kundu, K., & Chattopadhyay, A. K. (2018). Spatio-temporal Variations of Crop Diversification. A Block-level Study in West Bengal. Economic and Political weekly. Vol 53. 21. Retrieved from |
| [15] | Gogoi, M. (2018). An Analysis of Spatio-Temporal Changes in the Pattern of Crop Diversification in Undivided Sivasagar District, Assam (India). Journal of Emerging Technologies and Innovative Research (JETIR). Volume 5, Issue 11. Retrieved |
| [16] | Hernández-Ochoa, I. M., Gaiser, T., Kersebaum, K., Webber, H., Seidel, S. J. Grahmann, K., & Ewert, F. Model-based design of crop diversification through new field arrangements in spatially heterogeneous landscapes. A review. Agronomy for Sustainable Development, 2022, 42 (4), pp. 74. |
| [17] |
Samanthi. (2020). Difference Between Temporal and Spatial Heterogeneity. Retrieved from
https://www.differencebetween.com/difference-between-temporal-and-spatial-heterogeneity/ |
| [18] | FAO. (2017). The future of food and agriculture. Trends and challenges. Rome: FAO. Retrieved from |
| [19] | Maritim, N. & Nick, D. (2021). The key to food security is crop diversification. Farm Kenya. The standard, Jan 05, 2021. Retrieved from |
| [20] | FAO. (2008). An Introduction to the Basic Concepts of Food Security. Rome: EC-FAO Food Security Programme. Retrieved from |
| [21] | Herforth, A. W. (2010). Promotion of traditional African vegetables in Kenya and tanzania: a case study of an intervention representing. Cornell University; 2010. |
| [22] | Furman, B., Noorani, A., and Mba, C. (2021). On-Farm Crop Diversity for Advancing Food Security and Nutrition. Retrieved from |
| [23] | MoALF. 2016. Climate Risk Profile for Busia. Kenya County Climate Risk Profile Series. The Kenya Ministry of Agriculture, Livestock and Fisheries (MoALF), Nairobi, Kenya. |
| [24] | Romanchuk, J. (2023). The Four Types of Research Design Everything You Need to Know. Retrieved from |
| [25] | Bakhsh, A. (2023). Purpose of correlational research. Retrieved from |
| [26] |
Gerald, J., & Dorothy, R. (2023). Household dietary diversity Score (HDDS). Retrieved from
https://inddex.nutrition.tufts.edu/data4diets/indicator/household-dietary-diversity-score-hdds |
| [27] |
Agriculture and Food Authority (2024). Food crops: overview. Retrieved from
https://food.agricultureauthority.go.ke/index.php/sectors/overview |
| [28] |
Kenya News Agency (2024). Root & Tuber Crops Important In Building Resilience In Food System. Retrieved from
https://www.kenyanews.go.ke/root-tuber-crops-important-in-building-resilience-in-food-system/ |
| [29] |
Biovision Africa Trust. (2024). Traditional starch sources for food and nutrition security. Retrieved from
https://theorganicfarmer.org/traditional-starch-sources-for-food-and-nutrition-security/ |
| [30] | Tadese, K. T. (2023). The Role of Vegetables in Ensuring Food Security and Poverty Alleviation: The Case of Ethiopia. J Nutr Food Sci, Vol. 13 Iss. 3 No: 1000020. Retrieved from |
| [31] |
Greenlife Crop Protection Africa. (2024). The role of pulses in offering food security. Retrieved from
https://www.greenlife.co.ke/the-role-of-pulses-in-offering-food-security/ |
| [32] |
Government of Kenya (2014). Agricultural Sector Development Support Programme (ASDSP). Volume 1. Household baseline survey report Busia County. Retrieved from
https://www.kalro.org/kalroknowledgebank/doc/Busia%20Volume%201%20HH%20Baseline-1.pdf |
| [33] | Nutrition in City Ecosystems. (2024). City Overview on Food and nutrition of: Busia City, Kenya. Retrieved from |
APA Style
Odhiambo, O. P., Njeri, N. M., Maingi, M. M. (2024). Spatial Analysis of Food Crop Diversification in Busia County-Kenya: Implications on Household Food Security. World Journal of Agricultural Science and Technology, 2(2), 54-68. https://doi.org/10.11648/j.wjast.20240202.13
ACS Style
Odhiambo, O. P.; Njeri, N. M.; Maingi, M. M. Spatial Analysis of Food Crop Diversification in Busia County-Kenya: Implications on Household Food Security. World J. Agric. Sci. Technol. 2024, 2(2), 54-68. doi: 10.11648/j.wjast.20240202.13
AMA Style
Odhiambo OP, Njeri NM, Maingi MM. Spatial Analysis of Food Crop Diversification in Busia County-Kenya: Implications on Household Food Security. World J Agric Sci Technol. 2024;2(2):54-68. doi: 10.11648/j.wjast.20240202.13
@article{10.11648/j.wjast.20240202.13,
  author = {Ongang’a Peter Odhiambo and Ngugi Margaret Njeri and Mwatu Morris Maingi},
  title = {Spatial Analysis of Food Crop Diversification in Busia County-Kenya: Implications on Household Food Security
},
  journal = {World Journal of Agricultural Science and Technology},
  volume = {2},
  number = {2},
  pages = {54-68},
  doi = {10.11648/j.wjast.20240202.13},
  url = {https://doi.org/10.11648/j.wjast.20240202.13},
  eprint = {https://article.sciencepublishinggroup.com/pdf/10.11648.j.wjast.20240202.13},
  abstract = {Food insecurity is a major problem in Busia County as studies show that 54 percent of households face food insufficiency and child malnutrition. This problem is compounded by small land holdings per household, with just 155,990 acres under food crops. Studies that have been done in the County to show the major food crops that are cultivated, however, no single one has been done showing the variations of these food crops within regions, while it is well known that diversity in terms of space has a bearing in food security at household level. This research sought to find out how food crops are diversified within space and its implications on household food security. Mixed design approach was used (descriptive and correlational). Nine research assistants were involved to collect data in the cropping season using interview schedules and observation schedules. Primary data was collected in one cropping season using interview and observation schedules. Gibbs and Martins Index of crop diversification was applied to determine crop diversification. Household Dietary Diversity Score (HDDS) was used to determine food security status. Multi-stage mixed sampling techniques involving purposive, simple random stratified proportionate was used. Qualitative data was used to address research questions while quantitative data addressed the hypotheses. The results showed that there was a wide range of food crops grown in the County with cereals taking the largest portion while oils and miscellaneous crops had the lowest acreage. The study further revealed that Busia County had household food security index of 3.52 in the range of 1 to 6. It also found no statistically significant difference in regional diversification of food crops (p= .126). Finally, it revealed a very low negative correlation (r= -.080) with an insignificant relationship (p= .13) between crop diversification and household food security.
},
 year = {2024}
}
TY  - JOUR
T1  - Spatial Analysis of Food Crop Diversification in Busia County-Kenya: Implications on Household Food Security

AU  - Ongang’a Peter Odhiambo
AU  - Ngugi Margaret Njeri
AU  - Mwatu Morris Maingi
Y1  - 2024/05/30
PY  - 2024
N1  - https://doi.org/10.11648/j.wjast.20240202.13
DO  - 10.11648/j.wjast.20240202.13
T2  - World Journal of Agricultural Science and Technology
JF  - World Journal of Agricultural Science and Technology
JO  - World Journal of Agricultural Science and Technology
SP  - 54
EP  - 68
PB  - Science Publishing Group
SN  - 2994-7332
UR  - https://doi.org/10.11648/j.wjast.20240202.13
AB  - Food insecurity is a major problem in Busia County as studies show that 54 percent of households face food insufficiency and child malnutrition. This problem is compounded by small land holdings per household, with just 155,990 acres under food crops. Studies that have been done in the County to show the major food crops that are cultivated, however, no single one has been done showing the variations of these food crops within regions, while it is well known that diversity in terms of space has a bearing in food security at household level. This research sought to find out how food crops are diversified within space and its implications on household food security. Mixed design approach was used (descriptive and correlational). Nine research assistants were involved to collect data in the cropping season using interview schedules and observation schedules. Primary data was collected in one cropping season using interview and observation schedules. Gibbs and Martins Index of crop diversification was applied to determine crop diversification. Household Dietary Diversity Score (HDDS) was used to determine food security status. Multi-stage mixed sampling techniques involving purposive, simple random stratified proportionate was used. Qualitative data was used to address research questions while quantitative data addressed the hypotheses. The results showed that there was a wide range of food crops grown in the County with cereals taking the largest portion while oils and miscellaneous crops had the lowest acreage. The study further revealed that Busia County had household food security index of 3.52 in the range of 1 to 6. It also found no statistically significant difference in regional diversification of food crops (p= .126). Finally, it revealed a very low negative correlation (r= -.080) with an insignificant relationship (p= .13) between crop diversification and household food security.

VL  - 2
IS  - 2
ER  -
School of Science, Technology and Engineering, Alupe University, Busia, Kenya
Biography: Ongang’a Peter Odhiambo is a holder of Doctor of Philosophy in Agricultural Education and Extension from Kisii University, with more than five years of University teaching. He is currently a lecturer of Agricultural Education and Extension at Alupe University. Dr. Ongang’a has extensive research experience in agricultural extension and teaching backed up by the various workshops and conferences attended, as well as publications in this field.
Research Fields: Agriculture subject teaching in Kenya with focus on non-conventional approaches to agriculture teaching in schools with bias in supervised agricultural experiences where learners are actively involved in practical learning processes; Youth participation in agriculture at local levels is another area of focus; Establishing Schools that are Responsive to the Needs of Competency Based Agricultural Education: the Future Farmers of Kenya Project.

School of Education and Social Sciences, Alupe University, Busia, Kenya
Biography: Ngugi Margaret Njeri is a Lecturer of Community Development in the School of Education and Social Sciences and a Member of Exams Committee in School of Education and Social Sciences Member of ISSBD
Research Fields: Female Entrepreneurship studies; Mental Health studies; Climate change studies.

School of Education and Social Sciences, Alupe University, Busia, Kenya
Biography: Mwatu Morris Maingi is a lecturer of Geography at Alupe Uni-versity. He is a holder of Doctor of Philosophy in Geography from Egerton University, with more than five years of University teaching. Dr. Mwatu has extensive research experience in climate change and variability information dissemination for agricultural decision-making, livelihood vulnerability to climate change and variability and related adaptation strategies. He is a member of various professional bodies, attended various workshops and conferences as well as published in this field.
Research Fields: Climate change and variability information dissemination for agricultural decision-making; livelihood vulnerability to climate change and variability and adaptation strategies.

Information