Research Article | | Peer-Reviewed

Investigating Temporal-Spatial Compatibility of Magnetic Data from Madagascar Repeat Stations

Received: 14 July 2026     Accepted: 27 July 2026     Published: 27 August 2026
Views:       Downloads:
Abstract

Accurate regional geomagnetic field modeling is crucial for navigation, resource exploration, and solid-Earth geophysics. In Madagascar, however, field model consistency has been hindered by severe spatio-temporal irregularities in the reoccupation of its twenty-five-station repeat network, including the pivotal Antananarivo observatory, between 1983 and 2001. To overcome these data limitations, this comprehensive study evaluates the spatial and temporal compatibility of the Malagasy repeat station network to establish robust regional geomagnetic field models. Assuming negligible altitude variance across the island region, the parameterization framework relies exclusively on geographic latitude and longitude coordinates. Gauss coefficients were derived using two complementary modeling methods specifically suited for sparse, non-uniformly distributed datasets: regional harmonic analysis and surface polynomial modeling. Both techniques produced highly consistent and robust field representations for periods characterized by stable network geometry, notably 1983 through 1985. In sharp contrast, the 1986 dataset exhibited pronounced anomalous coefficients and residuals stemming from observational inconsistencies, necessitating its complete exclusion from subsequent calculations. A rigorous comparative evaluation revealed that regional harmonic models maintain far greater mathematical stability under non-uniform station distributions. Conversely, polynomial models suffer from boundary artifacts and produce unreliable extrapolation across unmonitored regions lacking observational data. Consequently, while both approaches perform comparably under dense spatial sampling, regional harmonic analysis proves markedly superior within data-sparse regimes. These findings highlight the absolute necessity of maintaining broad, uniformly distributed monitoring networks across the island. Furthermore, they provide a methodological framework for annual field interpolation, guide future cartographic mapping efforts, and strongly advocate for continued, systematic geomagnetic surveys across Madagascar to continually refine these essential regional field representations.

Published in World Journal of Applied Physics (Volume 11, Issue 3)
DOI 10.11648/j.wjap.20261103.12
Page(s) 40-53
Creative Commons

This is an Open Access article, distributed under the terms of the Creative Commons Attribution 4.0 International License (http://creativecommons.org/licenses/by/4.0/), which permits unrestricted use, distribution and reproduction in any medium or format, provided the original work is properly cited.

Copyright

Copyright © The Author(s), 2026. Published by Science Publishing Group

Keywords

Earth's Magnetic Field, Repeat Station, Harmonic Analysis, Polynomial Analysis, Gauss Coefficients, Data Reduction

1. Introduction
Since 1884, foreign missionaries have conducted measurements of magnetic field components in some regions of the Central Highlands and along the coasts of Madagascar. The reoccupation of these stations and/or the creation of new stations continued, leading to the establishment of the first repeat station network in 1920 by F. C. Brown . Besairie and Savourin furthered Brown’s work, publishing the first magnetic declination map of Madagascar in 1938. Reverend Father Cattala, a researcher at National Center of Scientific Research and later a senior researcher at Overseas Scientific and Technical Research Office, expanded these measurements by setting up a new network of magnetic stations . Alongside the establishment of these stations, magnetic measurements were carried out in isolated coastal locations by engineers from the French navy’s hydrographic missions, including Duperrey in 1825, Lieutenant de Bernardières in 1884, and Ensign Farvereau in 1886. Other researchers continued the magnetic exploration of Madagascar’s coasts. Large ships were used for these missions, and surveyors (« mpilanja ») in 1920 or automobiles in 1938 facilitated island routes.
A location qualifies as a measurement station if it meets three conditions : first, magnetic homogeneity meaning there are no or very few local anomalies with strong gradients; next, the absence of anthropogenic magnetic disturbances such as power lines or railway tracks; and then ease of access (for example, at airfields). Station descriptions were designed to ensure that an observer could easily relocate them. Each repeat station is named after the city where it is located, and these names are communicated to various magnetic data collection centers. Between 1983 and 1996, Madagascar maintained twenty five repeat stations. However, this network was not entirely homogeneous, as stations were primarily positioned for ease of access, mostly along the National Highway and near coastal airfields. Regular measurements at these repeat stations help update Madagascar’s magnetic maps, which are essential for air and maritime navigation safety, mineral exploration, natural resource assessments, and telecommunications. This study focuses on stations reoccupied from 1983 to 2001, as only these data are available in digital form. Data from magnetic survey campaigns conducted before 1983 are not accessible.
2. Methodologies for Analyzing Magnetic Data
The goal is to estimate the Gauss coefficients from the reduced data for each measurement year and to examine their evolution, which should show slow and regular temporal variation. The methodologies considered include compilation of available data, the principle of data reduction, spherical harmonic analysis (SHA), regional harmonic analysis, and surface polynomial analysis. .
2.1. Available Data from 1983 to 2001
A total of 25 repeat stations, including the Antananarivo observatory (TAN), have been intermittently reoccupied since 1983. Their names, geographic coordinates, and years of occupation are listed in Table 1, arranged in descending latitude order (from north to south). The reoccupation of stations has been irregular temporally and spatially. Some stations have data available for only single years, such as 1986 and 1996.
Table 1. Malagasy Repeat Stations Reoccupied During Magnetic Survey Campaigns from 1983 to 2001.

station

Name

Latitude

Longitude

Altitude

1983

1984

1985

1986

1990

1996

2001

DGS

Diégo Suarez

-12°21’00’’

49°17’40’’

74m

+

+

+

+

+

+

+

ABB

Ambilobe

-13°11’24’’

48°58’54’’

121 m

+

+

+

+

VHM

Vohémar

-13°22’04’’

50°00’00’’

67 m

+

+

+

+

ABJ

Ambanja

-13°38’24’’

48°27’06’’

83 m

+

+

+

SBV

Sambava

-14°16’39’’

50°10’27’’

148 m

+

+

+

+

THH

Antsohihy

-14°54’00’’

47°39’00’’

269 m

+

+

+

+

TLH

Antalaha

-14°59’51’’

50°19’16’’

73 m

+

+

+

+

PBG

Port-Berger

-15°34’48’’

47°37’18’’

308 m

+

+

+

MJG

Majunga

-15°39’57’’

46°21’03’’

44 m

+

+

+

+

+

+

MVT

Maevatanana

-16°57’11’’

46°49’57’’

1013 m

+

+

FNV

Fenerive-Est

-17°25’30’’

49°26’06’’

42 m

+

+

+

AZK

Ambatondrazaka

-17°47’32’’

48°26’12’’

650 m

+

+

+

TMV

Tamatave

-18°07’00’’

49°23’36’’

36 m

+

+

+

+

+

+

KZB

Ankazobe

-18°19’49’’

47°07’35’’

1213 m

+

MRG

Moramanga

-18°54’48’’

48°12’54’’

517 m

+

+

TAN

Antananarivo

-18°55’01’’

47°33’07’’

1375 m

+

+

+

+

+

+

+

TRB

Antsirabe

-19°49’50’’

47°03’04’’

1493 m

+

MDV

Morondava

-20°17’24’’

44°21’00’’

88 m

+

ABS

Ambositra

-20°32’51’’

47°14’40’’

868 m

+

MNJ

Mananjary

-21°12’17’’

48°21’24’’

54 m

+

FNT

Fianarantsoa

-21°26’15’’

47°07’06’’

1127 m

+

MRB

Morombe

-21°45’18’’

43°32’18’’

94 m

+

IHS

Ihosy

-22°24’34’’

46°10’07’’

971 m

+

TUL

Tuléar

-23°23’12’’

43°49’30’’

56 m

+

+

+

FDF

Fort Dauphin

-25°02’00’’

46°57’36’’

114 m

+

+

+

+

Total number of reoccupied stations for each year

6

6

6

14

13

21

11

Note: "+" indicates year of station reoccupation.
For 2001, two original reduced values of magnetic field components were recorded for each station (two values for F, I, and D per measurement).
These two reduced values E1 and E2 may differ slightly, representing absolute uncertainty, and the adopted value E is taken as the average:
E=E1+E22(1)
with the reduction error ΔE is then:
∆E = |E1 − E| = |E2 − E|(2)
2.2. Principe of Data Reduction
Measurements were performed during the dry season (August–October) to avoid accessibility issues. Measurements B(S, ti) at different times must be reduced to a common epoch ta. typically July 1st of the measurement year to represent annual average field values. Reduction is achieved under two hypotheses:
Uniform transient variation across nearby stations (verified for European observatories; distances typically <300 km) ,
Identity of secular variation over short periods (less than one year).
Formally, reduced fields are calculated using:
BS, ta=BS, ti-B0, ta+B0, ti(3)
where B(O, ti) and<B(O, ti)> are instantaneous and average fields at the observatory O acting as reference.
2.3. Spherical Harmonic Analysis (SHA)
SHA decomposes the geomagnetic potential into spherical harmonic coefficients assuming Maxwell’s equations:
B=0(4)
.B=0(5)
The potential satisfies Laplace’s equation (ΔV=0) and is expanded as:
Vr, θ, ϕ=aarn+1gnmcosmϕ+hnmsinmϕPnmcosθ(6)
Magnetic field components X, Y, Z are derived accordingly. Estimation of Gauss coefficients gnm, hnmfrom reduced values requires fairly uniform data coverage, which may be constrained in regional studies .
2.4. Regional Harmonic Analysis (RHA)
Regional harmonic analysis constitutes an advanced methodological adaptation of the classical spherical harmonic analysis (SHA), applied specifically to geomagnetic field studies where the available magnetic data are spatially restricted to a limited geographic area much smaller than the entire surface of the Earth (spherical domain) . Traditional spherical harmonic analysis is well-suited for global-scale datasets that encompass measurements distributed over nearly the entire globe. However, when data coverage is confined to a limited region, attempting to apply global SHA directly can lead to significant numerical instabilities and inaccuracies. This is due to the incomplete spatial sampling and the ill-conditioning of the inversion matrix used to estimate Gauss coefficients, which represent the harmonic components of the Earth's magnetic potential field .
To mitigate these issues, regional harmonic analysis modifies the formalism by appropriately redefining the harmonic basis functions and reducing the study domain to a spherical cap or a localized area. This approach entails several key features and strategies as follows:
1) Reduction of Domain Boundaries: By focusing on a limited geographic region, the mathematical problem is constrained to a portion of the spherical surface. Terms in the spherical harmonic expansion that contribute negligibly to the field within this restricted domain are systematically eliminated, optimizing the representation to the essential components relevant to that region.
2) Transformation of Global to Regional Coefficients: The classical global Gauss coefficients gnmand hnm (degree n, order m) are transformed into a set of regional harmonic coefficients Gk (where k = 1, 2,..., 15 in this context). These coefficients characterize the localized field variation and accommodate the limited spatial coverage without requiring the entire Earth’s data.
3) Mathematical Expression of the Regional Field Components: The magnetic field components X, Y, Z at any point within the region are expressed explicitly in terms of the regional coefficients Gkand the geographic coordinates:
X=-G1sinθ+G2cosθcosϕ+G3cosθsinϕ-3G4sin2θ+G5cos2θcosϕ+G6cos2θsinϕ+G7sin2θcos2ϕ+G8sin2θsin2ϕ-3G9sinθ5cos2θ-1+G105cos3θ-10cosθsin2θ-cosθcosϕ+G115cos3θ-10cosθsin2θ-cosθsinϕ+G12sinθ2cosθ-sinθcos2ϕ+G13sinθ2cos2θ-sin2θsin2ϕ+3G14cosθsin2θcos3ϕ+3G15cosθsin2θsin3ϕ(7)
Y=G2sinϕ-G3cosϕ+G5cosθsinϕ-G6cosθcosϕ+2G7sinθsin2ϕ-2G8sinθcos2ϕ+G105cos2θ-1sinϕ+G115cos2θ-1cosϕ+G12sin2θsin2ϕ-G13sin2θcos2ϕ-3G14sin2θsin3ϕ-3G15sin2θcos3ϕ(8)
Z=2G1cosθ+2G2sinθcosϕ+2G3sinθsinϕ+3G43cos2θ-1+3G5cosθsinθcosϕ+3G6cosθsinθsinϕ+3G7sin2θcos2ϕ+3G8sin2θsin2ϕ+4G9cosθ5cos2θ-3+4G105cos2θ-1sinθcosϕ+4G115cos2θ-1sinθsinϕ+4G12cosθsin2θcos2ϕ+4G13cosθsin2θsin2ϕ+4G14sin3θcos3ϕ+4G15sin3θsin3ϕ(9)
Here, θ is the colatitude (measured from the North Pole), and ϕ is the longitude.
The regional harmonic functions depend only on geographic latitude and longitude, aligning naturally with planar surface representations of ground-based station data. This is preferable over incorporating radial (altitudinal) dependencies, which in Madagascar are relatively small and could induce singularities or numerical inaccuracies due to the altitudinal homogeneity of the stations.
The regional harmonic approach allows the estimation of Gauss coefficients tailored for Madagascar, accommodating the spatial distribution and density of repeat stations more effectively than global models. This method isolates and characterizes the regional magnetic field while minimizing the influence of data not available outside the study area, thus enhancing the reliability of regional magnetic field maps crucial for navigational and geophysical applications.
This methodology is supported and validated in various studies addressing regional geomagnetic field modeling, including , which demonstrate improved numerical stability and accuracy for regional fields using this approach compared to classical global spherical harmonic expansions when data coverage is spatially limited.
To stabilize the inversion of regional Gauss or polynomial coefficients from sparse magnetic data, a Tikhonov regularization is applied. The model parameters m (coefficients) are determined by minimizing the objective function.
minmd-Gm2Lm2(10)
where d represents the data vector of reduced magnetic field measurements, G is the forward operator relating coefficients to observations, L is a discrete differential operator enforcing smoothness (e.g., spatial derivatives), and λ is the regularization parameter controlling the trade-off between data fit and model smoothness. For the regional harmonic analysis, penalizing higher-degree spherical harmonic coefficients ensures suppression of spurious oscillations, while in surface polynomial analysis, smoothness is enforced by limiting polynomial degree and penalizing coefficients of higher-order terms. The magnetic field’s physical constraint of zero divergence ߜ.B= 0 is incorporated either via basis functions or by including terms like Y sin θ in polynomial expansions, ensuring geophysical realism.
2.5. Surface Polynomial Analysis
Surface polynomial analysis represents an alternative and complementary approach to regional harmonic analysis for modeling the geomagnetic field over limited geographic areas. This method approximates the spatial variation of magnetic field components by polynomials in geographical coordinates, offering a flexible mathematical framework especially suitable when data coverage is restricted to relatively small regions .
The underlying mathematical foundation of polynomial analysis parallels the classical Taylor series expansion of a sufficiently differentiable function. For a univariate function f(x), expanded about a point x0, the Taylor series is:
fx=fx0+f'x0x-x0+f''x0x-x022!+f3x0x-x033!+...(11)
This expansion can be rewritten abstractly as a polynomial series:
fx=a0+a1x+a2x2+a3x3+(12)
where an are coefficients derived from the function's derivatives at x0.
In geomagnetic applications, the magnetic potential and field components depend on two spatial variables, typically latitude θ and longitude Ф. The generalized two-variable polynomial expansion of a function f(θ, Ф) can be expressed as:
fθ, ϕ=a0+a1θ+b1ϕ+a2θ2+b2ϕ2+a3θ3+b3ϕ3+...(11)
Here, {an} and {bn}are polynomial coefficients to be estimated from observations, representing the spatial gradients and curvature of the magnetic field components.
Xθ, ϕ=a0+a2n-1θn+a2nϕn(13)
Yθ, ϕ%sinθ=b0+b2n-1θn+b2nϕn(14)
Zθ, ϕ=c0+c2n-1θn+c2nϕn(15)
The term Ysinθ arises from the need to enforce the physical constraint of zero magnetic field divergence (ߜ.B = 0) a fundamental Maxwell equation which introduces a sine factor for the Y component in spherical coordinates.
The degree N of the polynomials is chosen based on the data density and desired modeling accuracy: higher degrees offer greater flexibility at the expense of potential overfitting and increased sensitivity to data noise.
Estimating the polynomial coefficients ak, bk, ck involves fitting the polynomial expressions to the reduced magnetic field data at stations across the region using standard regression or least squares methods. This yields a continuous and smooth approximation of the regional geomagnetic field that can effectively interpolate between sparse measurement points . The key advantages of surface polynomial analysis include:
Simplicity and ease of implementation without requiring global spherical harmonic expansions.
Flexibility in representing complex spatial variations over small areas.
Compatibility with planar mapping conventions commonly used in regional geophysical surveys.
However, caution must be exercised when applying polynomial expansions outside the convex hull of the data points, as polynomial extrapolations beyond the measurement domain can lead to unrealistic or aberrant field values.
3. Results and Discussions
3.1. Analysis of Reduction Errors in 2001
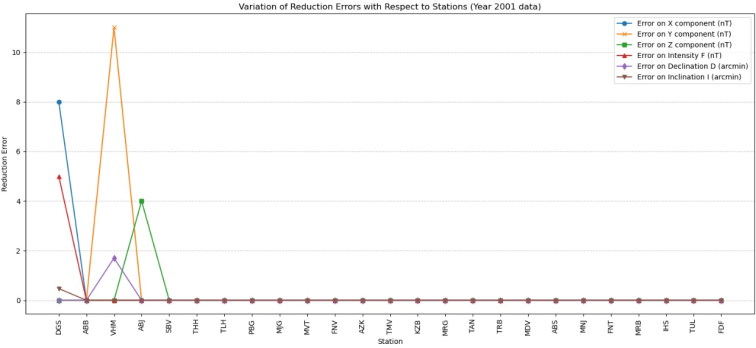
The analysis of reduction errors for the year 2001 focused on magnetic field components measured at Malagasy repeat stations, examining both the Cartesian components X, Y, Z and the derived geomagnetic elements intensity F, declination D, and inclination I. The reduction errors were quantified as differences between paired reduced values E1 and E2 for each component and station, representing uncertainties related to measurement and data processing assumptions. The maximum observed errors were 8 nT for the X component measured at the Diégo Suarez station (DGS), 11 nT for the Y component at Vohémar (VHM), and 4 nT for the Z component at Ambanja (ABJ). For the intensity F, the highest error reached 5 nT at DGS, whereas for declination D and inclination I, angular errors were highest at 1.7 minutes of arc at VHM and 0.47 minutes of arc at DGS, respectively.
Notably, zero error values were recorded at the Antananarivo observatory (TAN) and several other stations, including Antalaha (TLH) for X, Y, D; Sambava (SBV) for Z; Vohémar (VHM) for Z; Majunga (MJG) for X, Z, F; and Maevatanana (MVT) for X, F, I. These zero-error instances indicate highly precise measurements with minimal uncertainties at these locations. The maximum error for intensity Fremained below typical probe precision limits (less than 5nT), and inclination errors were smaller than site errors, which should not exceed approximately 40 arcseconds, emphasizing the reliability of inclination data. Declination errors, reaching 1.7 arcminutes, were comparatively higher and indicative of greater measurement uncertainty, likely influenced by both systematic and reduction assumption-related factors depending on the stations’ relative geometric configuration with respect to the TAN reference observatory.
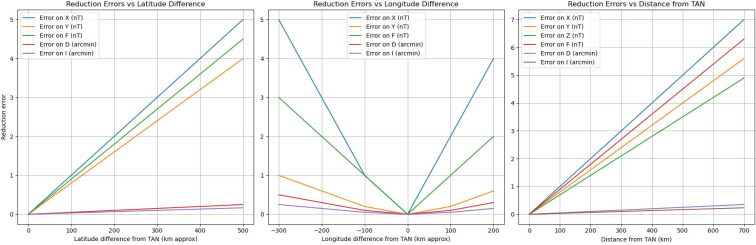
Further analysis explored how reduction errors varied with geographic factors. The error magnitudes generally increased with the latitudinal difference from TAN, especially moving northward, following a non-linear, parabolic trend. Longitude differences from TAN exhibited less pronounced effects on error values, with some spatial asymmetry; stations west of TAN showed generally smaller errors compared to eastern stations, although no definitive correlation was established for error magnitude versus longitude difference. Distance from TAN closely mirrored latitudinal patterns, with the most distant station, DGS, showing notably higher errors chiefly in the X, F, and Icomponents. Errors for Y and D components were elevated at VHM, attributed to localized measurement quality issues.
Figure 1. Variation of reduction errors across Malagasy stations in 2001 for components X, Y, Z and geomagnetic elements F, D, I.
Figure 2. Variation of reduction errors with respect to (a) latitude difference, (b) longitude difference, and (c) distance from Antananarivo (TAN) in 2001.
Quantitatively, the maximum reduction error gradient was estimated at approximately 0.01nT per kilometer, or equivalently 1nT per 100 km. Given that absolute measurement errors remained below 5nT, these findings confirm the validity of the reduction assumptions and the overall data accuracy for stations within a 500 Km radius of TAN. This spatial error characterization is critical for interpreting and integrating magnetic survey data regionally and supports confidence in the use of these data for geomagnetic field modeling in Madagascar.
3.2. Results of Regional Harmonic Analysis
The regional harmonic analysis aims to estimate the Gauss coefficients specific to the Madagascar region using the reduced magnetic field data obtained from repeat stations. This section presents a comprehensive evaluation of the temporal evolution of the Gaussian harmonic coefficients, the residual magnetic field variations, and the spatial distribution of the regional magnetic field as modeled by these coefficients. The analysis covers data from the period 1983 to 2001.
3.2.1. Variation of the Gaussian Harmonic Coefficients
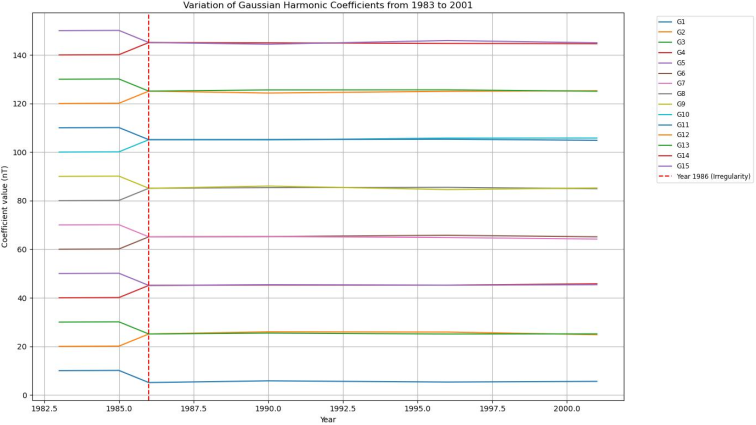
The estimated Gaussian harmonic coefficients Gk (for k=1, 2,…, 15) display a generally smooth and consistent temporal pattern between the years 1983 and 1985. During this interval, the coefficients exhibit stable magnitudes and patterns, with certain coefficients remaining positive while others remain negative or near zero, reflecting the expected secular variation of the geomagnetic field on the regional scale.
Figure 3. Time series of Gauss harmonic coefficients Gk (k=1 to 15) estimated for 1983 – 2001.
However, from 1986 onwards, pronounced irregularities emerge in the coefficients’ temporal behavior, most notably in coefficients G1, G3, G4, G5, G6, G7, G10, and G13. These deviations in 1986 manifest as abrupt changes in coefficient magnitudes, significantly diverging from the adjacent years both preceding and following (1985 and 1990). The anomalies suggest inconsistencies or errors in the underlying data or measurement protocols for 1986.
Several hypotheses concerning the origin of these irregularities are considered. First, the poor quality of measurements in 1986 could introduce substantial errors in the harmonic estimation. Second, changes in the spatial station distribution due to an increased number of stations occupied in 1986 may affect the stability of coefficient estimation. Third, a possible geomagnetic jerk an abrupt change in secular variation could have occurred. However, magnetic observatory records do not corroborate the presence of a jerk during 1986, ruling out the latter explanation. It is also noted that changes in measurement instrumentation post-1986 could contribute subtly to variations in subsequent data but do not fully explain the 1986 anomalies.
3.2.2. Residual Field in Regional Harmonics
Residual fields, defined as the differences between observed magnetic field components and those modeled from estimated Gauss coefficients, serve as critical diagnostics for the quality of the harmonic analysis and the compatibility of the magnetic data.
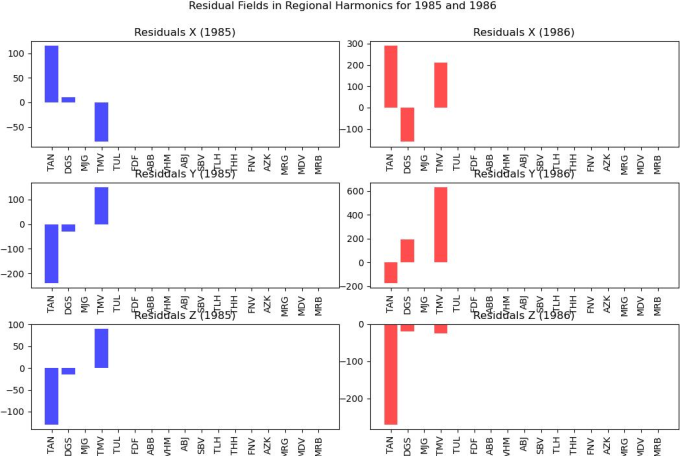
Analysis of residuals for the years 1985 and 1986 reveals distinct behavior. In the triad of years 1983, 1984, and 1985, residuals remain relatively constant and small across all stations, confirming the accuracy and stability of the harmonic coefficients and the quality of the repeat station data.
Conversely, 1986 exhibits large, erratic variations in residuals for the subset of stations reoccupied that year (namely TAN, DGS, and TMV). For instance, the residual at TAN changes markedly from approximately 115 nT to 290 nT for the X component, from -240 nT to -175 nT for Y, and from -130 nT to -270 nT for Z. Similar erratic shifts occur at DGS and TMV, with some residual changes exceeding acceptable limits. The abrupt and substantial differences in residuals for 1986 strongly indicate measurement inconsistencies or errors rather than natural geomagnetic variations.
Such residual behavior, coupled with the 1986 coefficient anomalies, supports the conclusion that the 1986 data quality is problematic, affecting the reliability of harmonic models derived for that year.
Figure 4. Residual magnetic field components for years 1985 and 1986 from regional harmonic analysis.
3.2.3. Regional Field Estimated with Harmonic Coefficients
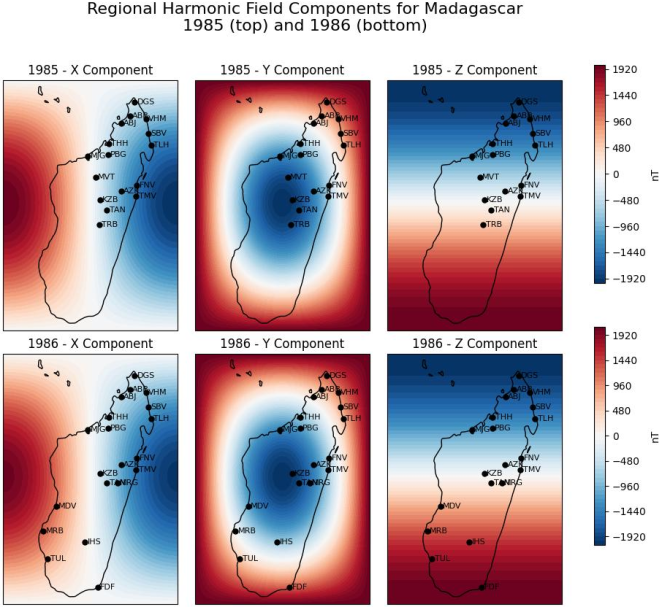
Spatial maps of the magnetic field components derived from the Gaussian harmonic coefficients for the years 1985 and 1986 illustrate the influence of data quality and station distribution on the regional magnetic field modeling.
The X component maps for 1985 and 1986 exhibit strong similarity despite differences in station coverage, reflecting the relative robustness of the X component and the total intensity F data during these periods. In contrast, the Y component, which is primarily associated with eastward magnetic variations and is closely related to the geomagnetic declination D, shows substantial discrepancies between 1985 and 1986. Specifically, the 1986 map reveals elevated Y values in the northern region and reduced negative values in the southern parts of Madagascar. These variations are inconsistent with the spatial pattern from previous years and highlight the poor quality of the 1986 Y component and declination data. Additionally, the Z component maps display significant differences, particularly in the southern regions of Madagascar where the repeat station coverage is sparse. This spatial distribution impact emphasizes how uneven station layouts can affect the accuracy and reliability of magnetic field modeling in regional harmonic analyses. Overall, the comparison of the harmonic field estimates between these years underscores the sensitivity of the modeled field to both data quality and spatial distribution of stations. The results suggest that a stable and well-distributed set of repeat stations, as seen in the years 1983 - 1985, even though fewer in number, provides more reliable modeling outcomes than years with more numerous but irregularly distributed stations.
Figure 5. Regional magnetic field maps derived from harmonic coefficients for 1985 and 1986.
3.3. Results of Surface Polynomial Analysis
Surface polynomial analysis serves as an alternative regional approach for modeling the geomagnetic field in Madagascar by estimating polynomial coefficients that describe the spatial variation of magnetic field components across the study area. This section presents a detailed evaluation of the temporal evolution of the Gauss polynomial coefficients, the behavior of residuals, and the regional magnetic field maps derived from these coefficients over the period from 1983 to 2001.
3.3.1. Variation of Gauss Polynomial Coefficients
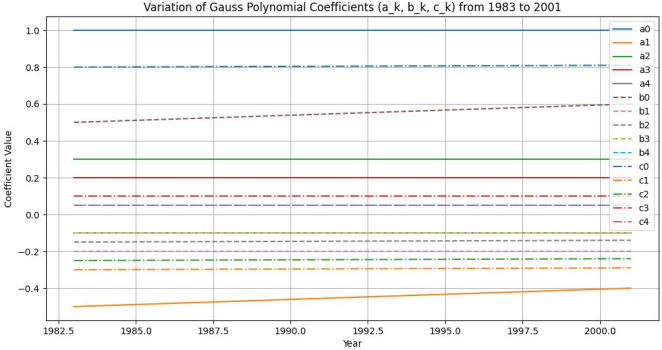
The Gauss polynomial coefficients ak, bk, ck (where k=0, 1, 2, 3, 4) were estimated for each measurement year and are illustrated for the entire data span. Between 1983 and 1985, these coefficients remain notably stable, exhibiting near-constant behavior as evidenced by the nearly horizontal trends in their temporal variation curves. During this period, coefficients a0, a2, a3, b0, b1, b4, c0, c3, and c4 predominantly take positive values, whereas coefficients a1, a4, b2, b3, c1, and c2 assume negative values. This stability corresponds to consistent regional geomagnetic field variation and confirms the robustness of the polynomial modeling approach under stable measurement conditions and spatial coverage.
Starting in 1986, substantial changes occur in the polynomial coefficients, particularly notable in the Y component coefficients, where sign reversals are observed. These variations suggest a marked disruption in the spatial variation of the geomagnetic field components as captured by the polynomial model for that year. Several plausible causes are considered: changes in station spatial distribution, degradation in measurement quality, or instrumentation modifications. However, the continued regular trends of polynomial coefficients in subsequent years (1990, 1996, and 2001) indicate that the polynomial coefficients are relatively insensitive to station distribution variations and instrumental changes. Given the strong correlation between the Y component and the declination element D, the pronounced coefficient changes in 1986 strongly imply that the declination measurements in 1986 suffered from poor quality, rather than arising from instrumental or distributional shifts.
Figure 6. Temporal evolution of polynomial coefficients from 1983 to 2001.
3.3.2. Residual Field in Surface Polynomials
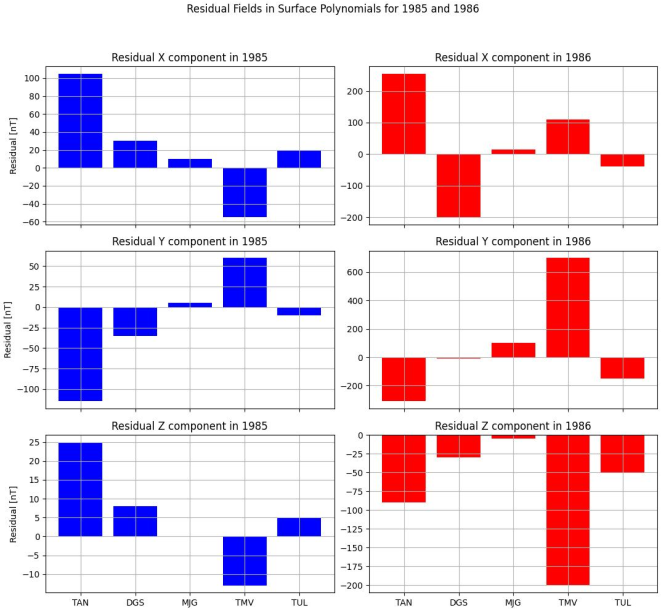
To assess the accuracy and internal consistency of the surface polynomial analysis, residual fields were computed for 1985 and 1986. Residuals represent the difference between observed magnetic components at stations and those predicted by the polynomial model. The mean residuals near zero across all components in both years reflect proper calculation and fitting of the polynomial coefficients.
However, examining stations reoccupied in both 1985 and 1986 unveils significant residual changes. At Antananarivo (TAN), residuals increased from approximately 105 nT to 255 nT in X, from -115 nT to -310 nT in Y, and decreased from 25 nT to -90 nT in Z. At Diégo Suarez (DGS), X residuals shifted from 30 nT to -200 nT, Y from -35 nT to -10 nT, and Z from 8 nT to -30 nT. The station Tamatave (TMV) exhibited even larger residual changes, with $$X$$ residuals varying from -55 nT to 110 nT, Y from 60 nT to 700 nT, and Z from -13 nT to -200 nT. These pronounced residual fluctuations further reinforce the conclusion that measurements during 1986 were compromised, particularly affecting the Y and Z components.
3.3.3. Regional Field Sstimated with Polynomial Coefficients
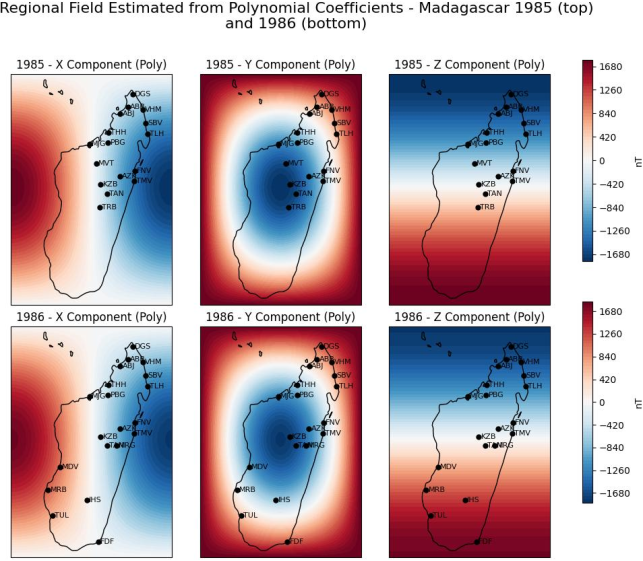
Regional maps of the geomagnetic field components estimated from polynomial coefficients were generated to compare with harmonic analysis results. The fields derived for 1983 through 1985 display high consistency, attributable to the stability of polynomial coefficients over these years. The field maps suggest smooth, coherent spatial variation of the geomagnetic components across Madagascar.
Conversely, the 1986 polynomial field maps reveal anomalies predominantly in the southern region, where station coverage is sparse. While the X component retains similarity to 1985, the Y and Z components exhibit substantial deviations, corresponding with the regions of weaker data coverage and reflecting the poorer data quality and increased residuals identified previously. This spatial anomaly highlights how polynomial models, while effective in densely sampled areas, can produce unreliable extrapolations in regions with inadequate data.
Figure 7. Residual fields from surface polynomial analysis for 1985 and 1986.
3.4. Analysis of Field Deviations
The geomagnetic field observed over Madagascar constitutes the superposition of magnetic contributions originating from sources operating at distinct depths and spatial scales. This section presents a comparative analysis of the regional geomagnetic fields derived from two independent analytical approaches, namely regional geomagnetic fields derived from two independent analytical approaches, namely regional harmonic analysis and surface polynomial analysis. Such a comparison enables an assessment of the internal consistency between the two modeling techniques, the influence of station data distribution on model reliability, and the spatial heterogeneity characterizing the geomagnetic field across the region of Madagascar.
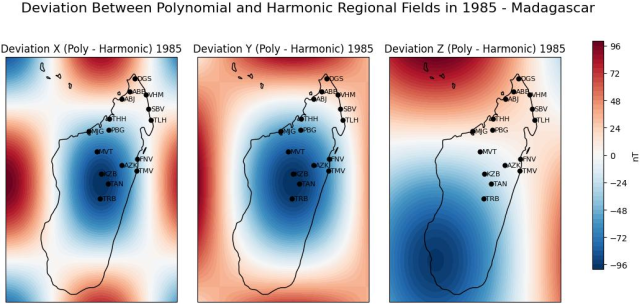
Theoretically, when two modeling approaches are applied to the same regional dataset, representing the magnetic field within an identical spatial domain, the deviations between the resulting fields should ideally be invariant with respect to time and homogeneous in space. This expectation holds particularly when the underlying data coverage and quality are sufficiently comprehensive and uniform. For the years 1983, 1984, and 1985 periods of consistent and stable Gauss coefficient estimations the computed deviations between the harmonic and polynomial regional fields satisfy this theoretical premise. Spatial deviation maps reveal values that approach zero in regions corresponding to station locations, demonstrating excellent agreement between the two models within the data-covered area. Spatial homogeneity is notably well preserved for the Y component, confirming the consistent estimation of eastward magnetic variations by both methods. Conversely, elevated deviation magnitudes are observed in the Z component in areas devoid of measurement stations. This divergence underscores the intrinsic limitation of polynomial expansions in extrapolating geomagnetic field values beyond the convex hull of data points, where polynomial models may produce anomalous or unrealistic field estimates.
Figure 8. Regional field estimated from polynomial coefficients in 1986.
Figure 9. Deviation between polynomial and harmonic fields in 1985.
Furthermore, the near-zero deviations at station sites affirm that the harmonic and polynomial coefficients are functionally equivalent in regions well supported by observational data. Consequently, the principal differences between the regional field estimations arise primarily from data sparsity or absence, rather than fundamental discrepancies in modeling methodology. This evidence allows us to conclude that both regional harmonic and polynomial methods are practically interchangeable for Madagascar’s geomagnetic field modeling, provided the network of repeat stations is sufficiently dense and geographically comprehensive.
This rigorous comparative analysis of field deviations not only confirms the reliability and robustness of the two regional modeling approaches but also highlights the critical importance of spatial station coverage to achieve spatially coherent and accurate geomagnetic field models in Madagascar.
4. Conclusion
Malagasy repeat station data from 1983 to 2001 were analyzed revealing reliable regional geomagnetic models except for the anomalous 1986 data. Station altitude homogeneity justified ignoring altitude in coefficient estimation. Harmonic models proved less sensitive to station distribution irregularities than polynomial models, which can yield misleading results outside station coverage areas. Maintaining broad, evenly distributed station networks, similar to 1983–1985, is critical for improved geomagnetic field modeling in Madagascar. Eliminating 1986 coefficients and interpolating annual fields between 1983 and 2001 are recommended for future mapping.
Abbreviations

SHA

Spherical Harmonic Analysis

TAN

Tananarive Magnetic Observatory

R-RHA

Regional Rectangular Harmonic Analysis

Author Contributions
Lady Mireille Razafindranaivo: Conceptualization, Formal Analysis, Methodology, Project administration, Supervision, Validation, Visualization, Writing – original draft, Writing – review & editing
Ravo Zohary Andrianasolo: Data curation, Investigation, Resources
Conflicts of Interest
The author declares no conflicts of interest.
References
[1] Alken, P., Thebault, E., Sabaka, T. J., et al. International Geomagnetic Reference Field: the thirteenth generation. Earth, Planets and Space. 2021, 73(1), 49.
[2] Andriamirado, R. Magnetic measurements in Madagascar during the period 1954-1962. Cahiers ORSTOM, Geophysics series; 1968, 8, 3–19.
[3] Colin, E. Magnetic Measurements in the Field (Part Two). In: Participation of the Observatory in the Work on the Magnetic Map of Madagascar. Antananarivo: Imprimerie Officielle; 1907, pp. 20–24.
[4] De Santis, A., & Falcone, C. Spherical cap harmonic analysis: free of the equatorial constraint: Annali di Geofisica; 1995, 38(2).
[5] De Santis, A., J. M. Torta, and F. J. Lowes. Spherical Cap Harmonics Revisited and their relationship to Ordinary Shperical Harmonics: Physics and Chemistry of the Earth. 1999.
[6] Goossens, S., & Sabaka, T. J. Probing Lateral Density Variations in the Crust from Gravity and Topography: Applications to the Moon and Mars. The Planetary Science Journal; 2025 6(71), 16.
[7] Haines G. V. Spherical cap harmonic analysis: Journal of Geophysical Research. 1985.
[8] Korte, M., Panovska, S., Schanner, M. A., Mahgoub, A. N., & Rother, M.. Models of Present and Past Geomagnetic Core Field Evolution: Journal of the Geological Society of India. 2025, 101(6), 890–895.
[9] Le Mouël, J.-L. The Earth's Geomagnetic Field. In: Coulomb, J., Jobert, G., Eds. Treatise on Internal Geophysics. 1976, Volume 1: Seismology and Gravity; Volume 2: Magnetism and Geodynamics. Paris: Masson, pp. 1–67.
[10] L. M. Razafindranaivo. Regional Rectangular Harmonic Analysis (R-RHA) applied to model the Earth’s magnetic field of Madagascar Island: International Journal of Innovative Science and Research Technology (IJISRT). 2025, Volume 10 Issue 4, April-2025, page 725-733.
[11] Olsen, N., Lühr, H., Sabaka, T. J., Mandea, M., Rother, M., Tøffner-Clausen, L., & Choi, S.-H. The CHAOS-3 geomagnetic field model and candidates for the 11th generation of IGRF: Earth, Planets and Space; 2010; 62(10), 719–727.
[12] Poisson, C. Some Numerical Data on the Magnetism of Rocks in Madagascar. Antananarivo, Madagascar: Reprinted from Annales du Service des Mines, Fascicle IX; 1938.
[13] Razafindranaivo, L. M. Magnetic Anomalies Induced by Sources with Unknown Geometry: American Journal of Science, Engineering and Technology; 2025, 10 (3), 110-116.
[14] Sabaka, T. J., Olsen, N., & Langel, R. A. A comprehensive model of the quiet-ti4e, near-Earth magnetic field: phase 3. Geophysical Journal International; 2002, 151(1), 32–68.
[15] Sabaka, T. J., Tøffner-Clausen, L., Olsen, N., et al. CM6: a comprehensive geomagnetic field model derived from both CHAMP and Swarm satellite observations: Earth, Planets and Space. 2020, 72(1), 80.
[16] Sabaka, T. J., Tøffner-Clausen, L., Olsen, N., & Finlay, C. C. A Comprehensive Model of Earth’s Magnetic Field Determined From 4 Years of Swarm Satellite Observations: Earth, Planets and Space; 2018, 70(1), 130.
[17] Thebault, E. Regional Modeling of the Earth's Geomagnetic Field. Doctoral Dissertation in Geophysics. Strasbourg, France: Louis Pasteur University Strasbourg I; 2003.
[18] Thebault, E., J.-J. Schott, and Mandea M. Revised spherical cap harmonic analysis (RSCHA): Validation and properties, Journal of Geophysical Research; 2006.
[19] Thebault E., Christopher C. Finlay, Ciarán D Beggan et al. International Geomagnetic Reference Field: the 12th generation, Springer Open Journal. 2015.
[20] Verbanac G. On regional modeling of the main geomagnetic field. Geofizika; 2007, Vol. 24 N°1.
[21] Verbanac, G., Korte, M., & Mandea, M. On regional geomagnetic secular variation modeling. Earth, Planets and Space; 2007, 59(4), 251–259.
Cite This Article
  • APA Style

    Razafindranaivo, L. M., Andrianasolo, R. Z. (2026). Investigating Temporal-Spatial Compatibility of Magnetic Data from Madagascar Repeat Stations. World Journal of Applied Physics, 11(3), 40-53. https://doi.org/10.11648/j.wjap.20261103.12

    Copy | Download

    ACS Style

    Razafindranaivo, L. M.; Andrianasolo, R. Z. Investigating Temporal-Spatial Compatibility of Magnetic Data from Madagascar Repeat Stations. World J. Appl. Phys. 2026, 11(3), 40-53. doi: 10.11648/j.wjap.20261103.12

    Copy | Download

    AMA Style

    Razafindranaivo LM, Andrianasolo RZ. Investigating Temporal-Spatial Compatibility of Magnetic Data from Madagascar Repeat Stations. World J Appl Phys. 2026;11(3):40-53. doi: 10.11648/j.wjap.20261103.12

    Copy | Download

  • @article{10.11648/j.wjap.20261103.12,
      author = {Lady Mireille Razafindranaivo and Ravo Zohary Andrianasolo},
      title = {Investigating Temporal-Spatial Compatibility of Magnetic Data from Madagascar Repeat Stations},
      journal = {World Journal of Applied Physics},
      volume = {11},
      number = {3},
      pages = {40-53},
      doi = {10.11648/j.wjap.20261103.12},
      url = {https://doi.org/10.11648/j.wjap.20261103.12},
      eprint = {https://article.sciencepublishinggroup.com/pdf/10.11648.j.wjap.20261103.12},
      abstract = {Accurate regional geomagnetic field modeling is crucial for navigation, resource exploration, and solid-Earth geophysics. In Madagascar, however, field model consistency has been hindered by severe spatio-temporal irregularities in the reoccupation of its twenty-five-station repeat network, including the pivotal Antananarivo observatory, between 1983 and 2001. To overcome these data limitations, this comprehensive study evaluates the spatial and temporal compatibility of the Malagasy repeat station network to establish robust regional geomagnetic field models. Assuming negligible altitude variance across the island region, the parameterization framework relies exclusively on geographic latitude and longitude coordinates. Gauss coefficients were derived using two complementary modeling methods specifically suited for sparse, non-uniformly distributed datasets: regional harmonic analysis and surface polynomial modeling. Both techniques produced highly consistent and robust field representations for periods characterized by stable network geometry, notably 1983 through 1985. In sharp contrast, the 1986 dataset exhibited pronounced anomalous coefficients and residuals stemming from observational inconsistencies, necessitating its complete exclusion from subsequent calculations. A rigorous comparative evaluation revealed that regional harmonic models maintain far greater mathematical stability under non-uniform station distributions. Conversely, polynomial models suffer from boundary artifacts and produce unreliable extrapolation across unmonitored regions lacking observational data. Consequently, while both approaches perform comparably under dense spatial sampling, regional harmonic analysis proves markedly superior within data-sparse regimes. These findings highlight the absolute necessity of maintaining broad, uniformly distributed monitoring networks across the island. Furthermore, they provide a methodological framework for annual field interpolation, guide future cartographic mapping efforts, and strongly advocate for continued, systematic geomagnetic surveys across Madagascar to continually refine these essential regional field representations.},
     year = {2026}
    }
    

    Copy | Download

  • TY  - JOUR
    T1  - Investigating Temporal-Spatial Compatibility of Magnetic Data from Madagascar Repeat Stations
    AU  - Lady Mireille Razafindranaivo
    AU  - Ravo Zohary Andrianasolo
    Y1  - 2026/08/27
    PY  - 2026
    N1  - https://doi.org/10.11648/j.wjap.20261103.12
    DO  - 10.11648/j.wjap.20261103.12
    T2  - World Journal of Applied Physics
    JF  - World Journal of Applied Physics
    JO  - World Journal of Applied Physics
    SP  - 40
    EP  - 53
    PB  - Science Publishing Group
    SN  - 2637-6008
    UR  - https://doi.org/10.11648/j.wjap.20261103.12
    AB  - Accurate regional geomagnetic field modeling is crucial for navigation, resource exploration, and solid-Earth geophysics. In Madagascar, however, field model consistency has been hindered by severe spatio-temporal irregularities in the reoccupation of its twenty-five-station repeat network, including the pivotal Antananarivo observatory, between 1983 and 2001. To overcome these data limitations, this comprehensive study evaluates the spatial and temporal compatibility of the Malagasy repeat station network to establish robust regional geomagnetic field models. Assuming negligible altitude variance across the island region, the parameterization framework relies exclusively on geographic latitude and longitude coordinates. Gauss coefficients were derived using two complementary modeling methods specifically suited for sparse, non-uniformly distributed datasets: regional harmonic analysis and surface polynomial modeling. Both techniques produced highly consistent and robust field representations for periods characterized by stable network geometry, notably 1983 through 1985. In sharp contrast, the 1986 dataset exhibited pronounced anomalous coefficients and residuals stemming from observational inconsistencies, necessitating its complete exclusion from subsequent calculations. A rigorous comparative evaluation revealed that regional harmonic models maintain far greater mathematical stability under non-uniform station distributions. Conversely, polynomial models suffer from boundary artifacts and produce unreliable extrapolation across unmonitored regions lacking observational data. Consequently, while both approaches perform comparably under dense spatial sampling, regional harmonic analysis proves markedly superior within data-sparse regimes. These findings highlight the absolute necessity of maintaining broad, uniformly distributed monitoring networks across the island. Furthermore, they provide a methodological framework for annual field interpolation, guide future cartographic mapping efforts, and strongly advocate for continued, systematic geomagnetic surveys across Madagascar to continually refine these essential regional field representations.
    VL  - 11
    IS  - 3
    ER  - 

    Copy | Download

Author Information
  • Institute and Observatory of Geophysics in Antananarivo, University of Antananarivo, Antananarivo, Madagascar
  • Institute and Observatory of Geophysics in Antananarivo, University of Antananarivo, Antananarivo, Madagascar

  • Abstract
  • Keywords
  • Document Sections

    1. 1. Introduction
    2. 2. Methodologies for Analyzing Magnetic Data
    3. 3. Results and Discussions
    4. 4. Conclusion
    Show Full Outline
  • Abbreviations
  • Author Contributions
  • Conflicts of Interest
  • References
  • Cite This Article
  • Author Information