1. Introduction
The global consciousness towards advancement in eco-friendly constructions has engineered the discovery of alternative and sustainable use for waste materials
| [1] | Rodriguez F. Plastic. Encyclopedia Britannica 2023. |
[1]
. The success of the research which describes the usefulness of waste materials in other procedures will not only reduce the waste product but also add value in property to the material or component. It is a case on established facts and utmost improvement where needed. This study emphasizes significant of the composite solid sandcrete block in the development of sustainable building structures and other products of the construction industry
| [2] | Abdel O. F., Amin M. R., Ibrahim M. M., Abdel Wahab M., Abd El Rahman E. N. Recycling Waste Plastic Bags as a Replacement for Cement in Production of Building Bricks and Concrete Blocks. J Waste Resour Recycl 2020; 2(1): 102. |
[2]
. The blocks are composed of cement, sand, and water, molded into a variety of shapes and sizes
| [10] | Anthony B. S., Olabosipo I. F. Adewuyi P. A. and Musibau A. A. (2015). Sandcrete Block and Brick Production in Nigeria - Prospects and Challenges. IIARD International Journal of Environmental Research. 1(4). |
[10]
. The construction industry is currently seen as the possible largest employer of this unit since the industry is now investing its attention towards sustainable construction procedures.
| [11] | Tam, V. W. Y., Soomro, M., & Evangelista, A. C. J. (2021). A review of recycled aggregate in concrete applications (2000-2017). Construction and Building Materials, 172, 272-292. |
[11]
.
Sandcrete block is a masonry unit which is predominantly used as walling materials in the construction of shelters and other infrastructures
| [3] | Ameh O. J., Nwaigwe D. N. Influence of Variation in the Composition of Fine Aggregate on the Properties of Sandcrete Blocks. Covenant Journal of Research in the Built Environment 2017; 5(1). |
[3]
. Sandcrete block is made from a mixture of cement and sharp sand in the ratio of usually 1: 6 with minimum amount of water. In some cases, admixtures are added
| [3] | Ameh O. J., Nwaigwe D. N. Influence of Variation in the Composition of Fine Aggregate on the Properties of Sandcrete Blocks. Covenant Journal of Research in the Built Environment 2017; 5(1). |
[3]
. The consideration of a composite block will help to further prove its usefulness in critical aspects within the Construction Industry
| [4] | Jassim A. K. Recycling of Polyethylene waste to produce plastic cement. Procedia Manuf 2017; 8: 635-2. |
[4]
. The industry, which is now accommodative to sustainable construction procedures, is a favourable market for this material
| [1] | Rodriguez F. Plastic. Encyclopedia Britannica 2023. |
[1]
. It will help generate reasonable revenue to manufacturers and create employment opportunity for the general populace. The composite concrete block is considered in this study. It consists of rubber and plastic pet bottles which can easily be sourced from our immediate environment, the Portland cement and fine aggregate
| [12] | Kamaruddin M. A., Abdullah M. A, Zawawi M. H., Zainol R. A. (2017). Potential Use of Plastic Waste as Construction Materials: Recent Progress And Future Prospect. IOP Conference Ser: Mater Sci Eng: 267. |
[12]
. The mixture of this material in an appropriate proportion will be used to manufacture the composite units and will undergo several tests to understand its usefulness and areas most suitable for in the Construction Industry
| [4] | Jassim A. K. Recycling of Polyethylene waste to produce plastic cement. Procedia Manuf 2017; 8: 635-2. |
[4]
.
Building failures have resulted in loss of lives and properties in Nigeria
| [5] | Odeyemi S. O., Anifowose M. A., Oyeleke M. O., Adeyemi A. O., Bakare S. B. Effect of Calcium Chloride on the Compressive Strength of Concrete Produced from Three Brands of Nigerian Cement. American Journal of Civil Engineering 2015; 3: 1-5. |
[5]
. In some cases, even though the building has not totally collapsed, the aesthetics value is lost to cracks and other defects. The concern for sudden building failure in Nigeria requests that materials used for construction of buildings meet minimum requirements. Housing is a necessity of man and the ambition of people to have access to decent shelter is not a luxury but a necessity. Different materials are used around the world for buildings
| [9] | Ajagbe, W. O. Ganiyu, A. A. and Adeniji, A. A. (2013). Quality Assessment Of Sandcrete Blocks In Ibadan; A Review. Epistemics in Science Engineering and Technology, 3; 272 - 277. |
[9]
. Sandcrete block is a composite material made up of cement, sand and water which are moulded into diverse sizes. Freestanding walls and building structures with load bearing and non-load bearing sandcrete blocks are common in Nigeria because of their ease of construction and their affordability.
Sandcrete skin panels and blocks are sometimes used to provide aesthetics to buildings and serve as control to moisture infiltration and wind action. This utility value of Sandcrete in comparison to its cost and its adaptability to climatic factors is responsible for its wide application; most especially in small to medium buildings in countries within tropical rainforests where a considerable amount of precipitation and high average temperatures are predominant
| [5] | Odeyemi S. O., Anifowose M. A., Oyeleke M. O., Adeyemi A. O., Bakare S. B. Effect of Calcium Chloride on the Compressive Strength of Concrete Produced from Three Brands of Nigerian Cement. American Journal of Civil Engineering 2015; 3: 1-5. |
[5]
. Sandcrete blocks can either be solid or hollow rectangular types with 450mm × 225mm × 225mm and 450mm × 150mm × 225mm being the most common sizes
| [6] | Abdulwahab R., Tunde M. A. The effects of production methods on the compressive strength of hollow sandcrete blocks. Journal of Materials and Engineering Structures 2016; 3: 197-204. |
[6]
.
| [8] | Anosike B. and Oyebade H. (2012). Sandcrete Blocks and Quality Management in Nigeria Building Industry. Journal of Engineering, Project, and Production Management, 2(1), 37-46. |
[8]
reported that the NIS specified two types of blocks, types A blocks which are load bearing and Type B blocks which are non-load bearing. Both of them can either be solid or hollow. Building factories in Nigeria habitually produce two cell hollow sandcrete blocks. There is a void from top to the bottom of hollow sandcrete blocks which occupy about one third of the volume of the blocks but solid sandcrete block does not have any void in it. Sandcrete blocks are relatively cheap when compared to other construction materials. They provide an excellent resistance to damage without the added cost of protection devices.
Sandcrete blocks do not rust, decay, or provide a home for damaging insects as other building materials can. They do not contain any material that is harmful to the environment
| [5] | Odeyemi S. O., Anifowose M. A., Oyeleke M. O., Adeyemi A. O., Bakare S. B. Effect of Calcium Chloride on the Compressive Strength of Concrete Produced from Three Brands of Nigerian Cement. American Journal of Civil Engineering 2015; 3: 1-5. |
[5]
. The minimum compressive strength of sandcrete stated in the Nigeria Industrial Standard
| [7] | Nigerian Industrial Standard: Standard for Sandcrete blocks. Standard Organisation of Nigeria, Lagos, Nigeria. |
[7]
ranges between 2.5N/mm
2 to 3.45N/mm
2 for non-load bearing and load. The development of composite construction product is gaining the needed momentum across board. With this study, further observations and consideration shall be attached with the use of the composite block in building development and other engineering practices
| [4] | Jassim A. K. Recycling of Polyethylene waste to produce plastic cement. Procedia Manuf 2017; 8: 635-2. |
[4]
. Specifications to be deployed will be considered from similar reports and a reasonable one shall be utilized.
Plastic bottle waste is one of the commonly recoverable waste materials from our environment. This material has an elongated lifespan of about 400 to 1000 years before it degrades
| [10] | Anthony B. S., Olabosipo I. F. Adewuyi P. A. and Musibau A. A. (2015). Sandcrete Block and Brick Production in Nigeria - Prospects and Challenges. IIARD International Journal of Environmental Research. 1(4). |
[10]
. Finding an alternative use of this material has been launched over time and several researchers have developed solutions which incorporate this material as a unit in their objectives
| [1] | Rodriguez F. Plastic. Encyclopedia Britannica 2023. |
[1]
. This study is navigated to describe how the plastic bottle waste (pet bottle) can be used to improve some properties of sandcrete block to improve and maintain its serviceability in water environments
| [2] | Abdel O. F., Amin M. R., Ibrahim M. M., Abdel Wahab M., Abd El Rahman E. N. Recycling Waste Plastic Bags as a Replacement for Cement in Production of Building Bricks and Concrete Blocks. J Waste Resour Recycl 2020; 2(1): 102. |
[2]
. This is to determine if the block will retain its properties in strength and other physical properties when subjected in extreme water conditions (marine water)
| [12] | Kamaruddin M. A., Abdullah M. A, Zawawi M. H., Zainol R. A. (2017). Potential Use of Plastic Waste as Construction Materials: Recent Progress And Future Prospect. IOP Conference Ser: Mater Sci Eng: 267. |
[12]
.
The biological and chemical properties of these medium has the capacity to affect material strength and physical properties, the composite block will be introduced to determine its reaction in these extreme conditions
| [2] | Abdel O. F., Amin M. R., Ibrahim M. M., Abdel Wahab M., Abd El Rahman E. N. Recycling Waste Plastic Bags as a Replacement for Cement in Production of Building Bricks and Concrete Blocks. J Waste Resour Recycl 2020; 2(1): 102. |
[2]
. It has been established that the conventional hollow block loses its strength and other important properties when subjected to water environment. With the advent of the composite plastic block, there are tendencies that these properties could be retained even in extreme water conditions
| [1] | Rodriguez F. Plastic. Encyclopedia Britannica 2023. |
[1]
. Sandcrete blocks can either be solid or hollow rectangular types with 450mm × 225mm × 225mm and 450mm × 150mm × 225mm being the most common sizes
| [6] | Abdulwahab R., Tunde M. A. The effects of production methods on the compressive strength of hollow sandcrete blocks. Journal of Materials and Engineering Structures 2016; 3: 197-204. |
[6]
.
The justification for studying the performance assessment of rubber-plastic solid sandcrete blocks in marine water environments lies in the increasing demand for durable, eco-friendly construction materials suitable for coastal and offshore applications. Marine environments pose significant challenges to conventional building materials due to exposure to high salinity, moisture, and temperature variations, which can accelerate degradation, reduce structural strength, and lead to costly maintenance or failure. By incorporating recycled rubber and plastic into sandcrete blocks, there is potential to enhance their durability, reduce environmental impact through waste repurposing, and provide a sustainable alternative for marine construction. However, the performance of such composite materials under prolonged marine exposure has not been comprehensively evaluated. Assessing their behavior in terms of mechanical strength, water absorption, chemical resistance, and long-term stability is essential to determine their practical viability, ensure structural safety, and guide material innovation for resilient infrastructure in marine settings. Nigeria is faced with several environmental pollutions which are mostly on the account of the waste it generates. The country is deploying its resources towards the development of procedures capable of turning waste to wealth. The rubber-plastic sand block will be introduced to participate in this encouraging initiative and also create an alternative procedure for wall construction which will have improved properties when subjected to extreme water conditions.
2. Materials and Methods
2.1. Materials Used
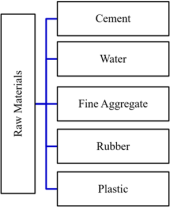
This research considered four (4) materials for the production of the alternative solid sandcrete block unit which are rubber-plastic, waste bottle, cement and sand. Other considerations are as follows.
Figure 1 shows the flow chart of the materials used.
Figure 1. The Flow Chart of the Materials used.
2.2. Materials Deployed
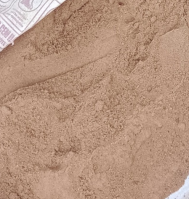
2.2.1. Fine Aggregate Used
The fine aggregate considered was the one with multiple size distribution of considered fine material that was within class of fine aggregate (all in one). This material was deployed to provide both fine and coarse property for the block production. This was obtained around Lagos environs.
Figure 2. Fine aggregate.
2.2.2. Rubber-PET Bottle
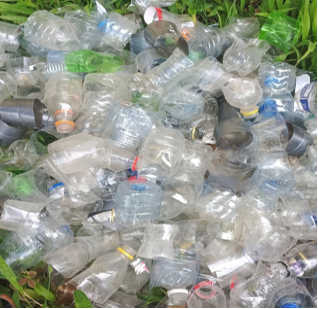
The pet bottle was the waste plastic and rubber which are easily obtained around us. It used container for carbonated drinks, water package and waste tyres. The rubber-plastic materials were melted to assume desired shape.
Figure 3. Waste PET bottles.
2.3. Material Source
The materials for this experiment were sourced locally. The preferred sand material is the quarry dust produced from grinding of larger earth material. Local quarry was approached to collect few volume of this material and transported to the Laboratory. The rubber and plastic PET materials was sourced from local recyclers who have already shred this waste into smaller units. The already shredded rubber and plastic waste were transported for the necessary related procedures to take place.
2.4. Mix Design
This study considers a mix ratio of 1:6 (450mm×225mm sandcrete block) for the production for the rubber-plastic solid sandcrete block unit while the solid sandcrete block is made from a 1:6 mix consideration.
2.5. Methods
2.5.1. Physical Properties Test of Materials
a. Bulk density test was done on the sand to determine the density of the undisturbed fine aggregate supplied when it is bulked or compacted. Bulk density is a measure of the degree of compaction of a material.
b. Moisture content test was done to determine the percentage of moisture absorbed by the surface of the sand. For a given sample of sand, there is a percentage of moisture in it that cannot be removed by air; this is the moisture content of sand. The bulk density and moisture content were carried out according to ASTM C29 and ASTM D2216 respectively.
Bulk Density =(1)
Moisture Content =×100%(2)
2.5.2. Water Absorption and Specific Gravity Test
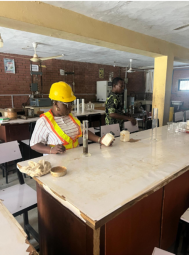
Water absorption gives the percentage of water that the considered sand sample can absorb. It was determined when the material was at a saturated and surface-dry state. It can also be used to determine the internal pore structure of the sand material. Specific gravity test (
Figure 4) was carried on the sand sample to determine the weight of the sand to the weight of water it displaces. The water absorption and specific gravity were carried out according to ASTM D2216-10 and ASTM D854-00 respectively.
Water Absorption =×100%(3)
Specific Gravity =(4)
Figure 4. Water absorption and Specific Gravity Process in the Laboratory.
2.5.3. Particle Size Distribution
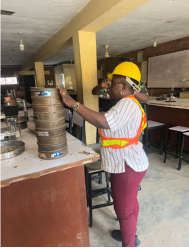
Particle size distribution/ sieve analysis was carried out (
Figure 5) to determine the fineness modulus, co-efficient of curvature and co-efficient of uniformity to ascertain if the sand is well graded or not and if it is coarse, fine, or medium-coarse.
Figure 5. Sieve Analysis Process in the Laboratory.
The particle size distribution and specific was carried out according to ASTM D422-63.
Coefficient of Curvature (CC) =(5)
Coefficient of Uniformity (CU) =(6)
2.5.4. Design of Experiment
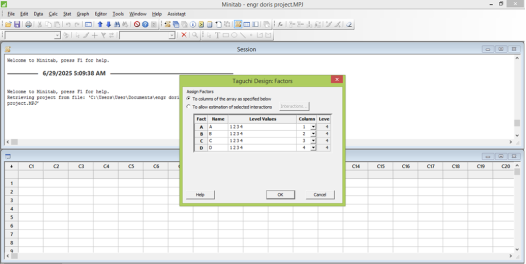
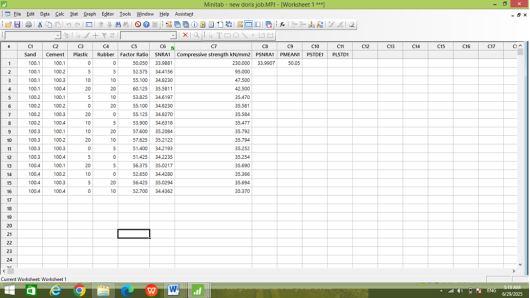
The optimal proportions of plastic and rubber used as admixtures in block mixes were determined using Minitab to achieve desired performance characteristics. This is shown in the
Figures 6-10.
Figure 6. Creation of Taguchi Design.
Figure 7. Creation of Taguchi Design Levels and Factors.
Figure 8. Generation of 16 Runs values for the Design.
Figure 9. Definition of Custom Taguchi Design.
Figure 10. Analysis of Taguchi Design.
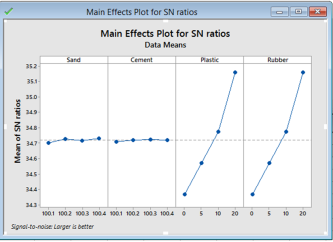
Figure 11. Main Effect Plot for SN Ratio.
2.6. Research Labor0atory Procedure
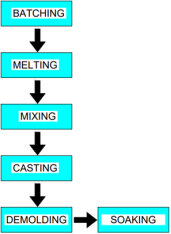
Figure 12. Rubber-Plastic Sand Block Production Process.
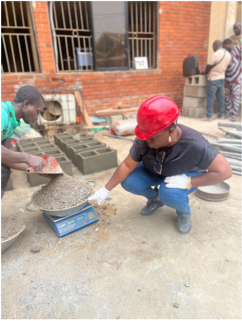
2.6.1. Batching
This is the process of measuring (by weight) the aggregate and material to be used for the work in the considered ratio 1: 6 for both rubber-plastic-sand and cement-sand blocks respectively (Figure 13).
Figure 13. Batching Process.
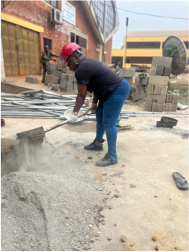
2.6.2. Melting and Mixing
This procedure involves igniting the fire source for melting of the shredded plastic and mixing with the right proportion of sand (
Figure 14).
Figure 14. Mixing Process.
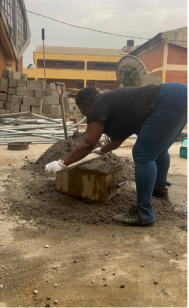
2.6.3. Casting
The casting process involved preparing the mould and placing of the material for shaping and formation of the block (
Figure 15).
Figure 15. Casting of Blocks.
2.6.4. Curing of Cement-sand Blocks
For this study, both wetting and membrane curing were adopted.
2.6.5. Soaking
The samples were recovered and arranged for soaking.
Figure 16. Fetching River water for Curing.
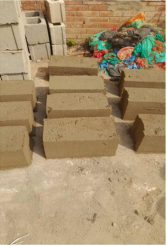
Figure 17. Produced Blocks.
Figure 18. Curing Process.
2.7. Laboratory Test
The testing of the samples was done to ensure that the serviceability of the block is maintained after submersion. The testing procedures are as follows.
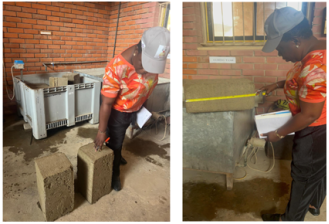
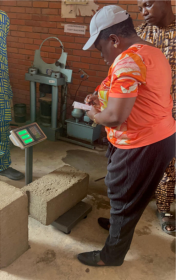
2.7.1. Weighing and Absorption Test
The absorption test was done by recording the initial weight of block before submerging W
1 and final weight after submerging W
2 (
Figure 19).
absorptioncapacity (%) =×100(7)
Figure 19. Weighing Process.
2.7.2. Compression Test
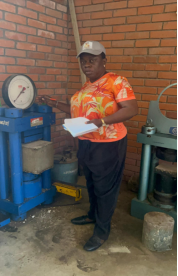
The compressive test (
Figure 20) was used to determine the strength of block which gives the serviceability of the construction unit. The compressive test is as follows:
Compressive strength =(N/mm2)(8)
Figure 20. Compression Test.
4. Results
4.1. Sieve Analysis Results
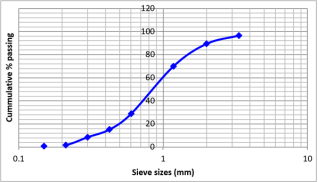
Introduction to Sieve Analysis Parameters In soil mechanics and geotechnical engineering, sieve analysis is used to determine the particle size distribution (PSD) of granular materials. ASTM D2487 / Unified Soil Classification System (USCS) provides guidance for evaluating these values for classifying soils: Well-graded sand (SW): Coefficient of Uniformity Cu ≥ 6 and 1 ≤ Coefficient of Curvature Cc ≤ 3 Well-graded gravel (GW): Cu ≥ 4 and 1 ≤ Cc ≤ 3 If these conditions are not met, the soil is poorly graded (SP or GP).
Figure 22 shows that Sand Cu = 3.2 and Cc = 1.4. The Cu value of 3.2 is less than 6, hence, the sand is not well graded. The Cc value of 1.4 falls within the acceptable range (1-3). This shows the sand is poorly graded sand (SP) according to USCS. It likely has limited particle size distribution, meaning most particles are of similar size. Poor gradation may lead to less interlocking and reduced shear strength and compaction capability.
Figure 22. Sieve Analysis Results for Sand.
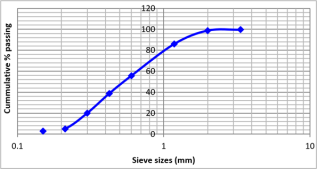
According to Das (2010), well-graded sands show better mechanical behavior under compaction. Poorly graded sands can lead to excessive permeability and are less suitable as subgrade materials without stabilization. From
Figure 23, rubber has Cu of 2.6, and Cc of 0.9. The Cu is below 4 hence not well graded. The Cc is slightly less than 1, suggesting a slightly irregular shape in the gradation curve. This shows very poorly graded, or possibly uniformly graded. The particle sizes are nearly the same, which affects inter-particle contact and load distribution. In civil engineering use (e.g., as a partial replacement material in soils), rubber with such characteristics would likely require blending with well-graded materials to improve performance. Edincliler
et al. (2010) observed that shredded rubber particles with poor gradation and uniform size exhibit lower stiffness and higher compressibility, limiting their use in load-bearing layers without treatment or mixing.
Figure 23. Sieve Analysis Results for Rubber.
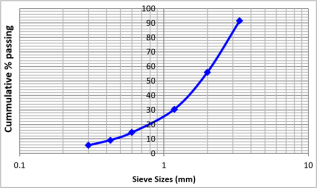
Figure 24 shows plastic Cu = 4.4, Cc = 1.38. The Cu is greater than 4, borderline acceptable for well-graded gravel, but still below 6 for sand. The Cc is within the desired range (1-3). This shows moderately graded, better than sand and rubber.
Although it doesn't meet the strict criteria for "well-graded," its Cc value is optimal, and the Cu is closer to acceptable levels. It may perform relatively better in mixtures or stabilization than the other two materials. Research by Sadek and Tawfiq (2014) shows that plastic wastes, when moderately graded, can be used effectively in subgrade soil improvement, especially when blended with sands or fines.
Figure 24. Sieve Analysis Results for Plastic.
In conclusion, none of the materials meet the full criteria for well-graded materials under USCS. Plastic waste shows the most promising gradation characteristics and could be viable in stabilization applications. Rubber, due to its poor gradation and irregular curve, requires careful engineering design, likely needing combination with fines or stabilizers. Sand, although natural, has a narrow particle distribution, suggesting limited application without modification. For engineering use, especially in soil stabilization, blending these materials or incorporating cementitious additives (e.g., lime, fly ash) could significantly enhance performance.
4.2. Specific Gravity
Specific gravity is a fundamental physical property of materials, defined as the ratio of the density of a material to the density of water at 4°C. It is a dimensionless quantity and is used in engineering, construction, and materials science to identify, classify, and compare materials. From
Table 1, specific gravity of Sand was 2.44. The specific gravity of sand is typically between 2.60 and 2.70, depending on the mineral composition. Sand particles composed mainly of quartz (SiO
2) have a standard specific gravity of about 2.65, which is widely accepted in soil mechanics. A specific gravity of 2.44 is slightly lower than standard, suggesting one or more of the following: Presence of lightweight impurities (e.g., organics, feldspar, or shell fragments). The sand may have been weathered, altering its mineral structure. It could be a fine sand with trapped air or voids influencing the test. This value still falls within the acceptable range for natural soils according to ASTM D854 and is usable in construction and stabilization, although it implies that the material might yield a slightly lower unit weight and weaker mechanical behavior compared to denser sands. Other studies, like
| [13] | Bowles, J. E. (1992). Engineering Properties of Soils and Their Measurement (4th ed.). New York, NY: McGraw‑Hill. |
[13]
and
| [14] | Das, B. M. (2010). Principles of Geotechnical Engineering (7th ed.). Boston, MA: Cengage Learning. |
[14]
report sand specific gravity values ranging from 2.55 to 2.70, with typical engineering sands near 2.65. Therefore, the test result (2.44) suggests a moderately light mineralogy, but not critically outside practical ranges.
Specific gravity of Rubber was 0.96. Rubber, especially natural rubber or recycled tire rubber, is a polymeric material with low density and relatively high elasticity. The typical specific gravity of rubber ranges from 0.91 to 1.20, depending on the type (natural vs synthetic), vulcanization, and carbon black content. A value of 0.96 falls within the expected range, specifically on the lower end, indicating lightweight rubber content with low filler or carbon black concentration. According to
| [15] | Edil, T. B., Bosscher, P. J., & Benson, C. H. (2004). Engineering Properties of Tire Shreds and Soil Mixtures. Geotechnical Testing Journal, 27(4), 419-428. |
[15]
, recycled rubber used in geotechnics (e.g., for lightweight fill, subgrade improvement, or insulation layers) shows specific gravities around 1.00 ± 0.05. The tested result of 0.96 confirms its suitability for such applications, particularly where weight reduction and flexibility are desired.
As for Plastic, the specific gravity was 0.97. Plastics are synthetic polymers, and their specific gravity depends on their molecular structure. Common plastics include: Polyethylene (PE): 0.91-0.96 Polypropylene (PP): 0.90-0.91 Polystyrene (PS): ~1.05 PVC: ~1.38. The result of 0.97 suggests the plastic may be high-density polyethylene (HDPE) or a blend. This aligns with values reported in various materials databases and research, which note that HDPE and PET typically range between 0.94 and 1.05. In geotechnical and construction uses, such plastics are often ground or shredded and used as: Soil modifiers lightweight backfill thermal insulation materials The low specific gravity indicates lightweight behavior, which reduces overburden pressure and is beneficial for embankment and landfill covers. However, it may also imply reduced strength and stiffness, so engineering judgment is required. The values for rubber and plastic fall within expected ranges and confirm their lightweight classification, while the sand's slightly lower value still falls within usable limits but suggests a need for caution if used in load-bearing structures.
Table 1. Specific Gravity of Samples.
Sample | | Specific Gravity |
Sand | 1 | 2.44 |
| 2 | 2.44 |
Average | | 2.44 |
Plastic | 1 | 0.93 |
| 2 | 1.01 |
Average | | 0.97 |
Rubber | 1 | 0.88 |
| 2 | 1.04 |
Average | | 0.96 |
In Conclusion, the specific gravity test results show Sand (2.44) is slightly lower than typical, possibly due to impurities or mineral composition. Suitable for construction but may offer lower unit weight and strength. Rubber (0.96) shows consistent with recycled or natural rubber and indicates a lightweight material ideal for non-structural geotechnical applications. Plastic (0.97): shows typical of HDPE or similar polymers which are suitable for lightweight fill or insulation but not for high-load applications. These results align with values in standard references and published literature.
4.3. Water Absorption Capacity Test
Water absorption is a critical physical property that indicates how much water a material can absorb relative to its dry weight. It significantly influences the behavior of materials in construction and geotechnical applications, affecting parameters like strength, durability, porosity, compaction, and stability. High water absorption can lead to unwanted volume changes, reduced bonding strength, and vulnerability to environmental degradation. This discussion examines the water absorption values of sand (11.31%), rubber (29.42%), and plastic (0%), comparing them with standard values and findings from previous studies. The water absorption of 11.31% for sand is significantly higher than standard values typically expected of good-quality construction sand.
According to
| [16] | ASTM C128 - 15. Standard Test Method for Relative Density (Specific Gravity) and Absorption of Fine Aggregate. ASTM. |
[16]
, natural sand suitable for concrete should have a water absorption range of about 0.5% to 2%, with up to 4% still considered tolerable in less critical applications. A value exceeding 10% suggests that the sand in question is likely composed of highly porous, weathered particles or contains a high proportion of fines such as clay or silt. Such high absorption adversely affects mix designs, as the sand will draw more water from the cement paste, leading to poor workability, lower strength, and possible shrinkage or cracking. Additionally, excess water absorption can interfere with the hydration process in cementitious applications, leading to inconsistent strength development.
| [17] | Neville, A. M. (1995). Properties of Concrete (4th Ed.). Longman Group. Nigeria, |
[17]
also highlights that high absorption sands typically yield concrete of lower density and strength due to their increased porosity.
Table 2. Water Absorption Capacity of Samples.
Sample | Water absorption% |
Sand | 11.31 |
Plastic | 0.00 |
Rubber | 29.42 |
4.4. Water Absorption Capacity Test of Combined Samples
Water absorption is a critical factor in assessing the durability and performance of masonry blocks, especially in environments prone to moisture exposure, such as external walls, pavements, or foundations. Lower water absorption translates into higher resistance to water ingress, reduced deterioration, and improved long-term durability. This discussion evaluates the water absorption behavior of two composite mixes incorporating plastic and rubber as partial sand replacements, and compares the values against established standards and findings in literature.
From
Table 3, Mix 1: 20% Plastic + 20% Rubber + 60% Sand has water absorption of 7.68% which is a significant reduction compared to traditional sand-based concrete or block materials.
Typically, conventional sandcrete blocks have water absorption values ranging from 10% to 15%, and in some cases even higher, especially when unreinforced or poorly cured
| [17] | Neville, A. M. (1995). Properties of Concrete (4th Ed.). Longman Group. Nigeria, |
[17]
. A value below 8% indicates an improvement in water resistance and a tighter pore structure. The inclusion of 20% plastic plays a major role in this improvement. Plastics such as polyethylene and polypropylene are hydrophobic, meaning they repel water and do not absorb moisture. Their presence in the mix likely leads to lower capillary absorption and reduced connectivity between pores, which prevents water from traveling through the block matrix. Similarly, rubber particles, although porous, tend to create a flexible matrix that reduces internal cracking and shrinkage. Despite rubber’s own high absorption (as seen in earlier tests), its behavior when embedded in a composite can contribute to better moisture tolerance due to its elastic and damping nature. Research by
| [18] | Sadek, S., & Tawfiq, H. (2014). Effect of recycled materials on concrete performance. Journal of Construction Engineering and Management, 140(5), 04014006. |
[18]
and
| [19] | Mohammed, B. S. (2019). Performance of Rubberized Concrete Containing Plastic Waste in Aggressive Environments. Journal of Cleaner Production. 227; 1170-1185. |
[19]
supports these findings, reporting that incorporation of waste plastic and rubber reduces the overall porosity and water permeability of concrete composites, especially when optimized at 20-30% replacement levels. This mix is, therefore, more water-resistant and can be considered suitable for external masonry units, paving blocks, or wet-area walls, where exposure to water and moisture is common.
Mix 2: 5% Plastic + 10% Rubber + 85% Sand mix has a water absorption of 10.38%, which is higher than Mix 1 but still within an acceptable range for non-structural blocks, which allows a maximum of 12% water absorption for load-bearing concrete masonry units. The reduced proportion of plastic in this mix (from 20% to 5%) appears to have diminished its water-repelling efficiency. While rubber remains at 10%, its absorptive nature contributes to a slightly more porous composite, especially when plastic is insufficient to form a hydrophobic network in the matrix.
Sand, forming the majority of this mix, inherently retains capillary pores that allow water to be absorbed unless adequately compacted or modified. Although still a viable option for construction, blocks made from this mix may be less suited for water-sensitive environments. They may perform well in interior walling, partitioning, or pavements with limited exposure to water, but additional surface treatment or waterproofing might be necessary in more aggressive environments.
Studies by
| [20] | Basha, S. R. (2020). Use of Plastic Waste in Concrete: A review. Journal of Building Engineering, 28; 10-18. |
[20]
show that higher plastic content tends to seal microvoids and reduce permeability, especially when used in synergy with other fillers like rubber. Therefore, increasing the plastic content above 10% consistently leads to improved impermeability. Moderate water absorption Suitable for internal/non-exposed use The trend shows that increasing plastic content improves water resistance, despite rubber’s high individual absorption. This synergy of plastic's hydrophobicity and rubber's flexibility enhances block integrity under moisture influence.
Table 3. Water Absorption Capacity of Samples for plastic and rubber combination.
Sample Combination | Absorption Capacity% |
20% P+20% R | 7.67 |
| 7.68 |
Average | 7.68 |
5% P+10% R | 10.38 |
P= Plastic; R= Rubber
The water absorption performance of both composite mixes demonstrates the beneficial effect of incorporating plastic and rubber into sand-based blocks. The mix with 20% plastic and 20% rubber clearly exhibits superior water resistance (7.68%), making it well-suited for use in wet environments, external pavements, or coastal areas. On the other hand, the mix with 5% plastic and 10% rubber still performs reasonably well (10.38%) but would be more appropriate for internal or less water-sensitive applications.
These results align with existing standards and are supported by previous research emphasizing the role of waste plastics and rubber in enhancing the impermeability and sustainability of construction materials. Therefore, both mixes demonstrate potential for eco-friendly applications, with the 20% plastic variant offering a clear advantage in moisture durability.
4.5. DOE Results
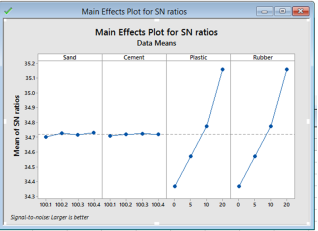
The Design of Experiments (DOE) conducted using the Taguchi approach investigated the effects of incorporating waste materials; plastic and rubber into conventional block by varying the proportions of four key factors: sand, cement, plastic, and rubber. Each factor was assessed at four levels (0%, 5%, 10%, and 20%), with the goal of optimizing sandcrete block performance while promoting sustainable waste reuse. The Taguchi method, known for its systematic and efficient design framework, was applied to minimize the number of experimental runs while accurately identifying the influence of each factor on performance metrics such as compressive strength, durability, and workability.
From the results of the Taguchi analysis, the optimal mix composition was determined as sand = 100%, cement = 100%, plastic = 7.5%, and rubber = 7.5%. This indicates that the best performance was achieved not by reducing the quantities of sand and cement, but by partially substituting 15% of the matric volume with a combined mixture of plastic and rubber equally split. This substitution did not compromise the cement and sand content, suggesting that the added waste materials functioned more as aggregates or fillers, possibly enhancing certain mechanical or durability properties without negatively affecting the structural matrix.
The signal-to-noise (S/N) ratio analysis showed that this specific combination provided the most robust and stable output across multiple performance indicators. The inclusion of plastic and rubber at 7.5% each likely contributed to better flexibility, improved energy absorption, and perhaps reduced brittleness of the final concrete product. However, the analysis also suggests that exceeding this amount might result in diminished performance due to the inert or less-bonding nature of these materials when used in higher proportions. The maintained 100% levels for cement and sand underscore their essential roles in maintaining the concrete’s structural integrity. In summary, the Taguchi DOE approach effectively optimized the mix design.
4.6. Compressive Strength Results of Sandcrete Block
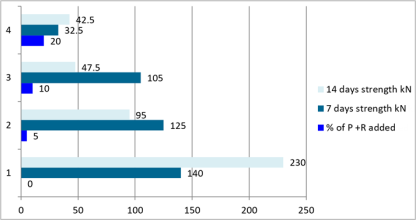
Compressive strength is a vital parameter for assessing the load-bearing capacity and durability of sandcrete blocks, especially in structural and semi-structural applications. In this discussion, compressive strength results (
Figure 26) of blocks made with varying percentages of plastic and rubber as partial sand replacements are analyzed in light of standard requirements, their implications for water resistance, and the findings of other researchers.
Figure 26. Compressive Strength Results of the Blocks.
This control mix, composed entirely of sand and cement, exhibits strong compressive strength progression from 7 to 14 days, with a 64% increase over the curing period. The 14-day value of 230 kN (approximately 5.11 MPa with a 450 mm × 225 mm face area) exceeds the minimum compressive strength specified by Nigerian Industrial Standards (NIS 87: 2004), which require not less than 3.45 MPa at 28 days for sandcrete blocks used in load-bearing walls. The strength increase reflects proper hydration, cement bonding, and a well-compacted matrix.
Such strength also implies relatively low porosity and good water resistance, as dense blocks naturally inhibit water penetration. According to
| [17] | Neville, A. M. (1995). Properties of Concrete (4th Ed.). Longman Group. Nigeria, |
[17]
compressive strength is indirectly related to permeability, as stronger mixes typically have fewer capillaries to permit water ingress. This mix shows an unusual reduction in strength over time (from 125 kN to 95 kN), which is a 24% drop. This anomaly suggests possible issues with bonding or internal stresses developing during the curing period. The initial 7-day strength (approx. 2.78 MPa) is marginally acceptable for non-load-bearing applications, but the 14-day strength (2.11 MPa) falls short of minimum structural standards. This drop could result from the low compatibility of plastic and rubber with cement paste, especially if the particles are not treated or optimized for bonding. Plastics are hydrophobic and inert, while rubber may trap air or moisture within its matrix, interfering with the curing process.
Similar effects were reported by
| [19] | Mohammed, B. S. (2019). Performance of Rubberized Concrete Containing Plastic Waste in Aggressive Environments. Journal of Cleaner Production. 227; 1170-1185. |
[19]
, where untreated rubber and plastic particles reduced concrete strength due to weak interfacial zones. Despite the drop in strength, the presence of hydrophobic materials like plastic and rubber may still improve water resistance, making this mix potentially useful for non-structural applications like boundary walls or paving blocks where moisture exposure is high, but strength demand is low. This mix shows a more pronounced degradation, with compressive strength decreasing by 55% over time.
The final 14-day strength (approximately 1.05 MPa) is well below standard requirements, even for non-load-bearing applications. Such behavior is characteristic of overdosing lightweight or non-reactive fillers, which can disrupt cement hydration, reduce matrix density, and introduce voids.
While the hydrophobic nature of plastic and rubber in this mix may improve resistance to water penetration, the loss in structural integrity limits its usability. It might still be acceptable in landscape elements or erosion barriers where compressive demands are minimal. Although there is a positive strength gain over time (30.7%), the final 14-day strength of 0.94 MPa is extremely low, and far below any standard structural or semi-structural application threshold. This suggests that at 20% replacement, plastic and rubber significantly hinder cement bonding and matrix cohesion. The presence of too many inert, hydrophobic particles creates a weak, open matrix with poor load-bearing capacity. However, such a mix may offer excellent water resistance, as shown in previous tests where this mix yielded the lowest water absorption value (7.68%). This makes it a potential material for drainage-friendly pavers, non-load-bearing moisture barriers, or decorative blocks. Authors such as
| [21] | Safi, B. (2013). Study of the Mechanical Properties of A Concrete Containing Plastic Aggregates. Construction and Building Materials, 47, 1302-1307. |
[21]
confirm that at high replacement levels, plastics and rubber in concrete lead to severe strength reduction but contribute to lower density, higher toughness, and resistance to moisture and cracking.
4.7. Regression and Correlation Analysis Results
From
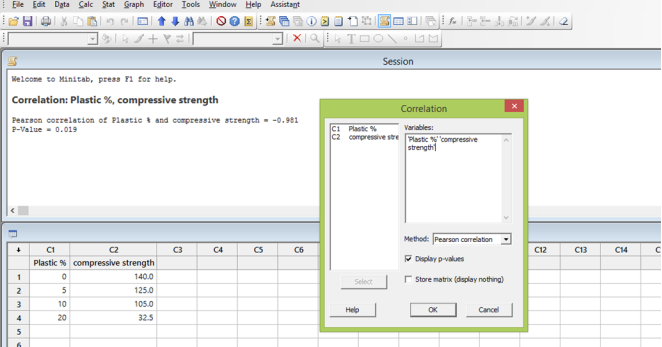
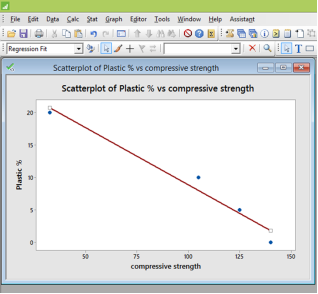
Figure 28, Pearson correlation of Plastic% and compressive strength = -0.981, P-Value = 0.019. This shows strong negative correlation between the plastic% and compressive strength kN. Since p < 0.05, the result is statistically significant.
Figure 27. Scattered Plot of the variables.
The performance assessment of rubber-plastic solid sandcrete blocks in a marine environment using regression analysis in Minitab provides valuable insights into how waste materials affect the durability and strength of construction materials under harsh conditions. The regression model developed was: Performance = 177.0 - 8.37 (Plastic + Rubber)%. This equation indicates that increasing the plastic content in the sandcrete blocks negatively affects their performance, as shown by the negative coefficient (-8.37). This suggests that, for every 1% increase in plastic, the performance (possibly measured in terms of compressive strength or durability index) decreases by 8.37 units. On the other hand, the rubber content has a positive effect, implying that its inclusion may enhance performance to some extent, although the exact coefficient for rubber was not explicitly stated, it is implied to be +1. This reflects the differing influence of these materials: plastic appears to weaken the block in marine exposure, possibly due to poor bonding or increased porosity, while rubber may contribute to improved resilience against moisture and salt penetration.
Figure 28. Scattered Plot of the variables.
The R-squared (R
2) value of 66.85% (
Table 4) indicates that approximately two-thirds of the variability in block performance can be explained by the variation in plastic and rubber content. This suggests that the model has moderate predictive power, although 33.15% of the variation remains unexplained, likely due to other influencing factors such as curing time, water absorption, salt attack, and cement content, which are critical in marine environments.
Table 4. Statistical Analysis Result.
Analysis of Variance |
Source | DF | Adj SS | Adj MS | F-Value | P-Value |
Regression | 1 | 15330 | 15330 | 4.03 | 0.182 |
Plastic + Rubber % | 1 | 15330 | 15330 | 4.03 | 0.182 |
Error | | | 2 | 7601 | 3801 |
Total | | | 3 | 22931 | |
Model Summary | | | | | |
| | S | R-sq | R-sq(adj) | R-sq(pred) |
| | 61.6485 | 66.85% | 50.28% | 0.00% |
However, the p-value of 0.182 indicates that the model is not statistically significant at the conventional 0.05 level. This means there is a high probability (18.2%) that the observed relationship between the waste material content and performance is due to random chance. In practical terms, while there are trends suggesting that plastic reduces and rubber improves performance, these effects are not strong enough to be considered statistically reliable without further data or refinement of the model.









 Share This Article
 Twitter
 Linked In
 Facebook
 Copy
Copy Download