1. Introduction
Particulate matter released by cement, asphalt-concrete and other construction-materials plants degrades air quality, damages equipment and affects the health of the population living near industrial sites. Dust-laden gases are also generated by the thermal processing of dispersed materials, for example by drying in a suspended layer
| [17] | Badalov, A. A., Shaislamov, A. Sh., Badalova, D. A., & Khaydarov, I. B. (2024). Modeling of the drying process of dispersed materials in a weighted layer in order to increase efficiency. AIP Conference Proceedings, 3152, 030011.
https://doi.org/10.1063/5.0219129 |
[17]
. Reduction of such emissions is a stated priority of the environmental policy of Uzbekistan, which was formalised in the Concept of Environmental Protection until 2030
| [1] | Decree of the President of the Republic of Uzbekistan. (2019). No. PF-5863 of 30 October 2019 “On approval of the Concept of Environmental Protection of the Republic of Uzbekistan until 2030” (in Russian). |
[1]
. In practice, the task is to find dry gas-cleaning apparatus that combines high collection efficiency for particles of a few micrometres, moderate hydraulic resistance and robust operation with sticky, abrasive and partly water-soluble dusts, for which wet scrubbers and fabric filters are often unsuitable
| [2] | Strauss, W. (1975). Industrial gas cleaning (2nd ed.). Oxford: Pergamon Press. |
| [3] | Hinds, W. C. (1999). Aerosol technology: Properties, behavior, and measurement of airborne particles (2nd ed.). New York: Wiley. |
| [4] | Semrau, K. T. (1960). Correlation of dust scrubber efficiency. Journal of the Air Pollution Control Association, 10(3), 200–207. |
[2-4]
.
Inertial and cyclone-type separators remain the most widespread dry dust collectors because of their simple design, low cost and tolerance of high temperatures and loadings
| [5] | Hoffmann, A. C., & Stein, L. E. (2008). Gas cyclones and swirl tubes: Principles, design, and operation (2nd ed.). Berlin: Springer. |
| [6] | Uzhov, V. N., Val’dberg, A. Yu., Myagkov, B. I., & Reshidov, I. K. (1981). Ochistka promyshlennykh gazov ot pyli [Cleaning of industrial gases from dust]. Moscow: Khimiya (in Russian). |
| [7] | Ayli, E., & Kocak, E. (2025). A comprehensive review of cyclone separator technology. Canadian Journal of Chemical Engineering, 103(6), 2751–2789.
https://doi.org/10.1002/cjce.25526 |
[5-7]
. The classical engineering approaches to their design are based on the work of Stairmand
| [8] | Stairmand, C. J. (1951). The design and performance of cyclone separators. Transactions of the Institution of Chemical Engineers, 29, 356–383. |
[8]
, Barth
| [9] | Barth, W. (1956). Berechnung und Auslegung von Zyklonabscheidern auf Grund neuerer Untersuchungen. Brennstoff-Wärme-Kraft, 8(1), 1–9. |
[9]
and Leith and Licht
| [10] | Leith, D., & Licht, W. (1972). The collection efficiency of cyclone type particle collectors — a new theoretical approach. AIChE Symposium Series, 68(126), 196–206. |
[10]
, and the flow field in the separator is nowadays commonly analysed with computational fluid dynamics
| [11] | Cortés, C., & Gil, A. (2007). Modeling the gas and particle flow inside cyclone separators. Progress in Energy and Combustion Science, 33(5), 409–452. |
| [12] | Elsayed, K., & Lacor, C. (2011). The effect of cyclone inlet dimensions on the flow pattern and performance. Applied Mathematical Modelling, 35(4), 1952–1968. |
| [13] | Li, B., Gao, L., Li, Y., Zhu, K., Fu, Z., Xu, S., & Li, M. (2026). Review on the optimal design of cyclone separator: Theory, methodology, and applications. Frontiers in Heat and Mass Transfer, 24(3), 3. https://doi.org/10.32604/fhmt.2026.075814 |
[11-13]
. At the same time, a conventional single-inlet cyclone has a cut size of several micrometres and loses efficiency at reduced gas flow, so a considerable amount of fine dust escapes into the atmosphere. Attempts to intensify separation by increasing the swirl, by additional gas streams or by combining several swirl zones usually increase the hydraulic resistance, and therefore the energy consumption, disproportionately.
A promising alternative is the apparatus with swirling counter-current flows, in which two swirling gas streams, the primary and the secondary one, are supplied through separate tangential inlets and meet each other inside a single body
. In a swirling flow the radial pressure gradient balances the centrifugal force, dp/dr ≈ ρVφ
2/r, and the particles, which are much heavier than the gas, are not held by this gradient and migrate towards the wall, whereas the interaction of the two streams is expected to prolong the residence time of the particles in the separation zone, and the wall layer conveys the separated dust to the hopper. The design and the engineering calculation of such apparatus, however, rely on far fewer data than those for cyclones, and the data on dusts of the construction-materials industry of the region are practically absent. Their hydrodynamic characteristics, pressure losses and mathematical description have been addressed in
| [19] | Badalova, D. A., & Badalov, A. A. (2023). Study on the hydrodynamic characteristics of swirl flow device. E3S Web of Conferences, 434, 02018 (ICECAE 2023).
https://doi.org/10.1051/e3sconf/202343402018 |
| [20] | Badalova, D., Khaydarov, I., Badalov, A., & Djoldosheva, T. (2025). Mathematical description of the hydrodynamics of dust collectors with counter swirling flows. AIP Conference Proceedings, 3331, 060017. https://doi.org/10.1063/5.0307350 |
| [21] | Mukhiddinov, D., Badalov, A., Badalova, D., Haidarov, I., & Makhamadjanov, M. I. (2023). Pressure losses in apparatuses with swirling flows. E3S Web of Conferences, 402, 10040. https://doi.org/10.1051/e3sconf/202340210040 |
[19-21]
.
The objective of this work is to establish the relationship between the operating and design parameters of a swirling counter-current dust collector and its hydrodynamic characteristics and collection efficiency. The study continues the authors’ previous investigations of swirling-flow dust collectors
| [18] | Badalova, D. A. (2023). Swirling flow for dust capture. E3S Web of Conferences, 401, 03065 (CONMECHYDRO – 2023). https://doi.org/10.1051/e3sconf/202340103065 |
| [19] | Badalova, D. A., & Badalov, A. A. (2023). Study on the hydrodynamic characteristics of swirl flow device. E3S Web of Conferences, 434, 02018 (ICECAE 2023).
https://doi.org/10.1051/e3sconf/202343402018 |
| [20] | Badalova, D., Khaydarov, I., Badalov, A., & Djoldosheva, T. (2025). Mathematical description of the hydrodynamics of dust collectors with counter swirling flows. AIP Conference Proceedings, 3331, 060017. https://doi.org/10.1063/5.0307350 |
| [21] | Mukhiddinov, D., Badalov, A., Badalova, D., Haidarov, I., & Makhamadjanov, M. I. (2023). Pressure losses in apparatuses with swirling flows. E3S Web of Conferences, 402, 10040. https://doi.org/10.1051/e3sconf/202340210040 |
[18-21]
. The novelty of the study lies in the combined experimental and numerical investigation of a swirling counter-current dust collector with two tangential inlets (UBO-200): a mathematical model of the gas and particle motion is proposed, and the pressure drop, the overall and the fractional collection efficiencies are determined experimentally as functions of the operating mode for dusts of asphalt-concrete and cement production. The following tasks were solved: (i) the properties of the dusts emitted by the asphalt-concrete and cement production were characterised; (ii) a mathematical model of the gas and particle motion in the apparatus was formulated; (iii) the velocity and static pressure fields, the pressure drop and the overall and fractional collection efficiencies were determined experimentally; and (iv) the rational operating mode of the collector was identified.
2. Literature Review
2.1. Characteristics of the Dusts
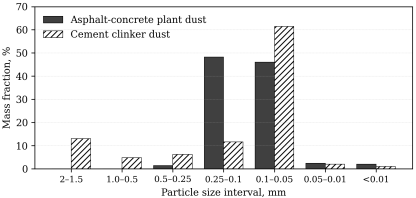
Two dusts of the construction-materials industry were studied. The first one was sampled at an asphalt-concrete plant in the Khojaobod district, and the second, cement clinker dust, at a cement plant in the Asaka district (Andijan region). The dispersed composition of the first two dusts, determined on 50 g samples (for the methods of dispersion analysis see
| [15] | Kouzov, P. A. (1987). Osnovy analiza dispersnogo sostava promyshlennykh pylei i izmel’chennykh materialov [Fundamentals of the dispersion analysis of industrial dusts and milled materials] (3rd ed.). Leningrad: Khimiya (in Russian). |
[15]
), is given in
Table 1 and
Figure 1.
Table 1. Dispersed composition of the dusts (sample mass 50 g).
Size Interval, mm | Asphalt-concrete plant dust | Cement clinker dust |
g | % | g | % |
2.0–1.5 | – | – | 6.5 | 13.0 |
1.0–0.5 | – | – | 2.4 | 4.8 |
0.5–0.25 | 0.7 | 1.4 | 3.1 | 6.2 |
0.25–0.1 | 24.1 | 48.2 | 5.8 | 11.6 |
0.1–0.05 | 23.0 | 46.0 | 30.7 | 61.4 |
0.05–0.01 | 1.2 | 2.4 | 1.0 | 2.0 |
< 0.01 | 1.0 | 2.0 | 0.5 | 1.0 |
Total | 50.0 | 100.0 | 50.0 | 100.0 |
Figure 1. Dispersed composition of the asphalt-concrete plant dust and the cement clinker dust.Dispersed composition of the asphalt-concrete plant dust and the cement clinker dust.
The particle density of both dusts is 2900 kg/m3. The dusts are non-toxic and neither flammable nor explosive. The asphalt-concrete plant dust is moderately adhesive and insoluble in water, whereas the clinker dust is adhesive and partly soluble in water, which makes wet cleaning of it unfavourable and favours dry inertial separation. The asphalt-concrete dust is dominated by particles of 0.25–0.05 mm (94% of the mass), and 61% of the clinker dust belongs to the 0.1–0.05 mm class, but the latter also contains a coarse fraction of 1.5–2 mm (13%).
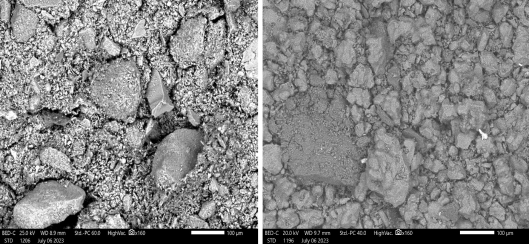
The morphology and the elemental composition of the particles were examined by scanning electron microscopy with energy-dispersive X-ray spectroscopy (
Figure 2). The asphalt-concrete dust consists of irregular mineral grains with abundant fine fragments, and its spectrum is dominated by oxygen and silicon with admixtures of calcium, aluminium, iron, magnesium, sodium, potassium, titanium and manganese. The clinker dust is built of angular, partly sintered crystalline grains; its spectrum is dominated by calcium, followed by oxygen and silicon, with magnesium, aluminium, sulphur, potassium and iron.
Figure 2. Scanning electron micrographs (×160, scale bar 100 µm): (a) asphalt-concrete plant dust; (b) cement clinker dust. Scanning electron micrographs (×160, scale bar 100 µm): (a) asphalt-concrete plant dust; (b) cement clinker dust.
2.2. Experimental Setup and Procedure
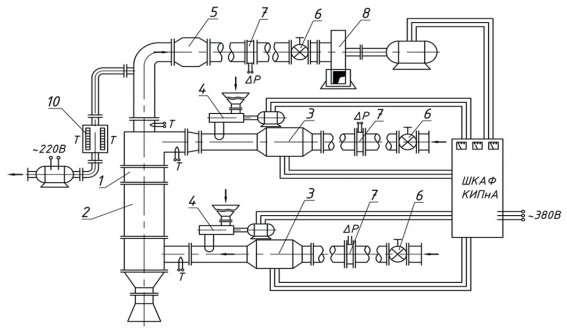
The investigations were carried out on the UBO-200 collector with a body diameter of 0.2 m (
Figure 3). The gas is supplied into the apparatus by two independent tangential inlets, the primary and the secondary one, so that two swirling streams meet each other inside the body (swirling counter-current flows). Dust is fed into each of the streams by a screw-type feeder; the cleaned gas leaves through the axial outlet tube, and the separated material is discharged from the hopper through an air-lock valve. The flow rates in the channels were regulated by dampers and measured with Pitot tubes connected to MMN-240 micromanometers and U-tube manometers. The operating mode of the apparatus was characterised by the total flow rate Q = Q1 + Q2 and by the flow-split ratio K = Q2/Q.
Figure 3. Schematic of the experimental setup: dust collector with two tangential gas inlets (primary and secondary flows), dust feeders, dampers, Pitot tubes, micromanometers and U-tube manometers.Schematic of the experimental setup: dust collector with two tangential gas inlets (primary and secondary flows), dust feeders, dampers, Pitot tubes, micromanometers and U-tube manometers.
During the tests the static pressure differences ΔP1 between the inlet and the outlet of the primary flow and ΔP2 between the inlet and the outlet of the secondary flow were recorded. The hydraulic resistance was determined for K between 0.62 and 0.8 at various gas loads. The static pressure fields were measured in six cross-sections of the body (H = 0, 0.08, 0.16, 0.24, 0.30 and 0.40 m) at K = 0.6, 0.7 and 0.8, and the axial velocity profiles were measured with a Pitot tube in the inlet and outlet sections.
The collection efficiency was determined after the operating mode had been fixed (total flow rate and the ratio K). The gas velocity in the outlet tube was measured with a Pitot tube, and the dust samples were taken isokinetically with a NIIOGAZ sampling tube connected through an adapter to an AFA-VP-20 filter holder. The calculation of the overall and fractional efficiencies is described in Section 2.5.
2.3. Mathematical Model of the Gas Flow
The gas flow was treated as steady, axisymmetric flow of an ideal incompressible fluid described by the Euler equations in the stream-function formulation for swirling flows
| [14] | Loitsyansky, L. G. (1966). Mechanics of liquids and gases. Oxford: Pergamon Press. |
| [20] | Badalova, D., Khaydarov, I., Badalov, A., & Djoldosheva, T. (2025). Mathematical description of the hydrodynamics of dust collectors with counter swirling flows. AIP Conference Proceedings, 3331, 060017. https://doi.org/10.1063/5.0307350 |
[14, 20]
. This is justified by the flow conditions: for the flow rates studied (760–4000 m
3/h) the Reynolds number based on the body diameter (0.2 m) and the mean axial velocity is about 9·10
4–5·10
5 (Re ≫ 1), the Mach number is about 0.1 or lower (Ma ≪ 1, air at 20°C), and the gravity effect on the gas is negligible (gl/V
2 ≲ 0.1 for l = 0.4 m, the height of the working zone). With the stream function ψ and the circulation G = rVφ,
the conservation of angular momentum and the Bernoulli–Euler relations reduce the problem to a single elliptic equation for ψ:
(2)
where κ is the swirl parameter (the coefficient of the linear relation G = κψ between the circulation and the stream function; it is not to be confused with the flow-split ratio K) and H′ψ = dH/dψ is the derivative of the total head with respect to the stream function. Both quantities are determined from the momentum balance on the outlet cross-section of the apparatus, which makes them dependent on the flow rates and on the geometry of the inlets. Equation (
2) is solved in the computational domain bounded by the walls, the inlets and the outlet; the boundary values of ψ are specified along the contour of the apparatus, which is traversed counter-clockwise starting from the characteristic point O1 of the design scheme. The equation was discretised on a rectangular (r, z) mesh and solved by a relaxation (iterative finite-difference) procedure: at every iteration the values of ψ at the internal nodes are updated from the neighbouring nodes, the residual R = max|ψ(i) − ψ(i−1)| is evaluated, and the iterations are stopped when R < ε. The velocity components are then calculated from ψ by Eq. (
1).
Although the apparatus has two tangential inlets, the model describes the circumferentially averaged flow: the inlets are represented by boundary conditions for ψ and G specified along the inlet sections, i.e. the supplied streams are assumed to be uniformly distributed over the circumference. This is the usual approximation of the theory of swirling flows. It describes the mean axial and tangential velocity components away from the inlets, but it does not resolve the azimuthally non-uniform, three-dimensional flow close to the inlet sections, which is a limitation of the present model (Section 4.4).
2.4. Motion of the Solid Phase
The motion of the solid phase was simulated by tracking individual spherical particles of diameter d and density ρp in the calculated gas flow field. Newton’s second law for a particle with the velocity U in the gas flow with the velocity V has the form
(3)
where m is the particle mass, ρg is the gas density and ξ is the drag coefficient, which depends on the particle Reynolds number. In the cylindrical coordinates (r, φ, z) the equation turns into the system
(4)
where the components of the relative velocity vector ω = U − V are
(5)
Integration of the system gives the particle trajectories, the residence time of the particles in the apparatus, the minimum size of the particles that are retained, and the fractional collection efficiency.
2.5. Evaluation of the Collection Efficiency
The overall collection efficiency was calculated from the dust concentrations in the gas at the inlet, Cin, and at the outlet, Cout, of the apparatus (the volumetric flow rate is the same at both sections):
The fractional efficiency ηi for the size class i was determined from the mass fractions of this class in the dust collected in the hopper, wc,i, and in the dust escaping with the cleaned gas, we,i:
(7)
where η is the overall efficiency given by Eq. (
6). The cut size d50 is the particle size at which η
i = 0.5.
3. Results
3.1. Velocity and Static Pressure Fields
The calculated fields of the tangential, axial and radial velocity components in the sections Z/H = 0.25, 0.5 and 0.75 of the UBO-200 collector at Q1 + Q2 = 0.22 m3/s and K = 0.8 and 0.6 show a near-axis zone of low axial velocity, a maximum of the tangential component at an intermediate radius and a sign change of the radial component. The axial-velocity profiles in the annular inlet sections and in the outlet tube were measured with the Pitot tube and compared with the calculation: both the measured and the calculated profiles are close to parabolic, with the maximum approximately in the middle of the channel, and a change of the flow-split ratio mainly scales the profile without altering its shape. The agreement is thus qualitative with respect to the shape of the profiles. For the axial-velocity profile in the outlet tube, the measured points scatter about the calculated curve by about 5% of the maximum velocity on average and by up to about 14% near the wall (estimated from the plotted data).
The static pressure decreases monotonically from the periphery of the apparatus towards its axis, and the steepest gradient is observed within the radius range of about 0.01–0.03 m. The pressure fields measured in the six cross-sections at K = 0.6, 0.7 and 0.8 are similar in shape, and the variation of the profile along the height of the body is smaller than that across the radius. In the outlet tube the static pressure increases from the axis towards the wall, and the curves for K = 0.6–0.8 at Q = 0.22 m3/s nearly coincide.
3.2. Hydraulic Resistance
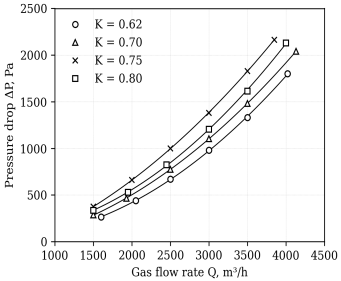
The dependence of the pressure drop on the gas flow rate is shown in
Figure 4. Over the whole range of flow rates, the pressure drop rises from 0.27–0.38 kPa at Q = 1500 m
3/h to 1.8–2.1 kPa at Q ≈ 4000 m
3/h. Fitting the measurements by the power law ΔP = a·Qn gives the exponent n between about 1.9 and 2.1 for all the flow-split ratios studied (a regression approach to empirical dependences, cf.
| [22] | Nazirova, H., Nazirova, O., Toshxoʻjayeva, M., Badalova, D., & Ramazonov, B. (2025). Optimization of electricity loss forecasting using [complete title to be added]. AIP Conference Proceedings, 3331, 060027. https://doi.org/10.1063/5.0305944 |
| [23] | Allaev, K., Nazirova, H., & Badalov, A. (2025). Forecasting of electricity losses using the polynomial regression method. AIP Conference Proceedings, 3331, 030008.
https://doi.org/10.1063/5.0305943 Simulation and Experimental Study of Rotary Tillage Blades. Agriculture Journal, 2023. |
[22, 23]
), i.e. the hydraulic resistance coefficient of the apparatus, defined as in
| [16] | Idel’chik, I. E. (1992). Spravochnik po gidravlicheskim soprotivleniyam [Handbook of hydraulic resistance] (3rd ed.). Moscow: Mashinostroenie (in Russian). |
| [21] | Mukhiddinov, D., Badalov, A., Badalova, D., Haidarov, I., & Makhamadjanov, M. I. (2023). Pressure losses in apparatuses with swirling flows. E3S Web of Conferences, 402, 10040. https://doi.org/10.1051/e3sconf/202340210040 |
[16, 21]
, is practically independent of the flow rate. At the same flow rate, the pressure drop at K = 0.70–0.80 is 15–40% higher than at K = 0.62, the highest values being observed at K ≈ 0.75.
Figure 4. Pressure drop of the collector versus the gas flow rate at different flow-split ratios K.Pressure drop of the collector versus the gas flow rate at different flow-split ratios K.
3.3. Collection Efficiency
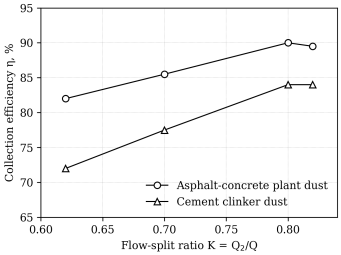
The collection efficiency was investigated at a total flow rate of 760 m
3/h for the two dusts (
Figure 5,
Table 2). For both dusts, the efficiency increases with the flow-split ratio K, passes through a maximum at K ≈ 0.8, and at K = 0.82 it remains unchanged (clinker dust) or decreases by about 0.5 percentage point (asphalt-concrete plant dust). From K = 0.62 to K = 0.8 the efficiency grows by 8 percentage points for asphalt-concrete plant dust and by 12 points for clinker dust. At the optimum, the lowest efficiency (84%) was obtained for the clinker dust, although it contains the coarsest particles, whereas the asphalt-concrete plant dust, in which 94% of the mass is concentrated in the 0.25–0.05 mm classes, was retained with an efficiency of 90%.
The fractional efficiency at K = 0.8 is practically the same for the dusts studied: the curves plotted on the probability scale are close to straight lines and form a narrow band. The cut size (50% efficiency) is about 1.5–2 µm, the efficiency exceeds 90% for particles larger than about 4 µm and 99% for those larger than about 6.5 µm, and it approaches 99.9% at 8–9 µm.
Figure 5. Collection efficiency versus the flow-split ratio K at Q = 760 m3/h.Collection efficiency versus the flow-split ratio K at Q = 760 m3/h.
Table 2. Overall collection efficiency η, % (approximate values, Q = 760 m3/h).
Dust | K = 0.62 | K = 0.70 | K = 0.80 | K = 0.82 | Gain 0.62→0.80, points |
Asphalt-concrete plant dust | 82.0 | 85.5 | 90.0 | 89.5 | 8.0 |
Cement clinker dust | 72.0 | 77.5 | 84.0 | 84.0 | 12.0 |
3.4. Effect of the Inlet Dust Loading
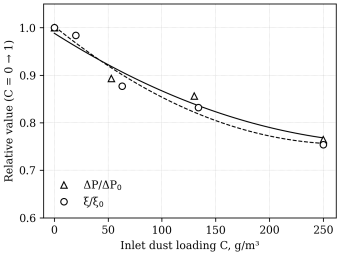
The effect of the dust loading of the gas on the hydraulic characteristics was studied at Q1 + Q2 = 0.211 m
3/s and K = 0.8 (
Figure 6). With the growth of the inlet dust concentration up to approximately 250 g/m
3 the pressure drop decreased by about 24%, and the hydraulic resistance coefficient ξ, which relates the pressure drop to the dynamic head of the gas, by about 25%.
Figure 6. Relative pressure drop and hydraulic resistance coefficient versus the inlet dust loading C (K = 0.8, Q = 0.211 m3/s).Relative pressure drop and hydraulic resistance coefficient versus the inlet dust loading C (K = 0.8, Q = 0.211 m3/s).
4. Discussion
4.1. Flow Structure and Hydraulic Resistance
The calculated sign change of the radial velocity component and the low axial velocity near the axis indicate the presence of a recirculation zone, which is likely to be responsible for the long residence time of the particles in the apparatus. The close-to-quadratic growth of the pressure drop with the flow rate (n ≈ 1.9–2.1) means that the hydraulic resistance coefficient of the collector is practically independent of the flow rate, as is typical for a fully developed turbulent swirling flow
| [21] | Mukhiddinov, D., Badalov, A., Badalova, D., Haidarov, I., & Makhamadjanov, M. I. (2023). Pressure losses in apparatuses with swirling flows. E3S Web of Conferences, 402, 10040. https://doi.org/10.1051/e3sconf/202340210040 |
[21]
. The influence of the flow split on the resistance is moderate, and the weak sensitivity of the outlet pressure field to K suggests that the flow split mainly redistributes the swirl inside the body rather than the losses in the outlet tube.
4.2. Collection Efficiency
The maximum of the efficiency at K ≈ 0.8 may be explained by the balance of the two swirling streams: at small K the secondary stream is probably too weak to form a stable interaction zone with the primary one, whereas at K > 0.8 the primary stream is weakened and no longer maintains it. The value K ≈ 0.8 can therefore be regarded as the rational operating mode of the collector within the investigated range. The effect of K is the stronger the less efficiently the dust is retained, which suggests that the collection of fine particles depends mainly on the intensity of the interaction zone, whereas coarse particles are separated by inertia in almost any mode.
The lower efficiency for the clinker dust, despite its coarser composition, may be associated with the friable crystalline structure and the adhesiveness of the clinker, which can favour attrition of the grains and the secondary entrainment of the resulting fines from the wall layer; these mechanisms were not verified separately in the present work. The fractional efficiency curves of the dusts studied nearly coincide (Section 3.3): particles larger than about 8–9 µm are retained with an efficiency of about 99.9%, so the overall efficiency is determined by the content of the finest fractions in the dust, which explains the differences in
Figure 5 and
Table 2.
4.3. Effect of the Dust Loading and Practical Implications
A possible explanation of the decrease of the pressure drop and of the resistance coefficient with growing dust loading is the interaction of the particles with the swirling flow: the dispersed phase may partly take over the swirl of the gas and reduce the turbulent exchange in the near-wall layer. This feature is favourable for operation at high loadings, which are typical for the dedusting of dryers and mixers in the asphalt-concrete production and of kiln gases in the cement industry. A combination of the collector with a heat exchanger for the recovery of the heat of hot process gases is possible, but it requires a separate investigation.
4.4. Limitations
The efficiency data were obtained on a laboratory-scale collector at one total flow rate (760 m3/h), and the dust-loading tests at one flow-split ratio (K = 0.8). The model is axisymmetric and therefore does not resolve the three-dimensional flow near the two tangential inlets; its experimental verification is limited to the axial-velocity profiles and the static pressure, and the agreement is so far qualitative. The efficiency values are given without a statistical analysis of the repeated runs. The scale-up of the results to industrial apparatus, the effect of the gas temperature and humidity, and a quantitative comparison of the calculated and measured fractional efficiencies require further investigation.
5. Conclusions
1) The dusts emitted by the asphalt-concrete and cement production (particle density 2900 kg/m3) are polydisperse: 94% of the asphalt-concrete dust lies in the 0.25–0.05 mm range, and the clinker dust contains 61% of 0.1–0.05 mm particles and 13% of 1.5–2 mm particles. Their adhesiveness and, for clinker, solubility in water make dry inertial cleaning the preferable option.
2) A mathematical model of the swirling counter-current apparatus was developed on the basis of the Euler equations for the axisymmetric flow in the stream-function form, supplemented with the equations of particle motion in cylindrical coordinates. The model reproduces the main features of the velocity and static-pressure fields and makes it possible to take the operating and design parameters of the apparatus into account; its quantitative verification is a subject of further work.
3) The pressure drop of the UBO-200 collector increases almost quadratically with the flow rate (exponent 1.9–2.1) from about 0.3 kPa at 1500 m3/h to about 2.1 kPa at 4000 m3/h, and depends moderately on the flow-split ratio K. The pressure drop and the hydraulic resistance coefficient decrease by about one quarter with the growth of the dust loading.
4) The collection efficiency has a maximum at K ≈ 0.8, which is the rational operating mode within the range studied (K = 0.62–0.82): about 90% for asphalt-concrete plant dust and 84% for clinker dust. Particles larger than about 4 µm are collected with an efficiency above 90%, and those of 8–9 µm with an efficiency of about 99.9%.
5) The obtained dependences and the proposed model can be used for the preliminary engineering calculation and design of energy-efficient dry dust collectors for the construction-materials industry.
Author Contributions
Badalova Dildora Abdumalikovna: Conceptualization, Data curation, Formal Analysis, Funding acquisition, Investigation, Methodology, Resources, Software, Validation, Writing – original draft, Writing – review & editing
Muhtarov Farrux Handamovich: Conceptualization, Data curation, Formal Analysis, Funding acquisition, Investigation, Methodology, Resources, Software, Validation, Writing – original draft, Writing – review & editing
Unarov Abdurauf Norbayevich: Funding acquisition, Investigation, Methodology, Resources, Software, Validation, Writing – original draft, Writing – review & editing







 Share This Article
 Twitter
 Linked In
 Facebook

 Copy
 Download