Phosphorus is an important plant nutrient affecting the growth and production of crop in the study area. Most crops require significant quantities of P during the early stages of growth and phosphorus requirements for optimum yields vary with different crop types. Fertilizer requirement mapping is related to the system of determining fertilizer required by specific crop production type for specific area on the basis of soil sample testing results. In order to make efficient fertilizer application for Teff at Debre Libanos district, the study was conducted to map phosphorus requirement for Teff crop. Starting from soil sample collection, laboratory analysis and interpretation and mapping standard methods were used. The total soil samples collected for Teff potential kebeles were 95 and phosphorus requirement mapping was done based on collected and analyzed soil samples. Based on the laboratory result, phosphorus requirement was calculated by subtracting initial soil phosphorus from phosphorus critical for Teff crop at the study area. Based on the laboratory results and spatial analysis done to map p-requirement, Teff potential kebeles in the study area require high (25 to 36.7ppm) at P-value ranged between 10.9-9.0 (medium) and low (4.6-10) at P-value ranged between 14.2-13.4 (high) phosphorus fertilizer. Accordingly, phosphorus fertilizer application rate for Teff crop might be very efficient by using the map, otherwise using the mean rate (21.6ppm) suitable than blanket phosphorus fertilizer application.
This is an Open Access article, distributed under the terms of the Creative Commons Attribution 4.0 International License (http://creativecommons.org/licenses/by/4.0/), which permits unrestricted use, distribution and reproduction in any medium or format, provided the original work is properly cited.
Phosphorus plays an important part in many physiological processes that occur within a developing and maturing plant. It is involved in enzymatic reactions in the plant and essential for cell division because it is a constituent element of nucleoproteins which are involved in the cell reproduction processes
[1]
Taliman N.A., Dong Q., Echigo K., Raboy V. and Saneoka H., 2019. Effect of phosphorus fertilization on the growth, photosynthesis, nitrogen fixation, mineral accumulation, seed yield, and seed quality of a soybean low-phytate line. Plants, 8:11.
[2]
Lambers H., 2022. Phosphorus Acquisition and Utilization in Plants. Annual Review Plant Biology; 73:17-42.
. Phosphorus promotes healthy root growth, promotes early shoot growth, speeds ground cover for erosion protection, enhances the quality of fruit, vegetable and grain crops and is vital to seed formation
[3]
Razaq M., Zhang P. and Shen H-l, S. 2017. Influence of nitrogen and phosphorus on the growth and root morphology of Acer mono. 12: 1-13.
[3]
.
Phosphorus is classified as a fertilizer element, being the second ingredient given in percent content as the P2O5 form and phosphorus fertilization is a major input in crop production, as many soils lack sufficient P for effective crop production
[4]
Hasan M. M., Silva J. A. T and Li X. 2016. Regulation of phosphorus uptake and utilization: transitioning from current knowledge to practical strategies.
[4]
. To optimize crop nutrition, P must be available to the crop in adequate amounts early in the growing season. Phosphorus is needed from the earliest stages of crop growth, because it is important in nearly all energy-requiring processes in the plant and its stress early in the growing season will reduce crop productivity more than P restrictions later in the year
[5]
Lynch, J.P. and Brown, K.M., 2008. Root strategies for phosphorus acquisition. In the Eco-physiology of plant-phosphorus interactions. Springer Netherlands, 83-116.
[6]
Veronica N., Subrahmanyam D., Vishnu Kiran T., Yugandhar P., Bhadana V.P. and Padma, V. et al., 2017. Influence of low phosphorus concentration on leaf photosynthetic characteristics and antioxidant response of rice genotypes. Photosynthetica, 55: 285-293.
[5, 6]
.
In Ethiopia, there were sites specific calibration studies to shift blanket rate of fertilizer recommendation and the phosphorus requirements of some crops are already known, even though most of the research sites were different and concerned to soil variability spatially. In response to this, Oromia Agricultural Research Institute (OARI) has started site specific calibration studies before a decade by its four soil research centers and other centers. At the end of calibration work it is known that every soil research center of OARI initiates for further verification activities of the study area.
Soil test based crop response phosphorus calibration study is important for Teff crop in Ethiopia due to its importance to determine the optimum phosphorus fertilizer application rate for maximizing Teff production. Application of both nitrogen (N) and phosphorus (P) fertilizers significantly improved the grain yield of Teff and soil test based crop response phosphorus calibration studies provide valuable insights for optimizing Teff crop production in Ethiopia
[7]
Gidane T. 2016. Verification and demonstration of soil test crop response based based phosphorus fertilizer recommendation rate on yield of teff in vertisol of Northern Ethiopia.
[8]
Girma C.. 2016. Soil test phosphorous calibration for potato production on Nitisols of central highlands Ethiopia. Ethiopian Journal of Science and Sustainable Development, 120-137.
[7, 8]
.
Soil mapping tries to segregate a landscape/district into units having similar soil properties. As soil properties determine fertilizer requirement, the fertilizer recommendation area can be delineated. Fertilizer requirement map is the digital map that shows the amount of fertilizer required by specific crop in given area and site specific soil fertility management is economically optimum application rates of fertilizers/inputs/ due to its importance to determine fertilizer requirement, fertilizer recommendation and identify soil physical and chemical properties and soil fertility maps and fertilizer requirement maps were made from composite soil samples collected and analyzed in the laboratory using geo statistical interpolations systems to predict for non-sampled locations based on each parameters.
Hence this activity was initiated to integrate the environmental factors in comprehensive manner through application of and remote sensing tools and the comparison of geo-statistical equations were used in solving the problem of interpolation biasness. That is where site specific fertilizer recommendations are more comprehensive and beneficial since they can help to tailor fertilizer use more efficiently. Soil test crop response based phosphorus calibration studies was conducted at Debre Libanos district by Fitche Agricultural Research Center and the center determined and verified Pc and Pf and following this activity fertilizer requirement map for wheat crop was done in order to give fertilizer recommendation for the study area. Therefore the study is initiated with the following objectives: to map phosphorus requirement for Teff at Debre Libanos district and to provide phosphorus requirement map at kebele level in order to guide farmers in the study area.
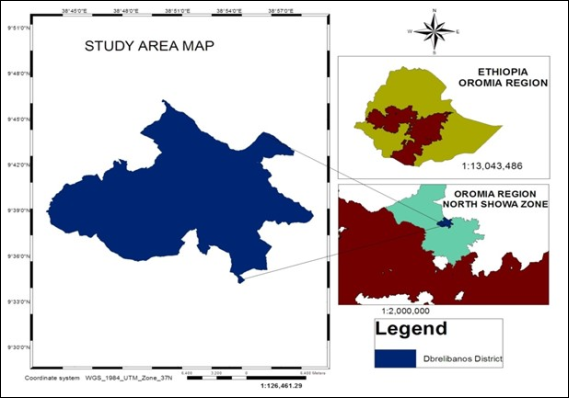
Figure 1. Location Map of Debre Libanos district in North Shewa Zone.
2. Materials and Methods
2.1. Description of the Study Area
The experiment was conducted in Debre Libanos district of North Shewa Zone, Oromia, central high lands of Ethiopia. The district was 89Km away from Finfine to North West. The geographical location of district ranges from 09°36’0’’ and 09°45’0” North and 038°45’00’’ and 39°0’00’’ East. The mean annual rainfall of the area is about 1000mm that ranges from 800 to 1200mm. The maximum and minimum annual temperature is 23°C and 15°C, respectively. Agricultural production is characterized by a mixed crop-livestock production system.
2.2. Methods
Soil sampling and Analysis
Composite soil samples were collected at a depth of 0-20cm
[9]
EthioSIS (Ethiopia Soil Information System) 2014. Soil fertility status and fertilizer recommendation atlas for Tigray regional state, Ethiopia.
[9]
from each sampling points and the collected composite soil samples were air dried, grounded, and sieved using 2 mm sieve and analyzed for available phosphorus, using standard laboratory procedures at Fitche Agricultural Research Center.
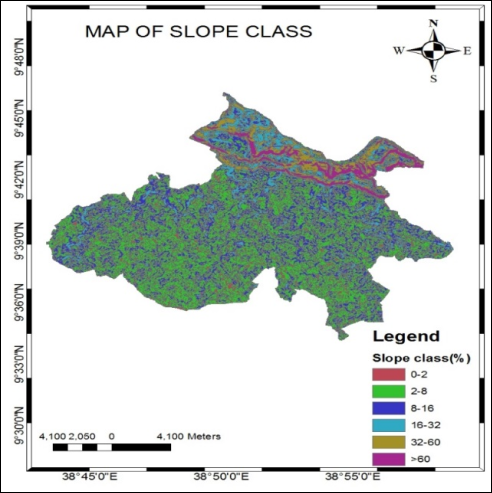
Figure 2. Slope Map of Debre Libanos district in North Shewa Zone.
2.3. Soils Types
Soil is a biologically active, porous medium that has developed in upper most layer of earth’s crust. It serves as reservoir of water and nutrients, participates in the cycling of elements, and supports the growth of plants and soil organism
[10]
Brady, C. N., and Weil, R. R. 2014. The nature and properties of soils, USA, 401-442.
[10]
. The dominant soil types observed in the district were Cambic Arenosols, Orthics Luvisols and Pellic Vertisols respectively.
2.4. Topography
Topography is recognized as a critical factor influencing soil characteristics and agricultural productivity in the given area. The primarily variations in soil properties influenced by climate are controlled by slope percent and slope aspect
[11]
Su T., Xu Q., Zhang F. C., Chen Y., Li L. Q., and Wu W. H. et al. 2015. Modulates phosphate homeostasis through regulating phosphate translocation and acquisition in Arabidopsis. Plant Physiology. 167: 1579-1591.
[11]
. Topography not only contributes to the variation in soil properties, but also determines the types of crops that can be grown in different land uses. In the study area, majority of the areas under considerations were suitable for crop cultivation and the topography is characterized by flat, undulating, moderately sloping, moderately steep, steep and very steep as indicated in (Table 1).
Table 1. Description and slope percentage of the study area.
S/No
Slope (%)
Description
Suitability for agriculture
1
0-2
Level/flat
Suitable
2
2-8
Undulating
3
8-16
Moderately sloping
4
16-32
Moderately steep
Marginal
5
32-60
Steep
Not suitable
6
>60
Very steep
Source:
[12]
Food and Agriculture Organization (FAO) 2006. Guidelines for soil description. 4th Edition, Rome.
[12]
2.5. Land Use/Cover
Of the total area of the district, land under cultivation covered the largest area of the district, accounting for about 62.4% of the total area of the district. Grazing land covered 2.84%, while forest and shrub land covered about 2.87% of the total area of the district respectively
[13]
Agriculture and Rural Development of Oromia (ARDO) 2005. Socio-economic profile of North Shewa zone.
[13]
.
2.6. Phosphorus Requirement Calculation
Using the equation PR = (Pc - Po) * Pf, each sample's phosphorus requirement (PR) for Teff crop was calculated, where Pc is the phosphorus critical level for Teff, Po is the measured available phosphorus in the soil, and Pf is the phosphorus requirement factor for Teff. This comprehensive process of soil sampling, analysis and phosphorus requirement calculation is important in phosphorus fertilizer requirement mapping, ultimately ensuring accurate and data-driven phosphorus application for optimal Teff production in the study area.
2.7. Phosphorus Fertilizer Requirement Mapping
Mapping of phosphorus requirement was done by using spatial analysis tool of ArcGIS10.8 at scale needed. The map was prepared for fertilizer rate (ppm) for P-required for the crop at kebele level. Particularly, the difference of phosphorous critical level for Teff (Pc = 15ppm) and the values of sampled points or soil initial phosphorous (Po) was used to calculate and phosphorous requirement mapping.
3. Results and Discussionds
3.1. Soil Samples
The total number of soil samples collected to determine available phosphorus for Teff potential kebeles in Debre Libanos district were 95 and the soil sample collected were submitted to the laboratory and prepared properly for analysis. Based on the laboratory results analyzed by Olsen method, the maximum and minimum values for available phosphorus and phosphorus requirement (ppm) was recorded in the Teff growing areas of Debre Libanos district depending on the soil Pc and Pf determined during calibration study as shown in (Table 2).
3.2. Available Phosphorus
The value of available phosphorus was obtained from soil fertility assessment and mapping conducted and used for phosphorus requirement mapping for the study area. Accordingly, the highest (14.9ppm) and lowest (7.78ppm) values were observed for area under consideration (Table 2). The variation of P-value obtained might be due to variation in soil parent materials, soil texture and soil pH in the study sites. According to ratings suggested by
[14]
Olsen, S. R., Cole C. V., Watanabe F. S. and Dean L. A. 1954. Estimation of available phosphorus in soils by extraction with sodium carbonate. USDA Circular, 1-19.
[14]
, the available P contents of soils were categorized under medium (5-10) and high (>10) soil P rating.
3.3. Phosphorus Requirement
Most crops require significant quantities of P during the early stages of growth and phosphorus requirements for optimum yields vary with different crop types. Based on the variability of available soil phosphorus and crop phosphorus critical level developed through calibration and the result of verification study for the study area. Crop phosphorus requirement was calculated using (po-pc)*pf set by
[15]
Yesuf A. et al. 2005. Phosphorus Critical Level and Optimum Nitrogen Rate Determination on Teff for Sustainable Soil Fertility Management and Economical Teff Production.
[15]
for Teff. In the study area, the critical phosphorus level (Pc) for potential Teff crop growing kebele was 15. Consequently, the highest (36.7ppm) and lowest (4.6ppm) values of phosphorus requirement was recorded in the study area respectively as shown in (Table 2).
Table 2. Statistical values of available phosphorus and phosphorus requirement (ppm).
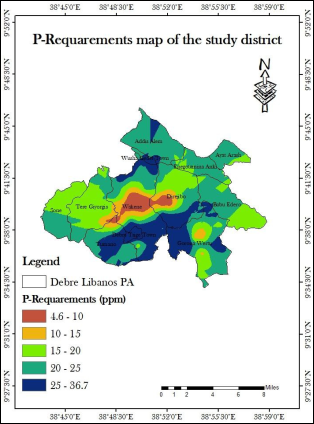
Figure 3. Phosphorus requirement map of the study area.
3.4. Phosphorus Requirement Mapping
The map of phosphorus requirement was done for Teff crop at Debre Libanos district and the rate of phosphorus requirement were classified into different categories of specific intervals based on the number of recommendations. Based on the laboratory results and spatial analysis done to map p-requirement, Teff potential kebeles in the study area require high (25 to 36.7ppm) at P-value ranged between 10.9-9.0 (medium) and low (4.6-10) at P-value ranged between 14.2-13.4 (high) phosphorus fertilizer respectively (Table 3). Accordingly, phosphorus fertilizer users can identify more relative rate for Teff crop production in the study area and the map of phosphorus requirement for Teff potential kebeles of Debre Libanos district was shown in (Figure 3) and also predicted for the whole unknown locations.
Table 3. Phosphorus requirement (ppm) for Debre Libanos district.
S/No
Available P (ppm)
P-requirement (ppm)
1
14.2-13.4
4.6-10
2
13.4-12.5
10-15
3
12.5-11.7
15-20
4
11.7-10.9
20-25
5
10.9-9.0
25-36.7
4. Conclusions and Recommendations
4.1. Conclusions
The study was conducted in Teff potential kebeles of Debre Libanos district with the objective of phosphorus requirement mapping for Teff crop. The total soil samples collected for the Teff potential areas were 95, Pc was 15ppm and Pf was 6.1. Based on these values, phosphorus requirement was calculated by subtracting Po from Pc and the output of the result ranges from 4.6 to 36.7ppm for the Teff potential kebeles in the study area. Based on the phosphorus requirement map, the dark blue colored areas require high (25-36.7) amount of P followed by deep green colored areas (20-25) and the dark red colored areas indicate low amount phosphorus requirement of P for Teff growing areas in the study area. Moreover, the map of phosphorus requirement was predicted for the whole unknown locations.
4.2. Recommendations
Phosphorus fertilizer rate for Teff crop is very efficient by using either the map or the mean rate (21.6ppm) which is more appropriate than blanket phosphorus fertilizer application rate. On the other hand, it was recommended that, any phosphorus fertilizer user might consider the minimum, maximum or average value obtained according to their specific farm land based on recommended rate due to the dynamic properties of soils or using the output at the end of validation for the study area.
Abbreviations
GIS
Geographical Information Systems
FAO
Food and Agriculture Organization
ARDO
Agriculture and Rural Development of Oromia
EthioSIS
Ethiopia Soil Information System
ppm
Parts Per Million
pH
Power of Hydrogen
Conflicts of Interest
The author declares no conflicts of interest.
References
[1]
Taliman N.A., Dong Q., Echigo K., Raboy V. and Saneoka H., 2019. Effect of phosphorus fertilization on the growth, photosynthesis, nitrogen fixation, mineral accumulation, seed yield, and seed quality of a soybean low-phytate line. Plants, 8:11.
[2]
Lambers H., 2022. Phosphorus Acquisition and Utilization in Plants. Annual Review Plant Biology; 73:17-42.
Razaq M., Zhang P. and Shen H-l, S. 2017. Influence of nitrogen and phosphorus on the growth and root morphology of Acer mono. 12: 1-13.
[4]
Hasan M. M., Silva J. A. T and Li X. 2016. Regulation of phosphorus uptake and utilization: transitioning from current knowledge to practical strategies.
[5]
Lynch, J.P. and Brown, K.M., 2008. Root strategies for phosphorus acquisition. In the Eco-physiology of plant-phosphorus interactions. Springer Netherlands, 83-116.
[6]
Veronica N., Subrahmanyam D., Vishnu Kiran T., Yugandhar P., Bhadana V.P. and Padma, V. et al., 2017. Influence of low phosphorus concentration on leaf photosynthetic characteristics and antioxidant response of rice genotypes. Photosynthetica, 55: 285-293.
[7]
Gidane T. 2016. Verification and demonstration of soil test crop response based based phosphorus fertilizer recommendation rate on yield of teff in vertisol of Northern Ethiopia.
[8]
Girma C.. 2016. Soil test phosphorous calibration for potato production on Nitisols of central highlands Ethiopia. Ethiopian Journal of Science and Sustainable Development, 120-137.
[9]
EthioSIS (Ethiopia Soil Information System) 2014. Soil fertility status and fertilizer recommendation atlas for Tigray regional state, Ethiopia.
[10]
Brady, C. N., and Weil, R. R. 2014. The nature and properties of soils, USA, 401-442.
[11]
Su T., Xu Q., Zhang F. C., Chen Y., Li L. Q., and Wu W. H. et al. 2015. Modulates phosphate homeostasis through regulating phosphate translocation and acquisition in Arabidopsis. Plant Physiology. 167: 1579-1591.
[12]
Food and Agriculture Organization (FAO) 2006. Guidelines for soil description. 4th Edition, Rome.
[13]
Agriculture and Rural Development of Oromia (ARDO) 2005. Socio-economic profile of North Shewa zone.
[14]
Olsen, S. R., Cole C. V., Watanabe F. S. and Dean L. A. 1954. Estimation of available phosphorus in soils by extraction with sodium carbonate. USDA Circular, 1-19.
[15]
Yesuf A. et al. 2005. Phosphorus Critical Level and Optimum Nitrogen Rate Determination on Teff for Sustainable Soil Fertility Management and Economical Teff Production.
Lemma, A., Donis, A. (2025). Phosphorus Requirement Mapping for Teff at Debre Libanos District, North Shewa Zone, Oromia. Science Development, 6(3), 170-175. https://doi.org/10.11648/j.scidev.20250603.24
Lemma A, Donis A. Phosphorus Requirement Mapping for Teff at Debre Libanos District, North Shewa Zone, Oromia. Sci Dev. 2025;6(3):170-175. doi: 10.11648/j.scidev.20250603.24
@article{10.11648/j.scidev.20250603.24,
  author = {Ajema Lemma and Abera Donis},
  title = {Phosphorus Requirement Mapping for Teff at Debre Libanos District, North Shewa Zone, Oromia
},
  journal = {Science Development},
  volume = {6},
  number = {3},
  pages = {170-175},
  doi = {10.11648/j.scidev.20250603.24},
  url = {https://doi.org/10.11648/j.scidev.20250603.24},
  eprint = {https://article.sciencepublishinggroup.com/pdf/10.11648.j.scidev.20250603.24},
  abstract = {Phosphorus is an important plant nutrient affecting the growth and production of crop in the study area. Most crops require significant quantities of P during the early stages of growth and phosphorus requirements for optimum yields vary with different crop types. Fertilizer requirement mapping is related to the system of determining fertilizer required by specific crop production type for specific area on the basis of soil sample testing results. In order to make efficient fertilizer application for Teff at Debre Libanos district, the study was conducted to map phosphorus requirement for Teff crop. Starting from soil sample collection, laboratory analysis and interpretation and mapping standard methods were used. The total soil samples collected for Teff potential kebeles were 95 and phosphorus requirement mapping was done based on collected and analyzed soil samples. Based on the laboratory result, phosphorus requirement was calculated by subtracting initial soil phosphorus from phosphorus critical for Teff crop at the study area. Based on the laboratory results and spatial analysis done to map p-requirement, Teff potential kebeles in the study area require high (25 to 36.7ppm) at P-value ranged between 10.9-9.0 (medium) and low (4.6-10) at P-value ranged between 14.2-13.4 (high) phosphorus fertilizer. Accordingly, phosphorus fertilizer application rate for Teff crop might be very efficient by using the map, otherwise using the mean rate (21.6ppm) suitable than blanket phosphorus fertilizer application.},
 year = {2025}
}
TY  - JOUR
T1  - Phosphorus Requirement Mapping for Teff at Debre Libanos District, North Shewa Zone, Oromia

AU  - Ajema Lemma
AU  - Abera Donis
Y1  - 2025/08/05
PY  - 2025
N1  - https://doi.org/10.11648/j.scidev.20250603.24
DO  - 10.11648/j.scidev.20250603.24
T2  - Science Development
JF  - Science Development
JO  - Science Development
SP  - 170
EP  - 175
PB  - Science Publishing Group
SN  - 2994-7154
UR  - https://doi.org/10.11648/j.scidev.20250603.24
AB  - Phosphorus is an important plant nutrient affecting the growth and production of crop in the study area. Most crops require significant quantities of P during the early stages of growth and phosphorus requirements for optimum yields vary with different crop types. Fertilizer requirement mapping is related to the system of determining fertilizer required by specific crop production type for specific area on the basis of soil sample testing results. In order to make efficient fertilizer application for Teff at Debre Libanos district, the study was conducted to map phosphorus requirement for Teff crop. Starting from soil sample collection, laboratory analysis and interpretation and mapping standard methods were used. The total soil samples collected for Teff potential kebeles were 95 and phosphorus requirement mapping was done based on collected and analyzed soil samples. Based on the laboratory result, phosphorus requirement was calculated by subtracting initial soil phosphorus from phosphorus critical for Teff crop at the study area. Based on the laboratory results and spatial analysis done to map p-requirement, Teff potential kebeles in the study area require high (25 to 36.7ppm) at P-value ranged between 10.9-9.0 (medium) and low (4.6-10) at P-value ranged between 14.2-13.4 (high) phosphorus fertilizer. Accordingly, phosphorus fertilizer application rate for Teff crop might be very efficient by using the map, otherwise using the mean rate (21.6ppm) suitable than blanket phosphorus fertilizer application.
VL  - 6
IS  - 3
ER  -