1. Introduction
1.1. Background and Justification
Degradation of natural resource are sever and the demands of the needs are increasing at global scale. They are the burden issues in every country, particularly in developing countries such as Ethiopia. How to make a balance and survive on this planet? Because on the other hand population growth are increasing in an exponential rate at global scale. For instance land degradation is increasing for the last 60 years
| [31] | Pierre B., 2008. A global land degradation assessment and mapping method. A standard guideline proposal, an essential assessment of the current state o land degradation, Available online at Website by Olivier Piau (Agropolis Productions) - Webmaster: Laurence Monin (Agropolis International). pp. 1-20. |
[31],
while soil is already degraded and the land only left. The past study done by
| [31] | Pierre B., 2008. A global land degradation assessment and mapping method. A standard guideline proposal, an essential assessment of the current state o land degradation, Available online at Website by Olivier Piau (Agropolis Productions) - Webmaster: Laurence Monin (Agropolis International). pp. 1-20. |
[31],
had reported that, and assessed that at global scale; this degraded land host about 75% of the world population and out of four people three where live in agriculture. So restoration of degraded land into previous functions and service are 100 fold it is costly as compare to preventions because of no ways of Universal standard procedures to assess, understand and achieved what they will be expect from it.
Soil is a vital natural resource that the survival and sustainable of all life are depend on this crucial natural resource. The development of societies’ and their basic livelihoods are depending on soil resource
| [9] | Brady Nyle C. and Wevil Ray R., 1999. The nature and properties of soils (12th Ed.). Library of congress, catalog in publication data, United States of America. |
[9]
. Soil resource is considered as a renewable natural resource when properly managed and conserved otherwise it is a finite natural resource, because it can be restored back on human timescale. when lost by erosion it can be recover rapidly if use the better soil and water conservation measures and management practices and the fertility of a soil can be restored within a few years; so that soil is a renewable natural resource
| [41] | WRI, 2013. The Economics and Finance of Restoring Land. Executive summary roots of prosperity, Barriers to Investment in Restoration, pp. 1-8. |
[41]
.
Soil is the source of prosperity and after this 21
1st century human-being and soil resource cannot live by isolating themselves alone
| [15] | FAO and ITPS, 2015. Status of the World’s Soil Resources (SWSR) Main Report. Food and Agriculture Organization of the United Nations and Intergovernmental Technical Panel on Soils, Rome, Italy. |
| [9] | Brady Nyle C. and Wevil Ray R., 1999. The nature and properties of soils (12th Ed.). Library of congress, catalog in publication data, United States of America. |
[15, 9]
. Satisfaction of ever increasing population and their needs of interest of the demand for agricultural production would accommodated by implementing an intensive agricultural cultivation rather than implementing an extensive agricultural practices of cultivation to survive and satisfy
| [38] | Wolka K. etal. 2011. Effects of level soil bunds and graded and level stone bunds on soil properties and its implications for crop production: the case of Bokole watershed, Dawuro zone, Southern Ethiopia. Agricultural science, vol. 2, no. 3, pp. 360-361. |
[38],
the current demands; because in the coming of 2050 the world total population will be reach about nine point one billion (9.1billoin), however the current cultivated land will be feed and satisfy these number of population in the future
| [6] | Asnake B. and Elias E., 2017. Challenges and extents of soil and water conservation measures in Guba-Lafto Woreda of North Wollo, Ethiopia. E3 Journal of Agricultural Research and Development Vol. 7(2), pp 0104-0110. |
[6]
. Another factor is, based on this study the world population growth rate per decade will be one billion (1bllion). On the other hand; soil fertility is hampered by soil degradation due to different erosion agents such as water and wind erosion
| [8] | Blanco H and Lal R. Principles of Soil Conservation and Management. Kansas State University Western Agricultural Research Center-Hays Avenue Hays USA pp.1-40 |
[8]
. In addition to that, these authors had supposed that, land degradation become threat to agricultural productivity in sub-Saharan Africa and it is accelerating the
declining of soil fertilities and crop yields decline and per capita of food production in Africa.Soil erosion is caused the major problems of degradation of land, soil, water and agricultural production and productivity in Ethiopia including the current drought
| [7] | Ayala G. etal, 2018. Assessment of status of irrigation practice and utilization in Western Harareghe Zone, Oromia Region, Ethiopia. Oromia Agricultural Research Institute, Mechara Agricultural Research Center, Mechara, Ethiopia, pp. 1-2. |
[7]
. Those authors had said that, the Ethiopian population increases by the rate of 3 percent per year which is another issue of the country that is affects the livelihoods of the communities that are depend on agriculture for the whole of its economy. Hence, cannot be adopt alternative source of income generation like others African countries easily.
Soil erosion issue is hindered the natural resources development and in consequences it is deteriorates soil resource by provision of on-site and off-site effects. On site effects are occurs in the agricultural land resource and include: decline of topsoil, and exposure of subsoil, loss of organic matter and humus, loss of soil moisture, compaction of soil, disaggregation of soil particles, decline of crop yields and soil structure. Off-site effects are occurring out of agricultural lands and include such as: sedimentation, water pollutions, land slide, mudding, and flooding
| [8] | Blanco H and Lal R. Principles of Soil Conservation and Management. Kansas State University Western Agricultural Research Center-Hays Avenue Hays USA pp.1-40 |
[8]
.
Agricultural land is not only an indispensable natural resource of the welfare of the society’s that is dependent on it, but also the backbone of the Ethiopian economy
| [6] | Asnake B. and Elias E., 2017. Challenges and extents of soil and water conservation measures in Guba-Lafto Woreda of North Wollo, Ethiopia. E3 Journal of Agricultural Research and Development Vol. 7(2), pp 0104-0110. |
| [38] | Wolka K. etal. 2011. Effects of level soil bunds and graded and level stone bunds on soil properties and its implications for crop production: the case of Bokole watershed, Dawuro zone, Southern Ethiopia. Agricultural science, vol. 2, no. 3, pp. 360-361. |
[6, 38]
that had been reported. On the other hand according to these studies,
land degradation in the form of soil erosion, soil fertility depletion, deforestation of vegetation
covers through clearance of vegetation covers for cultivation of food crops and overgrazing are the basic problems that are facing farmers in the Ethiopian highlands.
Erosion is the evil hazards of land and soil degradation. Based on the past study done; it was estimated that about 42 t/ha/year or 4mm depth of soil was losses per annual in Ethiopian crop lands of the highlands. In despite of that, on individual field the rate of soil losses was estimated about 300t/ha/year which exceeds the rate of soil formation
| [4] | Amsalu A., etal. n. d. Determinants of physical soil and water conservation practices in Ethiopia’s semi-arid tropics. The case of Bati District. Social and basic sciences research review, vol. 2, Issue 12, p526. |
[4]
. The annual decline of land productivity in the highlands of Ethiopia was recorded about 2.2% which occurred by erosion. At national-level the study was carried out in Ethiopia in the mid-of 1980s, and it was estimated that soil erosion was removed about 20,000 to 30,000 ha of croplands annually
| [38] | Wolka K. etal. 2011. Effects of level soil bunds and graded and level stone bunds on soil properties and its implications for crop production: the case of Bokole watershed, Dawuro zone, Southern Ethiopia. Agricultural science, vol. 2, no. 3, pp. 360-361. |
[38]
.
The Ethiopian highlands were affected via with sedimentation, soil erosion, and deforestation, which resulted in decline of soil fertility and soil properties, depletion of topsoil and water resources, loss of biodiversity, and decline of production and productivity of agricultural land and pasture lands. Whatever the degree of the issues had occurred and damaged, the Ethiopian government during the socialist regime were enforced the local people in massive since, 1973/1974
| [4] | Amsalu A., etal. n. d. Determinants of physical soil and water conservation practices in Ethiopia’s semi-arid tropics. The case of Bati District. Social and basic sciences research review, vol. 2, Issue 12, p526. |
[4]
to prevent chronic food problems that were occurred in the country by the provision of incentive as a food-for-work to control erosion and sedimentation. The regime was gave the greatest focus and attention at that time for the adoption and practices of soil and water conservation programmes and the programmes were did at that time were more focused on structural SWC measures and tree planting activities or afforestation and re-afforestation.
Soil in the Harareghe highlands are varies at a short distances
| [22] | Kassa D. D., 2013. Characterization of Soils of Habro Area, West Harareghe Zone of Oromia Region, Eastern Ethiopia. MSc thesis, Haramaya University, Ethiopia. pp. 1-3. |
| [23] | Kebrit K., 2014. Characterization of Agricultural Soils in CASCAPE Intervention Woredas in Eastern Region. Final report, Haramaya University p1. |
[22, 23]
. Soil variability over short distance is a common once in the highlands of Harareghe regions (both west and east Harareghe regions) because of variations in climate conditions, topography and vegetation diversity. In addition to that, this study had reported that about 13 soil types were observed in 234 ha of catchment area alone in the Harareghe highlands
| [20] | Ibro Mussa Abdula, 2003. The contribution of Jello Urgi natural forest in providing non-timber forest products to local community. BSc thesis (Unpublished), the case of Urgi Jeneta PA in Doba Woreda west Harareghe zone Oromia National Regional State Ethiopia, WondoGenet College of Forestry, Debube University, Ethiopia. p6. |
[20]
.
Implementation of the same soil and water conservation practices without testing physico-chemical soil properties without exclude the biological soil properties such as soil microorganisms and soil biodiversity in the west Harareghe highlands were the common and burden issues currently to prevent and control soil erosion and sedimentation
| [21] | Kalra P. Y., 1998. Handbook of Methods for Plant Analysis. Soil and Plant Analysis Copyright 1998 by Taylor & Francis Group, LLC, Council, Inc. ISBN 1-57444-124-8 CRC Press Boca Raton Boston London New York Washington, D. C., pp. 75-82. |
[21]
. But, Harareghe highland topography has rugged and mountainous by nature which is very steep slope. The erosion originated on it has damaged the hillside fertile agricultural land and waterbodies by sedimentation, fragmented stones and alluvial soil depositions. These issues always requires or calls for argent SWC measures particularly in the upland stream watersheds by carry out such study research proposed and find the best alternative solutions based on the end results of output
| [34] | UNDP, 2002. Ethiopia: assessment of field trip to east and west Harareghe zone. Ethiopian weather and climate zone, national safaris Ethiopia highlights where they are and how to visit them. Available on line HYPERLINK " https://www.nationalparks.com" https://www.nationalparks.com |
[34]
.
1.2. Statement of the Problem
Soil erosion by water, wind, gravitational forces and mechanical such as on cultivation land are severally degraded soil, land and water resources and their cumulative impacts are resulted in low agricultural yield and environmental pollution which increases climate change, greenhouse gas effects and global warming
| [8] | Blanco H and Lal R. Principles of Soil Conservation and Management. Kansas State University Western Agricultural Research Center-Hays Avenue Hays USA pp.1-40 |
[8]
. Moreover, the author had revealed that structural SWC measures constructed to control runoff, soil losses, nutrient leaching and enhance recharge of ground water, ground water table and improve agricultural production that had not change the condition particularly in developing counties; because, of population pressures and the needs of the current demands that are caused imbalance in the developing countries are continues. So that, site matching with agro-climatic conditions, soil types, and topography are the major problems for interventions of SWC technologies.
Rugged and mountainous characteristics of the Harareghe highlands with large plains of the lowland areas are the nature that are accelerated soil erosion, sedimentation and flood of anthropogenic activities. Erratic and scarce rainfall patterns of Harareghe highlands, middle lands and lowlands were resulted to poor crop yields. The middle lands and highlands of the altitude belt are vastly covered with cultivated agricultural lands due to the area has densely populated and then, the scarcity of landholding size the common problem that leads to deep erosion
| [35] | UN-EUE, 2003. Harareghe Food Security hampered by long-term drought conditions and economic constraints. Assessment mission, François Pignut, Field Officer, UN-Emergencies Unit for Ethiopia, pp. 1-14. |
[35]
.
Even if Ethiopia has the richest country in biodiversity till not manipulated and utilized in a sustainable development of the watershed natural resources based; particularly forest resources and their overexploitation is everywhere
| [16] | FSIV-IIED, 2002. Do forests protect watersheds? A short summary of current thinking on the links between land use, hydrological functions of watersheds and local livelihoods in Vietnam, Research Centre for Forest Ecology and Environment of the Forest Science Institute of Vietnam (FSIV) and the Forestry and Land Use Programme of the International Institute for Environment and Development (IIED), pp1-13. |
[16]
. Deforestation of a forest covers both plantation and natural forests are a common phenomenon in the world without excluded the African continents for instance, Ethiopian deforestation is an exemplary once for African and the whole world constituents
| [17] | Hamilton S. L., 2005 with contribution of Dudley N. etal 2005. Forests and water. A thematic study prepared in the framework of the global forest resources assessment 2005, FAO Forestry Paper 155, Oulanka national park Finland. |
[17]
. A common factors influencing forest deforestation are population pressure, socioeconomic constrains and extensive farming practices in the country
| [25] | Meresa M. etal., 2019.The Contribution of Ethiopian Wetland Resources to Economic Growth and Biodiversity Conservation of the Country. Science Research, vol. 7, no.6
https://doi.org/10.11648/j.sr.20190706.13
ISSN: 2329-0935 (Print); ISSN: 2329-0927 (Online) Dilla University Ethiopia, pp. 85-92. |
[25]
. On the other hand, Ethiopian rapid population growth rate relies on the fragile and marginal natural resources for their basic livelihood of security. Rainfall patterns currently affects the farming systems and fluctuates in crop production and sometimes happened the food crises due to high prices in the country
| [5] | Anebo A., 2018. The National Regional Government Of Oromia, Oromia Environment, Forest And Climate Change, Authority. Oromia National Regional State Forested Landscape Program OFLP 2017/2018 Report of DAs Training on SafeGuard Management and Implementation, To Central Shoa and Eastern Oromia Lead Facilitator office, chiro cluster REDD+ coordination office, chiro, west Harareghe zone, Ethiopia, p1. |
| [25] | Meresa M. etal., 2019.The Contribution of Ethiopian Wetland Resources to Economic Growth and Biodiversity Conservation of the Country. Science Research, vol. 7, no.6
https://doi.org/10.11648/j.sr.20190706.13
ISSN: 2329-0935 (Print); ISSN: 2329-0927 (Online) Dilla University Ethiopia, pp. 85-92. |
[5, 25]
.
Several past studies were leaved the vast gaps when they were studied the biological, chemical and physical soil properties for instance the studies had not been seen SWC measures with site matching of topography, agro-climatic conditions, soil types, and cultivation systems either, manual or by machine and its improper construction . One of the gap that was leaved by past study was improper and mismatching of the structural SWC measures and tree planting activities. SWC such as stone bunds and soil bunds were built to control runoff, soil loss, and nutrient depletion and yield decline, But, they were not implemented properly and by matching with soil types, agro-climatic conditions and topography. As an exemplary, a few of them were include: graded and level stone bunds that were constructed to stored soil losses and sediments about 58t/ha/year in the basin and increase 53% of crop yield in the lower part of the plot
| [29] | Nyssen J. etal., 2007. Interdisciplinary on-site evaluation of graded and level stone bunds to control soil erosion on cropland in Northern Ethiopia. Soil tillage and research, vol. 94, Heverlee, Belgium, pp. 151-161. |
[29]
. The study done in northern Ethiopia Tigray region had indicated that the yield increase about 0.58 to 0.65 /ha. The Study done at southern Ethiopia Bokole watershed had showed that level soil bunds and graded stone bunds were improved about 79.1% and 87.1% of crops yield on the upper and lower stream watersheds, respectively
| [39] | Wolka K. etal, 2013. Farmers’ perception of the effects of soil and water conservation structures on crop production: The case of Bokole watershed, Southern Ethiopia. African Journal of Water Conservation and Sustainability, Vol. 1, no. 5 Hawassa Ethiopia. pp. 071-080. |
[39]
. One of the most important statistical study is starting the statement of the problems that are to be showing the gaps to be exists clearly and to be correct any mistakes did with the past studies
| [19] | Hinkelmann K. and Kempthorne O., 2007. Design and Analysis of Experiments (second Ed.). Introduction to Experimental Design vol. 1, Wiley-Inter-science A John Wiley & Sons, Inc., Publication, WILEY, Hoboken, New Jersey, US America, pp. 29-60. |
[19]
. Therefore, this study will be completely different from several studies did in the past in the west Harareghe zone, Oromia region and the entire Ethiopian regions; because of it looks and compares these factors the effects of graded stone bunds treated land uses or none conserved land uses and homestead land uses on chemical, physical and biological properties of soils. Moreover, it will be study site matching and site un-matching of graded stone bunds, improper construction of GSTBs and transferring of homestead land use technologies to other areas of land uses based on the outcomes of the study results. The other factors under this study will be include: studying of the arrangement, grown species types and yields obtain from homestead treated, graded stone bund treated and control land uses by owner of the land uses; field testing of soil texture, soil bulk density by the method of buoyance force and field parameters measurements for graded stone bunds such as ties interval, height, upper and bottom width, space between successive bunds, basin depth and width both the upper and bottom. Also it will be work on the known and understand of species diversity found in the homestead farmland uses by conducting simple species inventory or identification by observation and recording their names.
Therefore, this study will be proposed to observe the problems of site matching and improper construction of soil and water conservation structural practices and compare with farmstead land uses, treated land uses with graded stone bund and none-treated land uses and to transfer farmstead technologies to other farm land uses based on the finding of the study, to give the training to local people or farmers and DA, expertise and to create awareness to local people and professionals about the maintenance of GSTBs and importance of homestead land use practices. It will serve as a welcome for the next generation who will want to study on similar study. Thus, it will be an open study research but not the closed study research.
Moreover, the study will be guide and show the direction how it will proposed how to see the gaps of the past studies, what and why will be study for the future for those who are use this study proposal.
1.3. Objectives of the Study
1.3.1. General Objective of the Study
The general objective of this research study will be observing the effects of graded stone bunds on physical, biological and chemical properties of soil in comparison to homestead and control land uses of Gemachis/Chiro, Beddessa and Doba/Tullo Districts of the community watersheds, West Harareghe Zone, Oromia Regional National State, Ethiopia.
1.3.2. Specific Objectives
1) To examine the trends and variations of graded stone bunds on physical, chemical and biological soil properties in comparison to control and homestead land uses.
2) To be work on transferring the homestead land use technologies to other land uses based on the final results.
3) To investigate variations of soil texture under GSTBs, HSFLs and CFLs by use field testing methods.
4) To evaluate the parameters by measures their design and layout of the GSTBs (basin space, height, width, tie intervals, space between success bunds).
5) To identify the species grow by types by observation and record their names or by use simple species inventory method , example by use direct counting of species
1.4. Hypotheses of the study
A statistical hypothesis is a statement that is describes about the measurable parameters or model of parameters of probability distribution. It reflects about the situation of the problem in conjunction or conjecture. The general procedures in hypotheses testing is to specify a value of the probability of type I- error α, when Ho it is false often called the significance level of the test, and then, the design of the test procedures; so that the probability of type -I1 error β has a small value
| [27] | Montgomery D. C., 2001. Montgomery C. D., 2001. Design and Analysis of Experiments (5th Edu.). Arizona State University, JOHN WILEY & SONS, INC., New York Chichester Weinheim Brisbane Toronto Singapore, Arizona, State University, pp. 511-556. |
[27]
. The philosophy of this study will be proving the stated objectives, questionnaires and the hypotheses at the significance level of α 0.01 or 99% confidence intervals and called the specified value of the probability of type I -error-α when Ho is true but it is rejected. Statistical study of alternative hypothesis is a two sided hypothesis; the reason is that it is true and accepted if and only if µo>µ or µo<µ. To be testing the hypotheses either rejected or accepted it requires the statistical procedures of random sampling, determining an appropriate test statistics and then finally rejecting the null hypothesis, Ho: µo=µ
| [27] | Montgomery D. C., 2001. Montgomery C. D., 2001. Design and Analysis of Experiments (5th Edu.). Arizona State University, JOHN WILEY & SONS, INC., New York Chichester Weinheim Brisbane Toronto Singapore, Arizona, State University, pp. 511-556. |
[27]
.
There are two kinds of errors may be occurred when testing the proposed hypotheses by the researcher. If the null hypothesis is rejected when it is true, then, a type I error has occurred whereas if the null hypothesis is not rejected when it is false, a type I1 error has been made. The probabilities of these two errors are show as below:
a = P (type I error) = P (reject Ho I Ho is true) and
P = P (type I1 error) = P (fai1 to reject
Ho I
Ho is false).
Sometimes it is more convenient to work with the power of the test, where Power = 1 - p = P (reject
Ho 1
Ho is false)
| [18] | Hiller A., 2007. Working with ArcGIS 9.3 manual. University of Pennsylvania School of Design Cartographic Modeling Lab, from the selected work of hiller Army, university of Pennsylvanian available online at
http://works.bepress.com/amy_hillier/17 |
| [19] | Hinkelmann K. and Kempthorne O., 2007. Design and Analysis of Experiments (second Ed.). Introduction to Experimental Design vol. 1, Wiley-Inter-science A John Wiley & Sons, Inc., Publication, WILEY, Hoboken, New Jersey, US America, pp. 29-60. |
[18, 19]
. The general procedures testing the hypothesis is to specify a value of the probability of type I error
a, often called the significance level of the test, and then design the test procedure so that the probability of type I1 error β is small value
| [27] | Montgomery D. C., 2001. Montgomery C. D., 2001. Design and Analysis of Experiments (5th Edu.). Arizona State University, JOHN WILEY & SONS, INC., New York Chichester Weinheim Brisbane Toronto Singapore, Arizona, State University, pp. 511-556. |
| [19] | Hinkelmann K. and Kempthorne O., 2007. Design and Analysis of Experiments (second Ed.). Introduction to Experimental Design vol. 1, Wiley-Inter-science A John Wiley & Sons, Inc., Publication, WILEY, Hoboken, New Jersey, US America, pp. 29-60. |
[27, 19]
. Statement of the hypotheses for the experimental design as below: There are no variations between the factors that will be studying about the effects of GSTBs treated lad uses, control land uses and homestead land uses on physical, chemical, and biological soil properties and yields. Thus, Ho: µo=µ when Ho is true and type I error α has occurred. There are a variations between the factors that will be studying about the effects of GSTBs treated lad uses, control land uses and homestead land uses on physical, chemical, and biological soil properties and yields. Ha: µo ≠ µ if at least one mean is different when Ho is false and type II error β has occurred.
1.5. Scope of the Study
The scope of this study will be covers: biological, physical and chemical soil properties for the land uses treated with GSTBs, farmstead land uses and control land uses; because of a comparison study; Identification of species in homestead grown and their arrangement in spatial and temporal variations including their inventory. Field soil texture testing. Determination of parameters measurement for graded stone bund. Determination of soil BD and MC. Sample collections, preparation of soil for laboratory analysis and writing up the draft and final report. It will be measure for graded stone bund design and layout and measurement of yield and collection of a secondary data.
1.6. Importance of the Study
It will be see the gaps existed and not yet studied by several researchers in the past; specifically deal on soil properties, site matching and past mistakes during construction of the graded stone bunds either appropriate or inappropriate for the selected watersheds from Chiro and Doba, Gemichise, Beddessa and Tullo middle land altitude with soil types, topography and agro-climatic conditions. It will show the limitation of control lands, treated lands and farmstead land uses.
1.7. Beneficiary Groups
It will be assures teaching-learning processes in the university particularly in OBU. Both governmental and non-governmental organizational employers who are working and learning in this field of specialization they will be befits. It will be provide great benefits for agricultural extensions and farmers to solve the problems of soil nutrients and adoption of technologies. The farmers who will be taking the responsibilities of guarding and marinating the structures are largely benefits from their services in the first hand. It will be provides an information about soil inputs and management practices (i.e. excess and limited soil properties including the soil fertility). Moreover it will be teaching the professionals on working in the OBU both in cooperative and collaborative working al-together and learning from each other to update themselves in their professionals.
2. Materials and Methods
2.1. Description of the Study Area
West Harareghe zone boundary of the lie of the land is geographically located between
N latitude and
E longitude from the equator
| [33] | SMWHZ, 2017. History climate baseline statistics for east and west Harareghe Ethiopia. Available on:
HYPERLINK " http://doi.org/10.1016/j.epol.2016" http://doi.org/10.1016/j.epol.2016 |
[33]
(
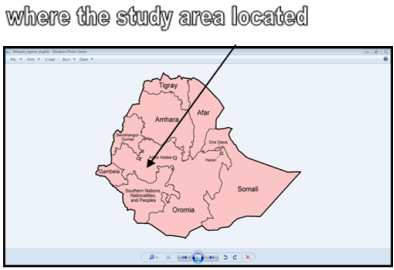
Figures 1 and 2). The land of study areas although lies within the zone of demarcation from the equator
Figure 2.
Figure 1. Shows the Study Zone, District(s) and Zone.
Figure 2. Shows the Study Zone and Watershed(s).
Geographical lie of the land of Chiro administration demarcation is lie between 9°00’ to 9°15’ N latitude and 40°45’ to 41°00
’’ E longitude from the equator. Geographical lie of the land of Doba administration demarcation between 9°15’ to 9°30’ N latitude and 41°00’ to 41°15’ E longitude
| [11] | EMA, 1999. Published by EMA @ Ethiopian Government. Field survey data by EMA air photograph by SWED SURVEY December 1996, field completion by EMA august 1998, Addis Ababa, Ethiopia. |
[11]
.
The study done by
| [34] | UNDP, 2002. Ethiopia: assessment of field trip to east and west Harareghe zone. Ethiopian weather and climate zone, national safaris Ethiopia highlights where they are and how to visit them. Available on line HYPERLINK " https://www.nationalparks.com" https://www.nationalparks.com |
[34]
had revealed that altitude of Harareghe zone (east and west Harareghe zones) range from the lowest 1000 m to the highest 3400m a. s. l. (Gara Muleta).
2.1.1. Climate of the Study Area
The mean maximum temperature of the Ethiopia is
which covers from April to September and
from October to March are recorded in the Qafar Depression Valley north-east Ethiopia. The mean maximum temperature in the hot area of the country north-western lowlands is
in June and the western and south-eastern lowlands have experiences the mean maximum temperature
in April. The lowest mean minimum temperature is
especially at night the lower temperature is recorded in highlands while in valley bottoms occasionally the ground frost is recorded. The annual average rainfall in Ethiopia is grouped into three: 1200 to 1600mm in lowlands, 1600 to 2600mm in midlands and > 3000mm in the highlands
| [34] | UNDP, 2002. Ethiopia: assessment of field trip to east and west Harareghe zone. Ethiopian weather and climate zone, national safaris Ethiopia highlights where they are and how to visit them. Available on line HYPERLINK " https://www.nationalparks.com" https://www.nationalparks.com |
[34]
.
The past study conducted by
| [34] | UNDP, 2002. Ethiopia: assessment of field trip to east and west Harareghe zone. Ethiopian weather and climate zone, national safaris Ethiopia highlights where they are and how to visit them. Available on line HYPERLINK " https://www.nationalparks.com" https://www.nationalparks.com |
[34]
had reported that, Ethiopia has five agro-climatic zones which is defined by altitude and temperature. According to this study; West Harareghe zone laid under the warm to cool semi-arid zone of the country which covers the temperate of highlands of the altitude ranges from 1500m to 2500m a, s. l, The annual average temperature vary from
to
, while the annual average rainfall vary from 1200mm to 2400mm; this is exclude the long drought seasons and present erratic climate change in the west Harareghe zone currently occurred. In addition to this
| [34] | UNDP, 2002. Ethiopia: assessment of field trip to east and west Harareghe zone. Ethiopian weather and climate zone, national safaris Ethiopia highlights where they are and how to visit them. Available on line HYPERLINK " https://www.nationalparks.com" https://www.nationalparks.com |
[34]
, had been shown that, the annual average RF fall from <700mm in lowlands (Kolla or Gemojji) to 1200mm in Dega or Bedda and Weyna Dega or BeddaDare agro-climatic conditions. Based on this study the west Harareghe zone and the selected study districts are laid within this ranges of agro-climatic conditions, while the long term annual average rainfall is 550mm
| [1] | Adams, B. A. Ola and Okali, D. U.U., 2008. Impact of land use conflict on livelihood and range condition in the Awash valley of Ethiopia. In Lee C. schaaf T. (eds), the future of drylands springer, Dordrecht, pp457-469. |
[1]
.
In general, bimodal RF pattern is common in eastern, central and northern areas of the country. Depend on this discover west Harareghe zone is the welcome area of this bimodal RF pattern of Awash basin type of rainfall. The major RF receives from the Atlantic Oceans and some of it from Indian Oceans. The longest rainy seasons and the most important for agricultural work and crop growing covers from June to September which bring from Atlantic oceans whereas the shortest rainy seasons is the spring which covers from February to may; receives from Indian oceans. In total the economy of west Harareghe zone is depend on the second rainy seasons. The field trip study carried out by [34, 28], had reported that, the west Harareghe zone (including the east Harareghe zone) the agro-climatic conditions is divided into three categories: lowland (arid and semi-arid or Kolla) is range from 30-40%, midland (semi-humid or weyna Dega) is covers 35-45% whereas the highlands (cool and humid or Dega) is covers 15-20% and cold and moist (Wurech). Spring or belg crop production is limited to Dega and Weyna Dega areas only and the spring rainy seasons is used for land preparation and to grow long cycle meher crops such as maize and sorghum and maize and spring crops such as bean and maize in mixed and, barely; root crops like potato and vegetables.
Concerning rainfall pattern and distribution in Ethiopia the eastern and south-eastern plateau and the escarpment of the country is referred as “Region C” which obtains the rainfall in spring, summer and autumn. Rainfall occurred from February to November in highland areas whereas in low lying areas from March to November. During rainy seasons precipitation is more than ½ PET
| [28] | Negash, M., 2017. The needs for the meteorological information to plan agroforestry on steep slopes in Ethiopia. Land use planning department, ministry of agriculture, Addis Ababa, Ethiopia available on www.Worldagroforestryorg’units’html |
[28]
.
Agro-climatic classification of the watershed topographic map or altitude belt of classification of the west Harareghe zone’s altitude classified into three categories: 501-1500m a. s. l. is Kolla or Gamojji climate, 1501-2500m a. s. l. is WeynaDega or BeddaDaree climate and 2501-4500m a. s. l. is Dega or Bedda climate
| [37] | WFP, n. d. Topographic map of west Harareghe zone 1470373-E3941E267DCL256F200047FFB6 WFP-eth0400 windows photo view available on line: http://www.com.wfp |
[37]
.
The altitude of the Chiro District (AsebTefere District) it is ranges between the elevations of 398m to 2800m a. s. l.
| [11] | EMA, 1999. Published by EMA @ Ethiopian Government. Field survey data by EMA air photograph by SWED SURVEY December 1996, field completion by EMA august 1998, Addis Ababa, Ethiopia. |
[11]
. The Doba District altitude according to
| [11] | EMA, 1999. Published by EMA @ Ethiopian Government. Field survey data by EMA air photograph by SWED SURVEY December 1996, field completion by EMA august 1998, Addis Ababa, Ethiopia. |
[11]
had revealed that on topographic map; it is ranges between elevations of 204m to 2320m a. s. l.
Erratic rainfall pattern in the Harareghe highlands is currently a common issue due to the alarming change of climate of the zone with population pressures and extending of scarce land size to fulfill the household subsistence by deforestation on steepy slope of fragmented and patches of the remnant forests for agricultural cultivation and growing crops with perennial shrubs as a source of income generation
Catha/Katha edulis). For instance, since 2002/1984 maize crops were died in Meher season but sorghum crops were survived as a result of drought resistant crop
| [35] | UN-EUE, 2003. Harareghe Food Security hampered by long-term drought conditions and economic constraints. Assessment mission, François Pignut, Field Officer, UN-Emergencies Unit for Ethiopia, pp. 1-14. |
[35]
. But, for these 6 to 7 years 2007 while to know the pattern of rainfall is the reverse of the past.
GIS based soil erosion assessment for conservation planning study in west and east Harareghe zones had been shown that the mean annual rainfall is accounted to 1290.34mm. According to these authors study the maximum monthly rainfall is estimated about 600mm in wet season of the august in particular while the minimum monthly rainfall is approximately nil in dry seasons of January and February months. Moreover, these authors had showed that approximately about 90% of rain occurs during the second rainy seasons which are very important for crops growing than the first rainy seasons of the zones and it plays crucial role on the livelihoods of the local population
| [18] | Hiller A., 2007. Working with ArcGIS 9.3 manual. University of Pennsylvania School of Design Cartographic Modeling Lab, from the selected work of hiller Army, university of Pennsylvanian available online at
http://works.bepress.com/amy_hillier/17 |
[18]
. The maximum and minimum average temperatures of these two zones west and east Harareghe are 30.06°C and 4.44°C, respectively
| [15] | FAO and ITPS, 2015. Status of the World’s Soil Resources (SWSR) Main Report. Food and Agriculture Organization of the United Nations and Intergovernmental Technical Panel on Soils, Rome, Italy. |
[15]
.
2.1.2. Soil Types of the Study Area
Table 1. Area Coverage of Different Soil Types in Ethiopia.
Soil types | Area covers | Soil types | Area covers | Soil types | Area covers | Soil types | Area covers |
Lithic leptosols | 208,882.4 | Fibric histosols | 2776.2 | Humic alisols | 21,299.0 | Solonetz | 165.4 |
Humic nitisols | 134, 722.0 | Haplic lixisols | 1954.0 | Haplic solonchaks | 19,285.1 | Dystric nitisols | 134.2 |
Eutric vertisols | 115,207.5 | Calcic vertisols | 1905.1 | Vertic cambisols | 15,968.0 | Sodic solonchaks | 132.7 |
Eutric leptosols | 71,268.6 | Salic fluvisols | 1841.9 | Dystric leptosols | 13,446.4 | Fluvisols | 94.1 |
Chromic luvisols | 58, 748.6 | Luvic phaeozems | 1714.5 | Haplic alisols | 11,376.6 | Rhodic ferralsols | 72.4 |
Haplic calcisols | 53, 117.6 | Calcic chernozems | 1427.9 | Calcaric regosols | 8031.8 | Gelysols | 63.7 |
Petric calcisols | 51,510.5 | Calcaric cambisols | 1188.6 | Haplic nitisols | 6168.2 | Rhodic nitisols | 61.6 |
Eutric cambisols | 50,268.4 | Haplic arenosols | 878.5 | Calcaric fluvisols | 5306.3 | Haplic aerisols | 27.8 |
Haplic cypsisols | 46,305.2 | Vertic luvisols | 851.4 | Cambic arenosols | 5120.7 | Solonchaks | 14.7 |
Rendzic leptosols | 44,315.0 | Orthic solonochaks | 519.0 | Eutric regosols | 4733.6 | Calcisols | 8.6 |
Eutric fluvisols | 42,256.9 | Gleyic solonochaks | 393.3 | Vitric andosols | 3854.0 | Cambisols | 5.3 |
Petric cypsisols | 39,481.7 | Calcaric arenosols | 343.0 | Dystric vertisols | 3437.1 | Umbric leptosols | 4.1 |
Chromic cambisols | 38,710.5 | Leptosols | 192.6 | Mollic andosols | 3185.4 | Haplic xerosols | 3.2 |
Haplic luvisols | 28,224.5 | Luvic calcisols | 171.9 | Haplic phaeozems | 2997.3 | Ferric luvisols | 2.6 |
Dystric cambisols | 1.4 | Water bodies | 7643.8 | Dystric regosols | 2.2 | | |
Source:
| [12] | EMST, 2014. Ethiopian major soil types of photo viewer. The major soil types and area overages of different soil types in square kilometer in Ethiopia. |
[12].
The Major Ethiopian soil types and their areas coverage in square kilometer
Table 1 above
| [12] | EMST, 2014. Ethiopian major soil types of photo viewer. The major soil types and area overages of different soil types in square kilometer in Ethiopia. |
[12]
. The preceding study in Ethiopia done by
| [13] | FAO, 1995. Ethiopian food and agricultural organization of the United Nations. Soil and water resources, agriculture in Ethiopia. |
[13]
had revealed that, 19 major soil types are found which is grouped into three types. These are Lithosol cover 163, 185 (14.7%) km
2, Fuvisols cover 882, 61.5 km
2 (7.9%) and Luvisols cover 640, 63.5 km
2 (5.8%) areas. Hence, as this study had express soil types in Ethiopia; soil types in west Harareghe zone, study districts and watersheds are grouped under these three major groups of soil types.
The soil types of west Harareghe zone and the study Districts are found within the ranges of these 59 major types of Ethiopian soils classes.
2.1.3. Land Use/Land Cover
Land use is refers to manmade and the land occurred in nature. The first is aesthetic of the landscape features; designed and made by human being for instance land in urban areas and cultivation land are manmade and forest lands natural land, respectively, whereas land cover refers to land size and the unit expressed by ha, or acre in types or in variations. Ethiopian massive land has 1221480 km
2 (122148000ha) area; and the major land uses and land covers are 1115000 km
2 (111500000ha): 14.7% cultivation land, 56.9% grazing and browsing land, 11.7% forestland and 18.7% wasteland
| [13] | FAO, 1995. Ethiopian food and agricultural organization of the United Nations. Soil and water resources, agriculture in Ethiopia. |
| [28] | Negash, M., 2017. The needs for the meteorological information to plan agroforestry on steep slopes in Ethiopia. Land use planning department, ministry of agriculture, Addis Ababa, Ethiopia available on www.Worldagroforestryorg’units’html |
[13, 28]
. Landsat satellite images of 1972-1979 in Ethiopia had indicated that, land covers are encompasses 12 types: namely cultivated lands, urban and build-up, afro and sub-afro alpine vegetation, forestland, woodland, riparian land, bush land, shrub land, grassland, wetland, bare land and wasteland
| [28] | Negash, M., 2017. The needs for the meteorological information to plan agroforestry on steep slopes in Ethiopia. Land use planning department, ministry of agriculture, Addis Ababa, Ethiopia available on www.Worldagroforestryorg’units’html |
[28]
.
2.1.4. Vegetation Covers
In eastern Oromia national regional state of eastern Ethiopia particular west and east Harareghe zones of vegetation covers of natural forest were severely degraded during the Feudalism Regime. Degradation of vegetation covers was adversely affected in quality and quantity by deforestation for whatever purposes. However, during the Socialism Regime all the degraded areas of natural forests were reafforested with plantation forests by that government to alleviate the problems of food chronic since, 1973 to 1974s in Ethiopia with the help of food -for-work programmes in 1980s as special case even if the programmes far ahead, since 1970s. Since, 1980s the programmes was reformed itself and begun at watershed base.
Vast of the agricultural lands held by a few of Feudalisms Royal families who had considered themselves as a landlord as historical evidences were indicated and landless local people were encroached the steep slopes or hilly mountainous and then, begun to vacant the forest covers and grown food crops who had been disagreement with Feudalism who were held the land resources by monopolization and displaced the people and who had empowerment. These were the main reasons for today degradation of the land even though treated during Dreg Regime because of the Fuado Burglarize Pathogen of the Feudalism impacts on forest covers. Moreover, Ethio-Italy sawmill installed at Zegita Tullo Woreda of west Harareghe zone of Oromia regional national state of Ethiopia during the feudalism regime was another major factor of the Ethiopian forest degradation and soil erosion and sedimentation down hillside of fertile agricultural lands and water bodies were affected in consequence.
2.1.5. Farming Systems
In Harareghe region both the eastern and western farmers practice the same practices. The common farming system in eastern Ethiopia are mixed farming system which are refers to cultivation of crops for staple food and cash crops for market and animal rearing in special husbandry; they feed using cut and carry system during the rainy seasons of the whole seasons and in partial during dry seasons. This indigenous type of animal feeding is created and adapted by local people from the hardship faced them as a result of lack of communal and private grazing lands, land holding size is smaller per household. The average landholding size per HH is 0.5ha compare to the Oromia national regional state of 1.14ha; while compare to the national average of 1.01ha and 0.6 head of livestock. Generally, small landholders have <0.1 to 0.5ha and bigger landholders have >2ha in the Harareghe zone. These ranges include the west Harareghe zone.
The common agronomic practices in the zone includes: mixed cropping, relay cropping, row cropping, and strip cropping between Katha/Catha edulis planation, row monocropping and a few of a variety of strip cropping. However, the most dominant cropping are maze monocropping and sorghum and maize crops in mixture with bean crops are always practice year to year.
The common farming system is mixed-crops with-livestock farming and in rare with traditional agroforestry. Specifically, mixed cropping, intensive monoculture, strip planting, homestead planting and relay cropping are the common practices in the west Harareghe zone including the study districts and watersheds. The rural and semi-town people that live in the zone are use free grazing during dry seasons and in the restricted areas because of they are no grazing land ; the past grazing land such as swampy and wetlands presently converted into agricultural lands. Densely populated people in the zone are the main causes for these practices and problems occurred. Common staple food crops are grains and cereals such as maize, sorghum, barely, teff, and wheat. Oil crops sesame, and pluses. Coffee, and Catha edulis are the major perennial cash crops and a few fruit cash crops include, orange, avocado and, mango. Root crops onion, carrot, and sugar bit
| [5] | Anebo A., 2018. The National Regional Government Of Oromia, Oromia Environment, Forest And Climate Change, Authority. Oromia National Regional State Forested Landscape Program OFLP 2017/2018 Report of DAs Training on SafeGuard Management and Implementation, To Central Shoa and Eastern Oromia Lead Facilitator office, chiro cluster REDD+ coordination office, chiro, west Harareghe zone, Ethiopia, p1. |
| [24] | Limbalia ,R.N. and Kebebew, K., 2016. Climate change on land suitability for rainfed production in Lake Haramaya watershed, eastern Ethiopia. Journal of earth science and climate change. |
[5, 24]
.
2.1.6. Topography
Watershed topography is the architecture aesthetic value of the landscape features. It is described by the slope of the land. Scientists and different literatures are described watershed topography is based on the land slopes. Landscape features in west Harareghe zone and the study districts including the study watersheds are rugged, mountainous and classified the same as classification of topography of Ethiopian. Topography in Ethiopia has five classes; these are 0-10% which held lowlands (703000km
2) area of the country (less than 15000m a. s. l.) including the flat plain of highland plateau and the valley bottoms. The rests of the classes are found in Ethiopian highlands 11-25%, 26-35%, 36-50% and >50 which occupy the large areas
| [28] | Negash, M., 2017. The needs for the meteorological information to plan agroforestry on steep slopes in Ethiopia. Land use planning department, ministry of agriculture, Addis Ababa, Ethiopia available on www.Worldagroforestryorg’units’html |
[28]
.
Table 2. General Description of Land Topography.
Slope classes% | Description |
0-5/3-8 | Flat slope |
8-15 | Steep slope |
15-30 | Hilly |
30-50 | Rolling |
>50 | Mountainous |
Source: SWC teaching course.
2.2. Methodology
2.2.1. Preliminary Field Surveying
Basic information will be collect before conduct the collection of necessary data and study the proposed problems from five Woreda Gemichse Tullo, Chiro, Beddessa and Doba Woreda offices. This information include, farming systems and their management practices, vegetation covers and, developmental access, topography, model watersheds having homestead practices, and graded stone bund. Considered all factors are a constant factors except the factors that are included in the experimental design and layout; do not change the study problems.
2.2.2. Experimental Design and Sampling Techniques
The merit of the experiment is directs the comparisons between treatments of interests; minimize any bias in the comparisons to design experiments. So that, the errors in the comparison is small and to make stronger the inferences about the nature of differences that we see in the experiment
| [30] | Oehlert W. G., 2010. A First Course in Design and Analysis of Experiments. University of Minnesota, p2. |
[30]
. This experimental design will be involves: three treatments, one watershed per Woreda, two soil depths for sample collection and planned on five Woreda. The treatments are farmstead or homestead, graded stone bund and control land uses. The experiment will be repeat three times.
The study will be consider three factors of comparison with repeated measurements to obtain individual changes of patterns. The past study had been proofed statistically; the statistical design of experiments by refers to the process of planning the experiment. So that, the appropriate data that can be analyzed by statistical methods will be collecting, resulting in valid objectives, conclusions and reach on an applicable recommendations
| [27] | Montgomery D. C., 2001. Montgomery C. D., 2001. Design and Analysis of Experiments (5th Edu.). Arizona State University, JOHN WILEY & SONS, INC., New York Chichester Weinheim Brisbane Toronto Singapore, Arizona, State University, pp. 511-556. |
[27]
. When the problem involves data that are subjected to experimental errors, statistical methodology is the only objective of the approach to analysis the data or the analysis of the data is the only method of reducing an error. According to his argument thus, there are two aspects to any experimental problems: the design of the experiment and the statistical analysis of the data. Based, on this references
| [27] | Montgomery D. C., 2001. Montgomery C. D., 2001. Design and Analysis of Experiments (5th Edu.). Arizona State University, JOHN WILEY & SONS, INC., New York Chichester Weinheim Brisbane Toronto Singapore, Arizona, State University, pp. 511-556. |
[27]
as quantified and reported; there are three basic principles of experimental design: replication, randomization, and blocking. By replication meaning a repetition of the basic experiment in order to approach the accuracy and reduce biasness of errors.
Table 3. Gemachis/Chiro District.
Collection of soil samples from 0-30cm of soil depth and total factors are 9. The design is using Latin square model.
Table 3. Continue.
Soil samples collection from 30-60 cm of soil depth and total factors 9. The design is using Latin square model.
Table 4. Doba/Tullo Districts.
Soil samples collection from 0-30cm of soil depth and total factors are 9. The design is using Latin square model.
Table 4. Continue.
Soil samples collection from 30-60cm of soil depth and total factors are 9. The design is using Latin square model.
Table 5. Beddessa District.
Soil samples collection from 0-30cm of soil depth and total factors are 9. The design is using Latin square model.
Table 5. Continue.
Soil samples collection from 0-30cm of soil depth and total factors are 9. The design is using Latin square model.
In general soil samples will be collects from 0-30cm and 30-60cm soil depth. The total factors will be 3 replication x 3factors = 9 factors. From graded store bunds per EU they will design twenty seven observation unit per EU, nine sample plot or strip plot per EU and the total of 18 composite soil samples x3factors =54 composite soil samples and 54 separate soil samples to determine soil MC and BD will be collects. The second samples will be make composite and use to analyze on the field for soil texture testing (3 samples make 1 composite sample) and the total of 18 composite samples will be make from land uses treated with graded stone bund. From homestead and control land uses Ethen (18) observation unit per EU from three sample plots and three OU per sample plot will be collects 6 composite soil samples. The total of 6 composite samples x 6factors = 36 composite soil samples and also 36 separate soil samples to determine soil MC and BD will be collects which later on they will be used to analyze soil texture using field testing method (s). Then if 3 soil samples make 1 composite soil sample) the total will be 12 composite samples make from homestead and control land uses.
The grand total of soil sample per watershed per Woreda will be, 90 composite soil samples and 90 separate soil samples will be collects for the analysis of laboratory, analysis of soil BD and MC respectively. Thus, from five Woreda 90 composite soil samples x 5 Woreda =450 composite soil samples and 450 separate soil samples will be collects for this study. Later on the separate soil samples used to determine soil MC and BD will used to test soil texture by use the composite soil samples make that the three samples I separate collected make one composites soil samples. The 450 separate soil samples give 150 composite soil samples. Or else (18+12) x 5 Woreda=150 composite soil samples.
2.2.3. Source of Variables
These are known and controlled for both dependent variables called in this case soil properties and independent variables are soil depth, graded stone bund control land uses and farmstead land uses; so that the appropriate statistical analysis for such comparison study is the blocking method is preferable. Hence, with the help of the fact of this CRBD and giving an equal chance of probability for all treatments while they will be collects unequal samples from treatments even if give equal chance because different sample plots and different number of observation units will be uses and collects the required samples of data for this experimental design.
In support to this method
| [27] | Montgomery D. C., 2001. Montgomery C. D., 2001. Design and Analysis of Experiments (5th Edu.). Arizona State University, JOHN WILEY & SONS, INC., New York Chichester Weinheim Brisbane Toronto Singapore, Arizona, State University, pp. 511-556. |
[27]
in his statistical study had said that when the nuisance source of variability is known and controllable, a design technique called blocking can be used to systematically eliminate its effects on the statistical comparisons among treatments. The main reasons of collecting soil samples and testing both in the field and laboratory are to understand the soil properties or essential elements that are held by the soils such as soil colloidal, and crusts
| [9] | Brady Nyle C. and Wevil Ray R., 1999. The nature and properties of soils (12th Ed.). Library of congress, catalog in publication data, United States of America. |
[9]
. The ultimate purposes of soil sample collections and testing are doing through application of soil surveying
| [36] | USAD, 2017. Soil survey manual. Soil science division staffs, Agricultural book no. 18, United States Department, America, pp. 1-17. |
[36]
to conserve and manage properly without missing the fundamental of soil functions and the environment.
2.2.4. Statistical Analysis of Model
An experiment is characterized by the treatments and experimental units to be used, the way treatments are assigned to units, and the responses that are measured | [30] | Oehlert W. G., 2010. A First Course in Design and Analysis of Experiments. University of Minnesota, p2. |
[30]
The “mean” of the population underlying a random variable X is defined as the expected value of X:
Where X bar is mean of the sample population and xi is parameters of measured of sample population, i is number factors to be measured and n is number of jth observation unit.
Sample median:
Population variance:
Population standard deviation:
Table 6. Analysis of Variance Table for a Multiple Linear Regression Model with an Intercept, p Predictor Variables and n Observations.
Source of variation | SS | Df | MS |
Regression | | P | |
Residual | | N-p-1 | |
Total | | N-1 | |
Mean deviation:
2.3. Source of Data
Both primary and secondary data are considered as a source of our data for this study. Primary source of a data will be collects directly from the field by the help of observation and experiment whereas secondary source of data will be collects from the Woreda of NRM offices and agricultural extension offices, books, journals, magazine, thesis, and internets.
2.4. Data Collection Methods
The aim of researches both qualitative and quantitative they will be conduct to solve the problems of the society. For that matter it requires concrete data which are help to upscale in this case the technologies of SWC measures and to improve or to change in a new once as to control erosion, runoff and sedimentation and to improve the production of the soil. Changing is possible if and only if the introduced technologies are not appropriate with agro-climatic conditions of the site, soil type and topography. That is why? Any study will be carrying out to correct the mistakes in layout or site mismatching of SWC technologies that is not appropriate with site and not enough during intervention might be introduce only to develop watershed and not for other aims for instance, if improper design and layout did during the construction must be correct through study.
In order to understand the significance of GSTBs on soil physico-chemical properties and agricultural production and productivity in comparison to homestead and control lands requires a collection of representative soil samples using augur or core sampler and testing in the field and in the laboratory are significant. But the methods of data collection should already proposed and wrote in detail under the design of experiment.
2.5. Data Analysis of the study
Statistical analysis is use to quantify and evaluate the source of variations and this can be achieved through the association of Linear Models either univariate or multivariate General Linear Models
| [19] | Hinkelmann K. and Kempthorne O., 2007. Design and Analysis of Experiments (second Ed.). Introduction to Experimental Design vol. 1, Wiley-Inter-science A John Wiley & Sons, Inc., Publication, WILEY, Hoboken, New Jersey, US America, pp. 29-60. |
[19]
The data has been analyzed using three central tendencies namely Mode, Median and Mean of descriptive statistics
| [26] | Miller S., 2005. Experimental Design and Statistics (2nd edu.). London NeyWork, pp. 23-27. |
| [32] | Sani F. and Tod man J., 2006. Experimental Design and Statistics for Psychology (A 1st Course). Blackwell, Publishing Ltd., Swanston Street, Carlton, Victoria 3053, Australia, pp. 39-50. |
[26, 32]
. The out results will be expressed and presented using descriptive statistics of variance, standard deviation, standard error and mean deviation.
Laboratory analyzed report of the data will be subjected to computer based software of SAS 20 version or SPSS 24 version and carry out statistical analysis of data. GLM/Multivariate/ multiple-way of analysis of variance/ multiple-way of ANOVA/ will be used to observe the positive and negative correlations existed between dependent and independent variables. It will be seeing the relationships between dependent variables such as SOC and BD, MC, soil texture and pH value using person’s correlation. For more clarification the results shall be display using statistical description such as table, chart and bar graph. Moreover, display by histogram, box plot (or box and whisker plot), and dot diagram plus discrete or continues normal distribution. In despite of that to observe the significance of limitation available between parameters; they will proof by using: student t-test independent normal distribution, F-test independent normal distribution, and chi-square test of independent normal distribution (NID) of statistical methods
| [28] | Negash, M., 2017. The needs for the meteorological information to plan agroforestry on steep slopes in Ethiopia. Land use planning department, ministry of agriculture, Addis Ababa, Ethiopia available on www.Worldagroforestryorg’units’html |
[28]
.
2.6. Soil Data Preparation and Analysis
Data preparation requires: impurities separation, crushing of large colds using hammer and grinded using pestle and mortar, sieve by use 2mm diameter sieve and measure the required weight, label, packed and supply to laboratory testing
| [40] | WRDDIRD, 2009. Laboratory Testing Procedure for Soil & Water Sample Analysis. Superintending Engineer & Director Irrigation Research and Development, Directorate of Irrigation Research & Development, Government of Maharashtra, Pune, pp. 3-109. |
[40]
. However, for field soil texture testing do not needs such preparation except impurities separation or clean of the data.
Determination of soil texture is testing in the laboratory by following the procedures of international pipette method or mechanical analysis
| [40] | WRDDIRD, 2009. Laboratory Testing Procedure for Soil & Water Sample Analysis. Superintending Engineer & Director Irrigation Research and Development, Directorate of Irrigation Research & Development, Government of Maharashtra, Pune, pp. 3-109. |
[40]
. The method is encompasses two step of testing: dispersion of soils and determination of distribution of soil particle size by sedimentation method which is refers to Stoke Laws. Soil bulk density is expressed by weight per volume of augur or core sampler. It plays a crucial role to understand soil health, soil biodiversity and the ability to work easily. Field beam balance is used to measure both oven dry and wet weight of the soil samples. Dry weight is measured after dried using oven dry for 24hours at 105°C or after dried using air seasoning for 2 to 3 or (2 to 4) weeks depends on sample wetness
| [40] | WRDDIRD, 2009. Laboratory Testing Procedure for Soil & Water Sample Analysis. Superintending Engineer & Director Irrigation Research and Development, Directorate of Irrigation Research & Development, Government of Maharashtra, Pune, pp. 3-109. |
[40]
. It is calibrated as described below:
Where,

soil bulk density and V is the volume of core sampler or augur.
Soil structure is influenced by three factors of soil textural arrangement. Soil structure is doing in the field by opening soil profile up to 2m depth and 1m width and observe through photo capture and rope tied method. This method also helps to determine soil colors of each soil layer
| [21] | Kalra P. Y., 1998. Handbook of Methods for Plant Analysis. Soil and Plant Analysis Copyright 1998 by Taylor & Francis Group, LLC, Council, Inc. ISBN 1-57444-124-8 CRC Press Boca Raton Boston London New York Washington, D. C., pp. 75-82. |
[21]
. Soil color is influencing by iron oxide and aluminum oxide and its determination of soil color by the procedure of Mussel chart
| [21] | Kalra P. Y., 1998. Handbook of Methods for Plant Analysis. Soil and Plant Analysis Copyright 1998 by Taylor & Francis Group, LLC, Council, Inc. ISBN 1-57444-124-8 CRC Press Boca Raton Boston London New York Washington, D. C., pp. 75-82. |
[21]
. Each site of the study watershed should be captured photograph and come back to office and using Mussel chart or book to recognize soil types by color will be do.
Soil moisture content is determined by using gravimetric method and it play a key role to know how much modify or improve the soil management practice or soil erosion and runoff surface control measures and improve agricultural yield and others land and soil yield. Either disturbed or undisturbed soil moisture content can be calibrated using either mass basis or volume basis by finding the difference between net wet weight and net oven dry weight for 24 hours at 105°C or using air seasoning
| [40] | WRDDIRD, 2009. Laboratory Testing Procedure for Soil & Water Sample Analysis. Superintending Engineer & Director Irrigation Research and Development, Directorate of Irrigation Research & Development, Government of Maharashtra, Pune, pp. 3-109. |
[40]
. Soil moisture content determination as follows: Weight of blank (augur or core sampler) = w
1, Wet weight + weight of blank=w
2 and oven dry weight +weight of blank = w
3V%= soil moisture content percentage *(soil bulk density per water density)
V%= (
V%= (

s per

w)*MC%
This study will be focus on the major and essential chemical elements that requires for plant growth and their metabolic activates more in detail. These mineral elements includes: soil total nitrogen, available soil phosphors, potassium, and sulfur, calcium, magnesium and soil organic carbon. The determination of soil organic carbon is using Walkley-Black procedure. In this method the soil organic carbon is partially oxidized by potassium dichromate in the presence of sulfuric acid.
Potassium dichromate produces nascent oxygen, which combines with the carbon of organic matter to produce CO2. The excess dichromate is titrated with ferrous ammonium sulphate,
this method is convenient, and is fairly accurate for many soils. However, the titration step is time-consuming | [40] | WRDDIRD, 2009. Laboratory Testing Procedure for Soil & Water Sample Analysis. Superintending Engineer & Director Irrigation Research and Development, Directorate of Irrigation Research & Development, Government of Maharashtra, Pune, pp. 3-109. |
| [2] | Adepetu A. J. etal, 2000. Simple soil, water and plant testing techniques for soil resource management. Land and water development division, international institute of tropical agriculture, Food and Agriculture Organization of the United Nations, Rome Italy. pp. 47-53. |
[40, 2]
. Soil phosphorous is the next major and the critical essential elements that is influence the plant growth and development, because of the production or yields depend on their biomass of growth and development. Soil phosphorus determination: follow the procedures of Olsen’s method as the laboratory manuals did by
| [21] | Kalra P. Y., 1998. Handbook of Methods for Plant Analysis. Soil and Plant Analysis Copyright 1998 by Taylor & Francis Group, LLC, Council, Inc. ISBN 1-57444-124-8 CRC Press Boca Raton Boston London New York Washington, D. C., pp. 75-82. |
| [40] | WRDDIRD, 2009. Laboratory Testing Procedure for Soil & Water Sample Analysis. Superintending Engineer & Director Irrigation Research and Development, Directorate of Irrigation Research & Development, Government of Maharashtra, Pune, pp. 3-109. |
| [3] | AES (Agricultural Experiment Station), 1978. Methods of soil analysis used in the soil testing laboratory at Oregon State University. no. 321, cop. 2, S105. E55, y Oregon State University, Corvallis, pp. 3-42. |
| [2] | Adepetu A. J. etal, 2000. Simple soil, water and plant testing techniques for soil resource management. Land and water development division, international institute of tropical agriculture, Food and Agriculture Organization of the United Nations, Rome Italy. pp. 47-53. |
[21, 40, 3, 2]
. Total soil nitrogen is determined by alkaline permanganate method and similarly around since the 1800s by the method of Jolian Kjeldahl soil nitrogen determination which is still in doing.
The ammonia released during oxidation is absorbed in boric acid to convert the ammonia to ammonium borate. The ammonium borate formed is titrated with standard H2SO4. From the volume of standard H2SO4 required for the reaction with ammonium borate, the N is calculated | [40] | WRDDIRD, 2009. Laboratory Testing Procedure for Soil & Water Sample Analysis. Superintending Engineer & Director Irrigation Research and Development, Directorate of Irrigation Research & Development, Government of Maharashtra, Pune, pp. 3-109. |
| [3] | AES (Agricultural Experiment Station), 1978. Methods of soil analysis used in the soil testing laboratory at Oregon State University. no. 321, cop. 2, S105. E55, y Oregon State University, Corvallis, pp. 3-42. |
[40, 3]
.
OrWhere N isnormality of
Soil potassium determination in the soil and plant tissue available potassium are by the method of flame emission spectrophotometer
| [40] | WRDDIRD, 2009. Laboratory Testing Procedure for Soil & Water Sample Analysis. Superintending Engineer & Director Irrigation Research and Development, Directorate of Irrigation Research & Development, Government of Maharashtra, Pune, pp. 3-109. |
| [21] | Kalra P. Y., 1998. Handbook of Methods for Plant Analysis. Soil and Plant Analysis Copyright 1998 by Taylor & Francis Group, LLC, Council, Inc. ISBN 1-57444-124-8 CRC Press Boca Raton Boston London New York Washington, D. C., pp. 75-82. |
| [14] | FAO, 2000. Simple Soil, Water and Plant Testing Techniques for Soil Resource Management. International Institute of Tropical Agriculture Food and Agriculture Organization of the United Nations, Proceedings of A Training Course Held In Ibadan, Nigeria, 16-27 September 1996, Land and Water Development Division, vol. 00100, Rome, Italy. pp. 19-26. |
| [3] | AES (Agricultural Experiment Station), 1978. Methods of soil analysis used in the soil testing laboratory at Oregon State University. no. 321, cop. 2, S105. E55, y Oregon State University, Corvallis, pp. 3-42. |
[40, 21, 14, 3]
. The most popular method for the last 20 years and still the best method preferable to analysis potassium and sodium held in the soil minerals and plant tissues. The spectrophotometer is limited only for a few essential elements required by plant growth and its metabolism. These are K, Na and Li are easily determined by this method. Soil magnesium and soil calcium: the best method for determination of calcium and magnesium in plant tissue and in the soil is refers to E. D. T. A. Titrimetric Method
| [21] | Kalra P. Y., 1998. Handbook of Methods for Plant Analysis. Soil and Plant Analysis Copyright 1998 by Taylor & Francis Group, LLC, Council, Inc. ISBN 1-57444-124-8 CRC Press Boca Raton Boston London New York Washington, D. C., pp. 75-82. |
| [3] | AES (Agricultural Experiment Station), 1978. Methods of soil analysis used in the soil testing laboratory at Oregon State University. no. 321, cop. 2, S105. E55, y Oregon State University, Corvallis, pp. 3-42. |
| [40] | WRDDIRD, 2009. Laboratory Testing Procedure for Soil & Water Sample Analysis. Superintending Engineer & Director Irrigation Research and Development, Directorate of Irrigation Research & Development, Government of Maharashtra, Pune, pp. 3-109. |
[21, 3, 40]
or by the method of ammonium acetate solution. In addition to the above essential elements; it will be seeing the soil pH, , and sodium. Soil exchange capacity (CEC): is a measure of the quantity of readily exchangeable cations neutralizing the negative charge in the soil. It is defined as the capacity of the soil to absorb the sum of the total exchangeable cations in the soil. It is expressed in mill-equivalent per 100gram of soil on oven dry basis. The replacement of cations by one another is known as cation exchange and here the orders of replacement by some cations are: H
+>Ca
++>Mg
++>K
+>NH
4+>Na
+>Si
++++. Therefore, CEC determination is doing by following the procedures of ammonium saturation method or Sodium Saturation Method
| [40] | WRDDIRD, 2009. Laboratory Testing Procedure for Soil & Water Sample Analysis. Superintending Engineer & Director Irrigation Research and Development, Directorate of Irrigation Research & Development, Government of Maharashtra, Pune, pp. 3-109. |
| [21] | Kalra P. Y., 1998. Handbook of Methods for Plant Analysis. Soil and Plant Analysis Copyright 1998 by Taylor & Francis Group, LLC, Council, Inc. ISBN 1-57444-124-8 CRC Press Boca Raton Boston London New York Washington, D. C., pp. 75-82. |
[40, 21]
. In addition to
that, the ammonium acetate method is suitable for neutral and non-calcareous soils, since displacement of hydrogen ions from acid soils may be incomplete. The extraction with ammonium acetate is also a reliable method for determination of CEC of acid soils if it is combined with another method for measurement of exchange acidity | [40] | WRDDIRD, 2009. Laboratory Testing Procedure for Soil & Water Sample Analysis. Superintending Engineer & Director Irrigation Research and Development, Directorate of Irrigation Research & Development, Government of Maharashtra, Pune, pp. 3-109. |
| [21] | Kalra P. Y., 1998. Handbook of Methods for Plant Analysis. Soil and Plant Analysis Copyright 1998 by Taylor & Francis Group, LLC, Council, Inc. ISBN 1-57444-124-8 CRC Press Boca Raton Boston London New York Washington, D. C., pp. 75-82. |
[40, 21]
.
Soil pH (soil Reaction: soil pH is determined accurately by using soil pH meter. PH-value is an important indication of soil fertility and productivity that had shown the soil acidity and alkalinity of the soil
| [9] | Brady Nyle C. and Wevil Ray R., 1999. The nature and properties of soils (12th Ed.). Library of congress, catalog in publication data, United States of America. |
| [14] | FAO, 2000. Simple Soil, Water and Plant Testing Techniques for Soil Resource Management. International Institute of Tropical Agriculture Food and Agriculture Organization of the United Nations, Proceedings of A Training Course Held In Ibadan, Nigeria, 16-27 September 1996, Land and Water Development Division, vol. 00100, Rome, Italy. pp. 19-26. |
[9, 14]
. The method is used a sensing glass of electrode which is commonly known as a standard calomel electrode inserted into a soil: water mixture ratio to simulate soil solution. Therefore, the difference between the H+ ion activities in the wet soil and in the glass electrode giving rise to the electrometric potential which is related to soil solution pH and the most common ratio of soil: water to analyzed soil pH is 1:1, 1:2 and 1:2.5.