Research Article | | Peer-Reviewed

Geomechanical and Structural Investigations of Production-Induced Stress Changes in Reservoir Sands in Part of Niger Delta Nigeria

Received: 17 October 2025     Accepted: 8 June 2026     Published: 11 July 2026
Views:       Downloads:
Abstract

Hydrocarbon production reduces pore-fluid pressure and increases the effective stress acting on the grain framework of reservoir rocks. This process induces reservoir deformation, compaction, and stress redistribution, often manifesting as fault reactivation, surface subsidence, wellbore instability, and 4D seismic time shifts. In this study, we present a geomechanical and structural interpretation of production-induced stress changes in the Kolo-Creek Field, Coastal Swamp Niger Delta, Nigeria. The analysis integrates 3D seismic interpretation, geomechanical evaluation, well-log analysis, and production data. Time-lapse seismic surveys acquired in 1997 (base) and 2009 (monitor) show clear 4D responses with a root-mean-square repeatability ratio (RRR) of 0.38, indicating excellent survey repeatability. The seismic interpretation reveals fault reactivation and fracturing associated with production-induced stress changes. Geophysical well logs from seven wells were used to delineate and correlate three reservoir zones (Sand A, Sand B, and Sand C). Petrophysical analysis indicates low shale content ranging from 7.74–37.44%, high porosity values between 0.19 and 0.36), and excellent permeability varying from 375–3327 mD, which is consistent with high-quality, coarse-grained sandstones. Production and pressure data provided by SPDC show a decline from 1592.55 to 400.34 bbl/day and from 4766 to 3103 psi over 12 years, respectively, corroborating with the geomechanical interpretation. The integration of geomechanics with seismic and structural analysis demonstrates the influence of reservoir stress changes on fault behavior and reservoir performance, providing insights to optimize production and manage risks in similar deltaic settings. This study could lead to Wellbore Stability Management; Using stress change predictions to guide well placement and drilling orientation, minimizing risks of shear failure, casing deformation, and production losses.

Published in Petroleum Science and Engineering (Volume 10, Issue 2)
DOI 10.11648/j.pse.20261002.11
Page(s) 63-84
Creative Commons

This is an Open Access article, distributed under the terms of the Creative Commons Attribution 4.0 International License (http://creativecommons.org/licenses/by/4.0/), which permits unrestricted use, distribution and reproduction in any medium or format, provided the original work is properly cited.

Copyright

Copyright © The Author(s), 2026. Published by Science Publishing Group

Keywords

Pore Pressure, Induced-stress, Geomechanical, Reservoir, Permeability

1. Introduction
Hydrocarbon producing reservoirs are subjected to pore pressure depletion, loss of porosity and permeabilities as overburden pressure remain unchanged and this creates changes in the stress and strain fields of the rock material both inside and outside the reservoir . This pressure depletion leads to compaction, which has implications on production performance . 4D seismic time-lapse is a method used in evaluate hydrocarbon production induced stress change in a reservoir. To better achieve such information, it is important to have a good understanding of induce stress change, pressure depletion, rock physics and geomechanical parameters. The aim of this process is to economically establish the existence of producible reservoirs. In this study, well logs data, seismic data, pressure and production data were analyzed and interpreted in order to evaluate stress changes in a producing reservoir in Kolo-Creek Field in the Coastal Swamp Niger Delta Nigeria. The results of the work can be applied in the hydrocarbon exploration scheme to minimize the damages associated with production. In this study, we use model-based inversion and neural network to evaluate time-lapse seismic attributes for a reservoir in Niger Delta field undergoing compaction due to effective stress changes within the reservoir. Seismic time lapse caused by geomechanical changes in the overburden can give complementary information, since these overburden geomechanical changes are often closely linked with the reservoir pressure changes and are independent of fluid changes .
2. Location and Geology of the Study Area
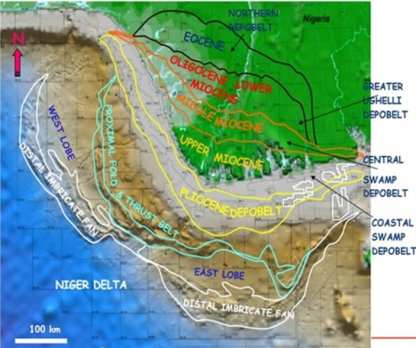
The Kolo-Field OML-28 Field is the study area and it is located in the Northeast of Bayelsa State and lies on latitudes 4°50’58’’-4°55’19’’N and longitudes 6°18’41’’-6°26’41’’E (Figure 1. The Kolo-Field is located in the Coastal Swamp Depobelt Niger Delta of aerial extent of about 840 km2. The main reservoir is oil bearing, located at a depth range of 3580-3670m with thickness of about 50-60m with a sedimentary sequence described as mainly a deltaic depositional sub-environment. The Kolo-Field Reservoir, characterized by numerous predominantly E trending growth faults, is of the Middle Miocene and of the Agbada Formation . Kolo-Field is made up of fresh water and marine swamps. . Like other deltaic regions in the world, it is characterized by both marine and mixed continental depositional environment.
Figure 1. Location of the study area in a yellow box .
3. Materials and Methods
The data consist of base and monitor seismic data acquired at different Vintages, Well logs suite which include: velocity logs (Vp and Vs), Gamma ray log, density log, neutron log, resistivity log, caliper log, well information (i.e. well header, deviation data, well tops, derrick floor elevation and well checkshots data, production and pressure data from seven wells (Well A, B, C, D, E, F and G). However, due to the gaps and null values in some wells, not all were used in the analysis. These data were analysed using Schlumberger-owned interpretation and visualization software Petrel 2016.3 edition, 3DFieldPro software was used for overburden velocity analysis and contouring. For rock physics-based reservoir characterization, Hampson Russell Software Version 10.4.2 owned by CGG GeoSoftware was used. The methodology to estimate quantitative petrophysical properties from wireline log data using various rock physics models has the following stages: Well log preparation and editing, delineation of reservoir beds and well log correlation, petrophysical properties estimation, carried out well-to-seismic tie; generate the difference cube from the base and monitor data and quantify the repeatability (RRR) for the time-lapse seismic data; estimate seismic attributes; and carried out Geomechanical interpretation.
3.1. Delineation of Reservoir Beds
This is the process of determining reservoir zones with considerable hydrocarbon saturation. Logs respond to different lithologies. The gamma ray (GR) log is particularly useful for defining shale beds as well as the Spontaneous Potential (SP) log. The GR log reflects the proportion of shale and, in many regions, can be used quantitatively as a shale indicator.
3.2. Litho-stratigraphy Correlation
A horizon represents an isochronous geologic time surface. It is the interface between two different rocks layers. It is associated with continuous and reliable reflection on the sections that appear over a large area. In order to perform a log analysis, it is necessary to pick the various zones of interest. In this study, selection of values was made on a consistent basis from day to day to assist reproducibility of results.
3.3. Computation of Petrophysical Properties
3.3.1. Volume of Shale (Vsh)
Dresser proposed a new approach as a result of empirical correlation where the relationship changes according to the age or volume content of the formation, and Larionov, 1969 method formular was used to calculate the volume of shale in Tertiary rock formations. Younger rocks (Tertiary), unconsolidated .
Vsh=0.083(23.7IGR–1)(1)
where = Gamma ray index
= shale volume
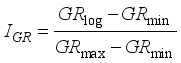
The gamma-ray index can be obtained from the linear equation proposed by .
(2)
where = Gamma Ray Index; = Gamma Ray Reading from Log; = Minimum Reading of Gamma Ray Log; = Maximum Gamma Ray Reading
3.3.2. Determination of Water Saturation (Sw)
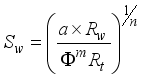
The Archie’s formula as reported in was used to calculate water saturation.
(3)
where Sw = Water saturation; a = Tortuosity factor; m = Cementation factor; n = Saturation exponent;
Φ = Porosity of the formation; Rt = Deep resistivity of the formation.
3.3.3. Total Porosity (Φt) and Effective Porosity (Φeff)
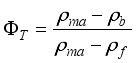
In this work, the density log was used for the determination of the porosity by applying the equation (5) . Total Porosity was calculated from density porosity log using the equation (4) .
(4)
(5)
Where, = Total Porosity; = Density of the rock matrix; = Bulk density read directly from the log; = Fluid density; = Effective Porosity; = Total Porosity of Shale; = Volume of shale.
3.3.4. Determination of Net/Gross Reservoir Thickness
The net reservoir thickness was obtained for all the reservoirs in the wells .
h=H-hshale(6)
Net/Gross=h/H(7)
Where: H = gross reservoir thickness; h= net reservoir thickness, hshale= shale thickness.
3.3.5. Determination of Permeability (K)
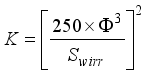
The permeability values for the observed reservoirs were calculated using the equation . Formation factor was determined using equation (10) . The irreducible water saturation was obtained using equation (9) modelled by .
(8)
(9)
(10)
where = Irreducible Water Saturation; = Formation Factor; = Porosity; K= Permeability.
3.4. Seismic Intepretation
3.4.1. Well Log Conditioning
Sonic logs were adjusted according to seismic measurements in the boreholes because sonic times obtained through the integration of sonic logs usually differ from those obtained using a well seismic. The reasons for drift range from basic discrepancies between two approaches due to different geometry/frequency of measurement principles. Therefore, it is necessary to calibrate the sonic logs to eliminate these possible errors to use it for seismic applications for a particular area.
3.4.2. Checkshot
The checkshot survey provides accurate depth-time relationship between the seismic data and well log data. This is essential for calibrating seismic data to obtain the true subsurface depths, thereby enhancing the accuracy of reservoir characterization.
3.4.3. Well-to-Seismic Tie
This relates subsurface measurements obtained at a wellbore measured in depth and seismic data measured in time. It provides a means of correctly identifying horizons to pick and interprete the seismic data in terms of geological structure and properties .
3.4.4. Horizon Interpretation
The horizons were picked based on stratigraphic information and formation tops provided by wells in the study region immediately after the seismic-to-well tie process. The subsurface structure was interpreted seismically by selecting horizons along coherent reflections of the same phase and it is shown in Figure 6 Horizon (Sand D-2) was interpreted on every 10-inline or cross-lines interval. Interpreted horizons are representative of the Niger Delta anticlinal structures with E-W trending synthetic and antithetic faults.
3.4.5. Velocity Modelling
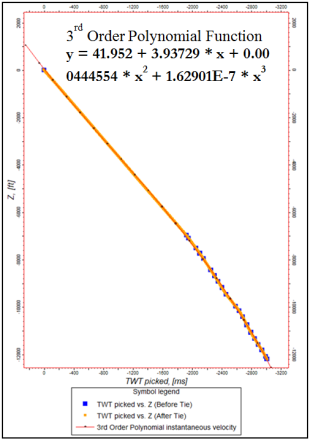
Time Depth Relationship (TDR) function was utilized for converting the surfaces from time to depth.
The third order polynomial function gave the best fit to the velocity data and hence was used as the input for the velocity model conversion. The equation was utilized in Petrel calculator for the conversion of surfaces from time to depth. This is shown in Figure 8.
Equation below defines this model:
(z)=V0(z+KZ).(11)
Where, V(z) is the instantaneous velocity, Z is depth, Vo(m/s) is the top-interface velocity, and K(s1) is the velocity gradient or compaction factor.
3.4.6. Seismic Attribute Analysis
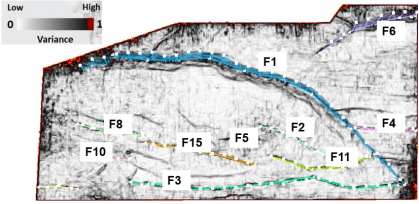
Variance attributes were used to map the structure and shape of geological features of interest, such as faults, subtle faults, anticlines, channels and fractures. This is shown in Figure 9.
3.4.7. Fault Interpretation.
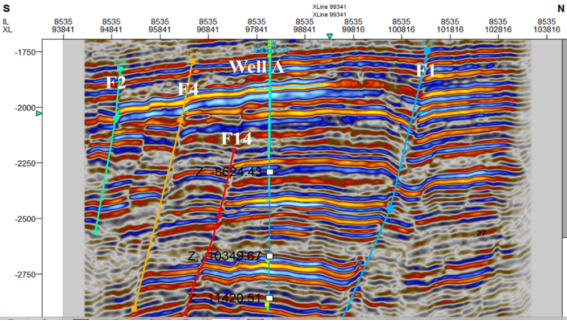
The variance coherency property was utilized to aid in the depiction of faults that were difficult to identify in the original seismic data as shown in Figure 10.
3.4.8. Structural Smoothing
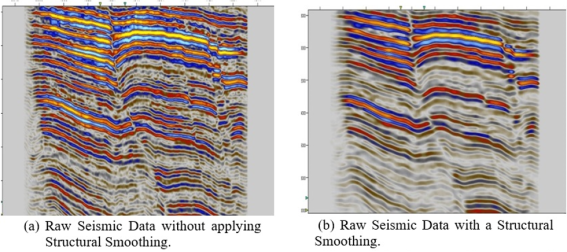
Structural smoothing was carried out on the seismic data to enhance the visibility of geological structures and reduced noise. This is shown in Figures 11-13.
3.4.9. Ant-Attributes
The variance attributes which is sensitive to faults is applied to the seismic data set; and the outputs from these processes is used as our input data to run the ant attribute with which the faults were clearly seen that were difficult to display on the raw seismic data set.
3.5. Determination of Acoustic Impedance from Monitor Seismic Data
It was used to predict rock properties, such as porosity and fluid saturation. The changes in acoustic impedance were used to indicate changes in rock properties or lithology. It is calculated using the equation (12), .
Z=ρ×V(12)
where: ρ = density of the rock; V = velocity of the seismic wave.
3.6. Determination of Geomechanical Properties from Monitor Seismic Data
Geomechanical properties which included: elastic moduli [Young’s modulus and Poisson ratio (PR)] and rock mechanical strength properties (closure stress ratio (CSR) and brittleness (BRI)) were generated from the inversion analysis to understand the distribution of rock strength properties across the field.
3.6.1. Poisson's Ratio (ν)
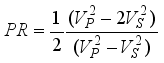
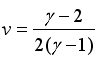
It measures the change in dimensions perpendicular to a compressional or tensile stress (i.e. how wide a body gets when compressed or how thin it gets when stretched). A change in this ratio can indicate a change in the pore fluid. Poisson's Ratio can be defined in terms of velocity: in equation (13-15) as described by .
(13)
but it can also be given in terms of the VP to VS ratio:
(14)
(15)
3.6.2. Young’s Modulus (E)
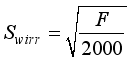
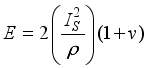
It measures the stiffness of elastic material through the ratio of stress and strain. Generally, the higher the E, the more brittle the rock. This parameter is computed empirically using Russell and Hampson’s relation given in Equation (16).
(16)
3.6.3. Closure Stress Ratio (CSR)
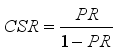
Closure stress ratio (CSR) is the degree of pressure at which fracture closes after the fracturing pressure is relaxed. Rocks with high closure stress are basically harder to fracture than rocks with lower closure stress. This parameter is computed empirically using Russell and Hampson’s relation given in Equation (17). as:
(17)
3.6.4. Brittleness (BRI)
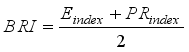
Brittleness (BRI) defines the ability of a material to break with little elastic deformation and significant plastic deformation when subjected to some degree of stress. This is proportional to the Young's Modulus and inversely proportional to the Poisson's Ratio. Brittle rocks are harder and rigid but with very little tensile. This geomechanical property can be estimated empirically using Equation (18) as:
(18)
Where is the Young’s Modulus index given as:
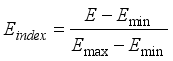
(19)
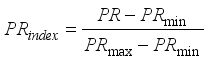
Where is the Poisson Ratio index given as:
(20)
3.7. Determination of Effective Pressure
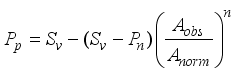
Eaton’s method was used to predict pore pressure in this work. The form of the Eaton equation is .
(21)
Where Pp is the pore pressure; Sv is the total vertical stress (overburden or lithostatic pressure); Pn is the normal or hydrostatic pressure; Aobs is the observed attribute (sonic travel time, resistivity etc); Anorm is the attribute when pore pressure is normal, and n is an empirical constant.
3.8. Production and Pressure Data
The Production data which includes; fluid production flow rates of individual wells, cumulative production of each fluid produced from the reservoir over time, gas-oil ratio, water cut and reservoir pressure versus oil days of production of Well C and Well D were obtained from Shell Petroleum Development Company (SPDC), Port Harcourt, Rivers State.
4. Results and Discussion
4.1. Delineated and Identified Reservoirs
The delineated reservoirs across the wells of the field showing names, Tops, Bases, and thicknesses is presented in Table 1. Table 1 indicates that three reservoirs (Sand 1, 2 and 3) were delineated for each of the seven wells. The thickness of the wells varied from 43-245 ft. the wells display a sand-shale intercalated sequence, which is characteristic of the Niger delta formation. Shale lithologies were defined by high gamma ray values, Shale lithologies cause the deflection of resistivity to the far left due to its high conductive nature. Regions showing low gamma ray, and high resistivity are mapped as sand lithologies and these are considered reservoirs.

Well

Reservoir Name

Top MD (Ft)

Base MD (Ft)

Thickness (Ft)

Well A

SAND 1

10477

10593

116

SAND 2

10750

10820

70

SAND 3

11508

11731

223

Well B

SAND 1

10790

10907

117

SAND 2

11120

11201

81

SAND 3

11780

11975

195

Well C

SAND 1

10926

11032

106

SAND 2

11250

11330

80

SAND 3

11946

12191

245

Well D

SAND 1

10879

10984

105

SAND 2

11225

11300

75

SAND 3

12010

12247

237

Well E

SAND 1

10723

10867

144

SAND 2

11100

11172

72

SAND 3

11755

11963

208

Well F

SAND 1

10890

10945

55

SAND 2

11190

11250

60

SAND 3

11935

12099

164

Well G

SAND 1

10621

10728

107

SAND 2

10940

11045

105

SAND 3

11726

11915

189

4.2. Lithologic Correlation
Figure 2. Litho-stratigraphic Correlated reservoirs across all Seven Wells.
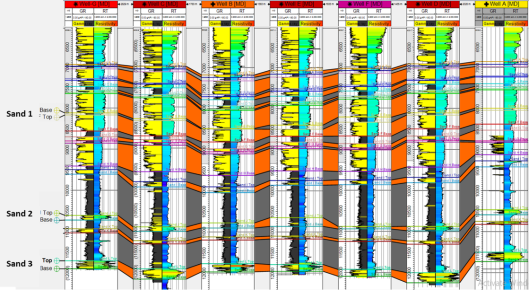
Lithologic units were identified on the logs and correlated across the wells (Figure 2). The stratigraphic cross-sections produced show a general lateral continuity of the lithologic units across the field. Three zones of interest (Sand 1, Sand 2 and Sand 3) were delineated and correlated across all seven wells. The litho-stratigraphy correlation section revealed that each of the sand units’ spreads over the field and differs in thickness with some units occurring at greater depth than their adjacent unit.
4.3. Evaluated Petrophysical Parameters
The estimated values of the several petrophysical parameters, using the appropriate empirical models stated previously, are presented in Table 2. The wells are Well A, Well B, Well C, Well D, Well E, Well F and Well G. After the wells were delineated, petrophysical properties were evaluated for each reservoir. The results obtained for the entire reservoirs are thus analysed. The volume of shale was calculated from gamma ray index and the values range from 7.74% to 37.44% indicating that the fraction of shale in the reservoirs is quite low and the volume of sand deposit is larger than shale, therefore, hydrocarbon saturated. These reservoirs are good reservoir with high oil saturation at irreducible water saturation, because volume of shale values is low from 7.74% to 37.44%, which means that the sand body in all the reservoirs is high and there will be high rate of free flow of hydrocarbon in all the reservoirs as corroborated by their permeability values. The total porosity of the reservoirs was estimated from density log (RHOB) using porosity formula and these values ranges from 0.19 to 0.36 indicating a very good reservoir quality and reflecting probably well sorted coarse-grained sandstone reservoirs with minimal cementation. The permeability of the reservoirs ranges from 375 Md to 3327 Md. This implies that the permeability varies from very good to excellent and suggests that these are good (exploitable) reservoir horizon. For a rock to be considered as an exploitable hydrocarbon reservoir without stimulation, its permeability must be greater than approximately 100 md (however, depending on the nature of the hydrocarbon - gas reservoirs with lower permeabilities are still exploitable because of the lower viscosity of gas with respect to oil). This is as a result of very good to excellent sand quality.
Table 2. Petrophysical Evaluation for Reservoir SAND 1 Correlated across WELLS A to G.

Petrophysical parameters

Unit

Well A

Well B

Well C

Well D

Well E

Well F

Well G

Top

Base

Top

Base

Top

Base

Top

Base

Top

Base

Top

Base

Top

Base

10465

10587

10778

10901

10914

11026

10867

10978

10711

10861

10878

10939

10609

10722

Gross Thickness

Ft

122.00

123.00

112.00

111.00

150.00

61.00

113.00

Shale Volume

%

28.30

25.04

17.61

24.73

39.09

28.18

22.29

Net Thickness

Ft

87.47

92.25

92.29

83.58

91.50

43.81

87.81

Net to Gross

0.72

0.75

0.82

0.75

0.61

0.72

0.78

Total Porosity

%

25.20

n.a.

30.49

26.91

24.57

21.34

28.96

Effective Porosity

%

3.00

n.a.

25.19

20.45

15.04

15.75

22.56

Water Saturation

%

18.47

73.56

36.92

23.83

76.84

81.99

33.85

Hydrocarbon Saturation

%

81.53

26.44

63.08

76.17

23.16

18.01

66.15

Permeability

mD

375.21

n.a.

2108.74

1454.11

928.88

1036.32

1688.62

Table 3. Petrophysical Evaluation for Reservoir SAND 2 Correlated across WELLS A to G.

Petrophysical parameters

Unit

Well A

Well B

Well C

Well D

Well E

Well F

Well G

Top

Base

Top

Base

Top

Base

Top

Base

Top

Base

Top

Base

Top

Base

10750

10820

11120

11201

11250

11330

11225

11300

11100

11172

11190

11250

10940

11045

Gross Thickness

Ft

70.0

81.0

80.0

75.0

72.0

60.0

105.0

Shale Volume

%

32.87

29.09

14.45

18.88

30.80

21.27

21.16

Net to Gross

0.68

0.71

0.86

0.81

0.70

0.79

0.79

Net Thickness

Ft

47.60

57.51

68.80

60.75

50.40

47.40

82.95

Total Porosity

%

23.10

20.13

29.91

31.89

24.36

21.00

25.77

Effective Porosity

%

7.92

14.29

25.82

26.57

17.10

16.86

20.67

Water Saturation

%

15.69

48.03

27.96

20.28

49.59

68.05

28.07

Hydrocarbon Saturation

%

84.31

51.97

72.04

79.72

50.41

31.95

71.93

Permeability

mD

655.01

1005.07

2254.16

2390.75

1146.99

1126.10

1529.25

Table 4. Petrophysical Evaluation for Reservoir SAND 3 Correlated across WELLS A to G.

Petrophysical parameters

Unit

Well A

Well B

Well C

Well D

Well E

Well F

Well G

Top

Base

Top

Base

Top

Base

Top

Base

Top

Base

Top

Base

Top

Base

11496

11725

11768

11969

11934

12185

11998

12241

11743

11957

11923

12093

11714

11909

Gross Thickness

Ft

229.00

201.00

251.00

243.00

214.00

170.00

195.00

Shale Volume

%

37.44

33.13

11.28

13.02

22.50

14.36

20.03

Net Thickness

Ft

143.26

134.41

222.69

211.41

165.85

145.59

156.00

Net to Gross

0.63

0.67

0.89

0.87

0.78

0.86

0.80

Total Porosity

%

21.00

20.13

29.32

36.86

24.14

20.66

22.58

Effective Porosity

%

12.84

14.29

26.44

32.68

19.15

17.97

18.78

Water Saturation

%

12.91

22.49

18.99

16.73

22.34

54.10

22.29

Hydrocarbon Saturation

%

87.09

77.51

81.01

83.27

77.66

45.90

77.71

Permeability

mD

934.80

1005.07

2399.57

3327.39

1365.09

1215.87

1369.88

Table 5. Summary of Petrophysical Properties for Reservoirs Sands 1, 2 and 3.

Reservoir Sand

Net Sand Thickness (ft)

Total Porosity (%)

Effective Porosity (%)

Range (ft)

Average (ft)

Range (%)

Average (%)

Range (%)

Average (%)

1

10465-11026

113.1

21.34-30.49

26.2

3.00-25.19

17.00

2

10750-11330

77.6

21.00-31.89

25.2

7.92-26.57

18.50

3

11494-12241

214.7

21.00-36.86

25.00

12.84-26.44

20.3

Average

135.1

25.50

18.6

Table 5. Continued.

Reservoir Sand

Water Saturation (Sw) (%)

Permeability (mD)

Range (%)

Average (%)

Range (mD)

Average (mD)

1

18.49-81.99

49.40

375.21-2108.74

1265.3

2

15.69-68.05

36.80

655.01-2254.16

1443.9

3

45.90-87.09

24.30

934.80-3327.39

1659.7

Average

36.80

1445.3

4.4. Seismic Intepretation
4.4.1. Well Log Conditioning
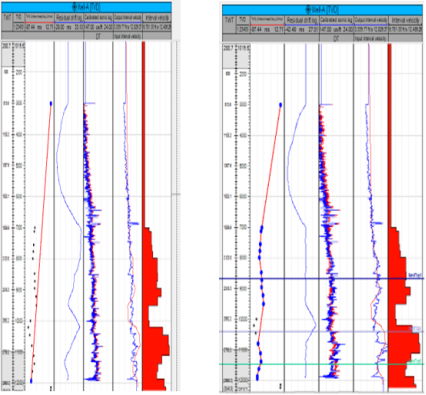
Sonic logs were adjusted to suit the seismic measurements in the boreholes. This is because the sonic times obtained from sonic usually differ from those obtained using a well seismic. Therefore, it is necessary to calibrate the sonic logs to eliminate these possible errors before using it for seismic applications This was done on well A as shown in Figure 3.
Figure 3. (a) Drift Analysis before sonic log calibration done on Well A. (b) Drift Analysis after sonic log calibration done on Well A.
4.4.2. Checkshot
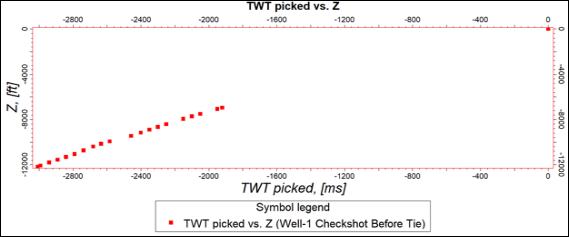
The checkshot, sonic and density logs for the well were first checked for unit consistencies and missing intervals.
Figure 4. Quality of Well-E Checkshot Utilized for Well-to-Seismic Tie.
4.4.3. Seismic-to-Well Tie
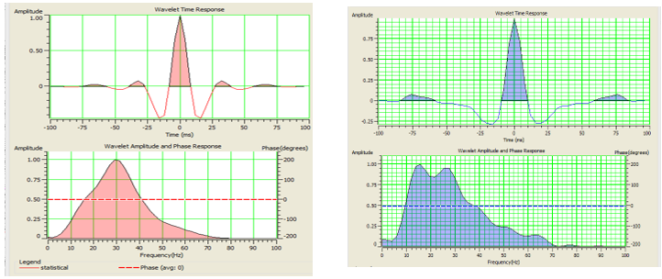
Well-to-seismic tie was carried out using synthetic seismograms generated along well E that have checkshots and complete sonic and density logs shown in Figure 4. This process manually stretches or squeezes the log in order to improve the time correlation between the target log and the seismic attributes as shown in Figure 5b.
Figure 5. (a) Extracted Wavelet from Well A with Average Phase (-2), and Frequency Content of 5Hz. This replaces the Lost in low Frequency content in Seismic Data. (b) Extracted Wavelet for Seismic to Well Tie with Average Phase (0), with Frequency Content of 75Hz.
4.4.4. Horizon Interpretation
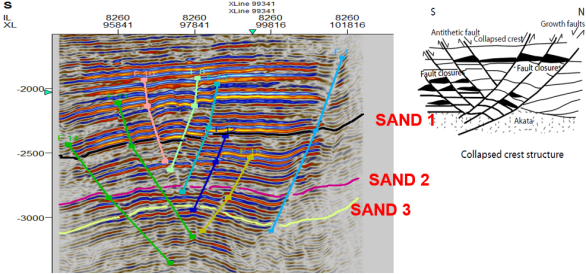
The horizons were picked based on stratigraphic information and formation tops provided by wells in the study region. Horizon (Sand D-2) was interpreted on every 10-inline or cross-lines interval. The interpreted horizons show the Niger Delta anticlinal structures with E-W trending synthetic and antithetic faults.
Inset Figure, common fault types in Niger Delta

Download: Download full-size image

Figure 6. Seismic inline 8260 showing interpreted synthetic and antithetic faults and Horizons.
4.4.5. Velocity Modelling
Time Depth Relationship (TDR) function was utilized for converting the surfaces from time to depth.
The third order polynomial function gave the best fit to the velocity data and hence was used as the input for the velocity model conversion. The equation was utilized in Petrel calculator for the conversion of surfaces from time to depth. This is shown in Figure 7.
Equation below defines this model:
Figure 7. Third Order Polynomial Velocity Model Utilized for Converting Reservoir Surfaces from Time to Depth.
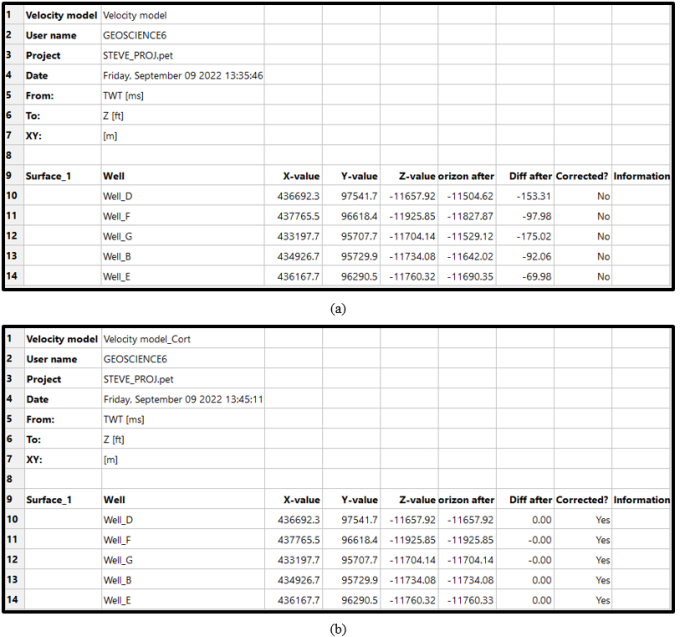
Figure 8. Velocity Model (a) and (b).
4.4.6. Seismic Attribute Analysis
Variance attributes were used to map the structure and shape of geological features of interest, such as faults, subtle faults, anticlines, channels and fractures.
Figure 9. Variance attributes (at 2000 seconds) to delineate major faults and minor faults.
4.4.7. Fault Interpretation
The faults were initially identified on the time slices using the variance property, then on the inline direction. This was required to ascertain the horizontal extent of the fault traces. The inline direction was chosen because it is perpendicular to the geologic strike and structures are found in this direction.
Figure 10. Seismic inline 8535 showing interpreted synthetic and antithetic faults.
4.4.8. Structural Smoothing
Structural smoothing was carried out on the seismic data to enhance the visibility of geological structures and reduced noise. This is shown in Figures 11-13.
Figure 11. Effect of structural smoothing (a) Raw Seismic Data without Applying Structural Smoothing) and (b) the Application of Structural Smoothing.
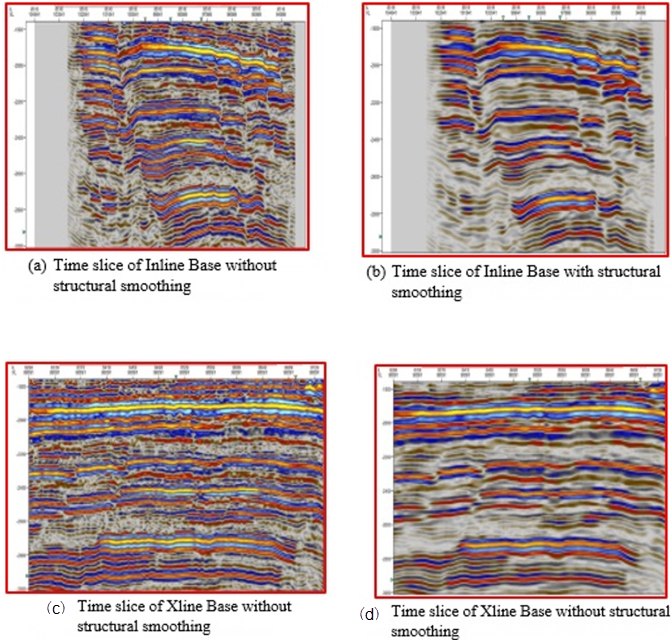
Figure 12. Shows Time Slice of Inline and Xline of the Seismic Data for both Base and Monitor (a) Inline base without Structural Smoothing (b) Inline base and the Application of Structural Smoothing (c) Xline Base without structural smoothing and (d) Xline Base without structural smoothing.
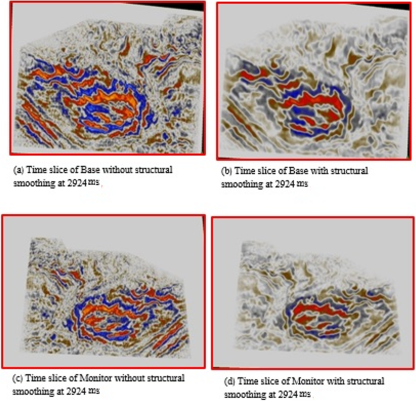
Figure 13. Time Axis of the Seismic Data for both Base and Monitor without Structural Smoothing and the Application of Structural Smoothing Respectively.
4.4.9. Ant-Attributes
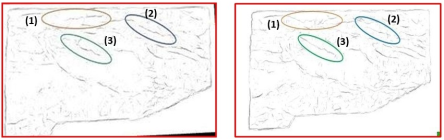
The Subtle faults delineation from Ant Attributes.
(a) Base Map (b) Monitor Map

Download: Download full-size image

Figure 14. Shows Ant attributes at 2248 seconds for both base and monitor delineating subtle faults respectively.
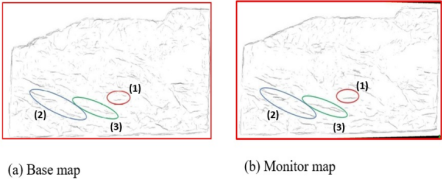
In this study, the seismic data used was carefully conditioned using structural smoothing to remove residual background noise and to improve the spatial continuity of seismic signal (Figures 11-13). Then, variance attributes (Figure 9) which is sensitive to faults was applied to the seismic data set; and the outputs from these processes was used as our input data to run the ant attribute (Figures 14-16) with which the faults were clearly seen that were difficult to display on the raw seismic data set. The results obtained from the ant attribute monitor volume indicate that the subtle faults seen in the base volume are fractured, reactivated in the monitor volume due to fluid production. The Ant Tracker Attribute indeed enhances faults and fractures in 3D data set.
Figure 15. Ant attribute at 2536 seconds for both base and monitor delineating subtle faults.
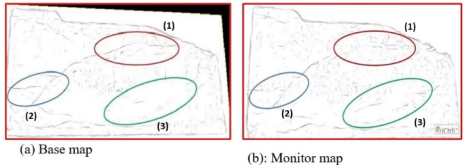
Figure 16. Shows Ant attribute at 2000 seconds for both base and monitor delineating subtle faults respectively.
4.5. Determination of Acoustic Impedance from Monitor Seismic Data
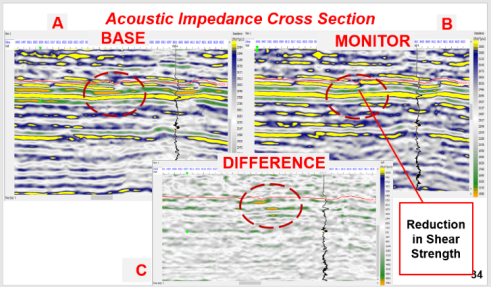
Acoustic impedance is used to understand the subsurface geology and identifying potential reservoirs. Also, to predict rock properties, such as porosity and fluid saturation. The changes in acoustic impedance were used to indicate changes in rock properties or lithology as a result of hydrocarbon production induced stress change. Figure 18 shows acoustic impedance maps for SAND 2. There is a low acoustic impedance in the base map indicating hydrocarbon zone. As production continuous a reduction in Shear Strength of the rocks surrounding the reservoir in the monitor vintage was observed resulting to fracture.
Figure 17. Acoustic impedance slice for (A) Base (B) Monitor and (C) difference volume.
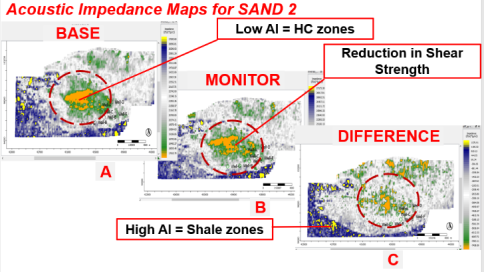
Figure 18. Acoustic Impedance Map for (A) Base (B) Monitor and (C) difference volume.
4.6. Determination of Geomechanical Properties from Monitor Seismic Data
Geomechanical properties which included: elastic moduli [Young’s modulus and Poisson ratio (PR)] and rock mechanical strength properties (closure stress ratio (CSR) and brittleness (BRI)) were generated from the inversion analysis to understand the distribution of rock strength properties across the field.
4.6.1. The Poisson Ratio
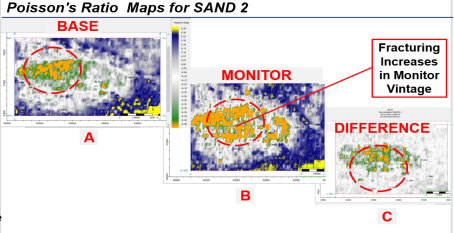
The poisson ratio measures the change in dimensions perpendicular to a compressional or tensile stress (i.e. how wide a body gets when compressed or how thin it gets when stretched). The smaller the Poisson's ratio, the smaller the horizontal stress and the easier it is to fracture the rock. A change in this ratio can indicate a change in the pore fluid. Figure 19 shows poisson’s ratio map for sand 2. There is an increase in fracture in the monitor vintage than the base map. This is an indication of induced stress change in a reservoir due to hydrocarbon production.
Figure 19. Poisson's Ratio Map for (A) Base (B) Monitor and (C) difference volume.
4.6.2. The Young’s Modulus
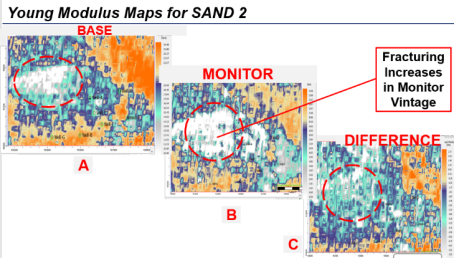
Young’s Modulus, also called the elastic modulus, measures the stiffness of elastic material through the ratio of stress and strain. High values indicate rigidity. Generally, the higher the E, the more brittle the rock. Figure 20 shows young modulus (elastic modulus) map for sand 2. There is an increase in fracture in the monitor vintage than the base map which indicate that the rocks surrounding the reservoir is brittle. Therefore, as production continuous, pore pressure deplets with a constant overburden pressure resulting to more fractures.
Figure 20. Young Modulus Map for (A) Base (B) Monitor and (C) difference volume.
4.6.3. Closure Stress Ratio (CSR)
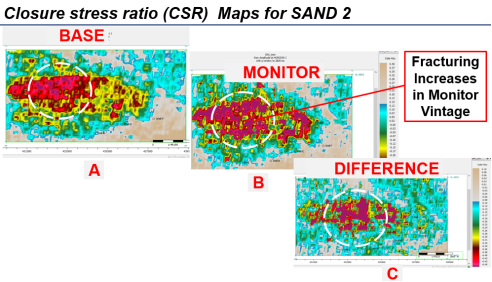
The Closure stress ratio (CSR) is the degree of pressure at which fracture closes after the fracturing pressure is relaxed. Rocks with high closure stress are basically harder to fracture than rocks with lower closure stress. Figure 21 shows closure stress ratio (CSR) maps for SAND 2. There is an increase in fracture in the monitor vintage than the base map which indicate that the rocks surrounding the reservoir is brittle. Because the closure stress ratio was very low resulting to more fracture at constant overburden pressure due to production effect.
Figure 21. Closure stress ratio (CSR) Map for (A) Base (B) Monitor and (C) difference volume.
4.6.4. Determination of Effective Pressure
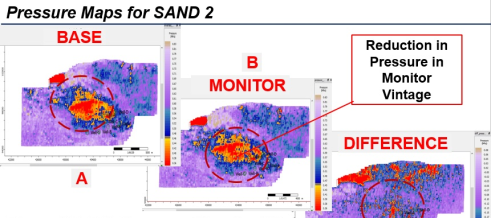
The Eaton method was used to estimates pore pressure from the ratio of acoustic travel time (Δt) in normally compacted sediments to the observed acoustic travel time. The result reveals a reduction in pressure in the monitor vintage due to fluid production.
Figure 22. Effective Pressure Map for (A) Base (B) Monitor and (C) difference volume.
4.7. Production and Pressure Data
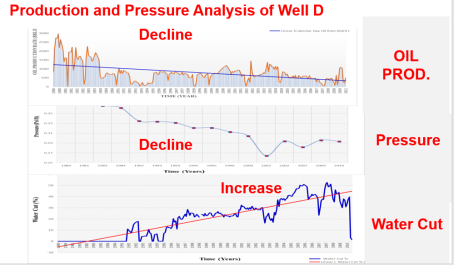
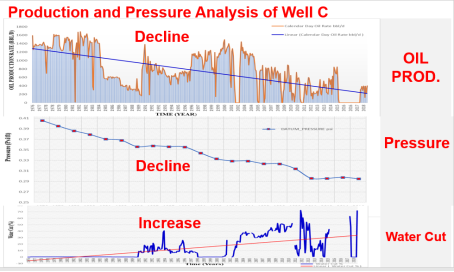
The Production data and Pressure data were obtained from Shell Petroleum Development Company (SPDC), Port Harcourt Office as shown in Table 6. Production and pressure data is a routine dynamic monitoring of reservoir development. The data were used to monitor mostly fluid production flow rates of individual wells and the effect on pressure; the reservoir's overall flow rate and the cumulative production of each fluid produced from the reservoir over time and its effects on pressure. The gas-oil ratio and water cut were also monitored. In Table 7, pressure decline was observed as Oil production days increases. The result obtained from well C and Well D shows pressure and oil production rate decline, as oil production days and water cut increases. This could be as a result of loss of porosity and permeability or rock displacement and fractured caused by overburden pressure from overlying rocks, which validates the induced-stress change in the reservoir rock due to fluid production.
Figure 23. Production and Pressure Analysis of Well C.

.
Table 6. Reservoir Pressure History in study Field.

DAYS Oil Production (Days)

Reservoir Pressure (psi)

1

4766

603

4645

974

4538

1372

4456

1988

4355

2631

4325

3921

4184

4016

4201

4324

4184

4709

4175

5991

4043

6652

3914

6924

3864

7256

3804

7502

3798

8100

3690

12872

3478

13312

3474

13884

3498

14576

3467

Table 7. Oil Production Rate for Well C in the study Field.

Days

Calendar Day Oil Rate (bbl/d)

1

1592.55

30

1254.68

60

1348.97

90

1334.00

120

1389.77

150

1378.35

180

1346.58

210

1354.18

240

1349.00

270

1366.33

300

1386.00

330

1375.47

360

1371.81

390

1347.81

420

1402.00

450

1437.94

480

1385.70

510

1345.68

540

970.84

570

695.68

600

1347.65

630

1330.37

660

1284.00

690

1304.30

720

1317.42

750

1300.81

780

1284.83

810

1288.58

840

1370.20

870

1624.35

900

1562.71

930

1578.71

960

1610.71

990

1578.93

1020

1595.29

1050

1601.47

1080

1599.32

1110

1351.03

1140

1283.37

1170

1244.10

1200

1230.70

1230

1235.58

1260

1268.16

5. Conclusion
Hydrocarbon Production induced-stress change in Reservoirs have been successfully carried out using seismic data and well log data in Kolo-Creek Oil Field in the Coastal Swamp Niger Delta, Nigeria to evaluate production induced-stress on a producing reservoir. Three zones of interest (Sand A, Sand B and Sand C) were delineated and correlated across all seven wells. The litho-stratigraphy correlation section revealed that each of the sand units spreads over the field and differs in thickness with some units occurring at greater depth than their adjacent unit that is possibly evidence of faulting. The petrophysical parameters calculated include total/effective porosity, water/hydrocarbon saturation, permeability, net-to-gross and volume of shale. Also, seismic attributes like coherence variance and ant tracker attributes were interpreted.
The Days of Oil Production data versus Reservoir Pressure data were obtained from Shell Petroleum Development Company (SPDC), Port Harcourt Office as shows a pressure decline and oil production rate as oil production days increases. This could be as a result of loss of porosity and permeability or rock displacement and fractured caused by overburden pressure from overlying rocks, which validates the induced-stress change in the reservoir rock as a production effects. The geomechanical interpretation reveals rock deformation and displacement inside reservoir as a result of pore fluid depletion and increasing overburden and also, structural interpretation reveals that the subtle faults seen in the base volume are fractured, some fault re-activated in the monitor volume resulting to pressure depletion, loss of porosity, permeability and change in stress and strain in the overburden reservoir. The results of this work can be used as a tool for monitoring oil production pressure and oil production rate per day of a producing reservoir life. This study also has proven that the evaluating hydrocarbon production induced-stress change in a reservoir is key factor for effective productivity of hydrocarbons.
Abbreviations

Vp

Shear Wave Velocity

Vs

Compressional Wave Velocity

GR

Gamma Ray

SP

Spontaneous Potential

Gamma Ray Index

Gamma Ray Reading from Log

Minimum Reading of Gamma Ray Log

Maximum Gamma Ray Reading

SW

Water Saturation

a

Tortuosity Factor

m

Cementation Factor

n

Saturation Exponent

Φ

Porosity of the Formation

Rt

Deep Resistivity of the Formation

Total Porosity

Density of the Rock Matrix

Bulk Density Read Directly from the Log

Fluid Density

Effective Porosity

Total Porosity of Shale

Volume of Shale

H

Gross Reservoir Thickness

h

Net Reservoir Thickness

hshale

Shale Thickness

Irreducible Water Saturation

Formation Factor

Porosity

K

Permeability

TDR

Time Depth Relationship

V(z)

the Instantaneous Velocity

Z

Depth

Vo(m/s)

the Top-interface Velocity

K(s1)

the Velocity Gradient or Compaction Factor

ρ

Density of the Rock

V

Velocity of the Seismic Wave

PR

Poisson Ratio

CSR

Closure Stress Ratio (CSR)

BRI

Brittleness

E

Young’s Modulus

SPDC

Shell Petroleum Development Company

Acknowledgments
The authors are thankful to Nigeria National Petroleum Company (NNPC) for the permission given to us to obtain data from The Shell Petroleum Development Company (SPDC) Nigeria Limited.
Author Contributions
Orji Chinedu Stephen: Conceptualization, Data curation, Writing – original draft, Writing – review & editing
Tamunobereton-ari Iyenomie: Supervision, Validation
Amakiri Arobo Raymond Chinoye: Supervision, Validation, Visualization
Amonieah Jiriwari: Supervision, Validation
Conflicts of Interest
The authors declare that there are no conflicts of interest in the execution of this study.
References
[1] Archie, G. E. (1942). The Electrical Resistivity Log as an aid in Determining Some Reservoir Characteristics. Transactions of the AIME, 146(1): 54–62.
[2] Ajibola O. Owoyemi and Brian J. Willis (2006). Depositional Patterns Across Syndepositional Normal Faults, Niger Delta, Nigeria. Journal of Sedimentary Research Vol. 76, Issue 2, pp. 346-363.
[3] Asquith, G. B and Gibson, C. R (1982). Basic Well Log Analysis for Geologists. American Association of Petroleum Geologists (AAPG), (1982). Volume 5 AAPG methods in exploration series.
[4] Cobb, W. M. and Marek, F. J. (1998). Net Pay Determination for Primary and Waterflood Depletion Mechanisms. Presented at the (SPE) - PetroWiki Annual Technical Conference and Exhibition, New Orleans, Louisianna, 27–30 September. SPE-48952-MS.
[5] Cook, C. C. and Jewel, S. (1996). Simulation of a North Sea field experiencing significant compaction drive SPE Reservoir Engineering, Journal Name: SPE Reservoir Engineering Journal Issue: 1 Vol. 11.
[6] Eaton, B. A (1975) “The Equation for Geopressure Prediction from Well Logs”. Society of Petroleum Engineers (SPE) 11 (5), 149-158.
[7] Ejedawe, J. E. (1981). Patterns of Incidence of Oil Reserves in Niger Delta Basin: American Association of Petroleum Geologists, 65(9), 1574-1585.
[8] Ghaderi, O. I., Landrø, B and Lie, J. E. (2012). Time-lapse seismic monitoring of a compacting reservoir – a case study of the Njord Field, (Geophysical Prospecting, 2012, Vol. 60, Issue 2, pp. 329–344).
[9] Hatchell P. J and Bourne. S. (2005). Rocks under strain: Strain-induced time-lapse time shifts are observed for depleting reservoirs. Journal: The Leading Edge (Tulsa, OK) Geophysics. Vol. 24, pp. 1222-1225.
[10] Law, A., Snyder, D. B., and Singh, S. C. (1995). Determination of Poisson's ratio from pre-critical wide-angle seismic reflection data from the BABEL project. Geophysical Journal International, *122*(1), 16–32.
[11] Larionov, V. V. (1969) Borehole Radiometry Moscow, U. S. S. R. In: Nedra, M. R. L. and Biggs, W. P., Eds., Using Log-Derived Values of Water Saturation and Porosity, Trans. SPWLA Ann. Logging Symp. Paper, 10, 26.
[12] Ngeri, A. P.; Tamunobereton-ari, I., and Amakiri, A. R. C. (2015). Ant-Tracker Attributes: An Effective Approach To Enhancing Fault Identification And Interpretation IOSR Journal of VLSI and Signal Processing (IOSR-JVSP) Volume 5, Issue 6, Ver. II. PP 67-73.
[13] Oboh, F. E. (1993). Depositional History of the E2. 0 Reservoir in the Kolo Creek Field, Niger Delta. Journal of Petroleum Geology, 16(2), 197-212.
[14] Røste, T (2007). Monitoring Overburden and Reservoir Changes from Prestack Time-Lapse Seismic Data: Applications to Chalk Fields. Norwegian University of Science and Technology (NTNU). Doktoravhandlinger ved NTNU, 2007: 37.
[15] Roy O. Lindseth (1979) Synthetic Sonic Logs—A Process for Stratigraphic Interpretation (SPE) – PetroWiki Vol. 44(1) page 3-26.
[16] Russell, B. and Hampson, D. (2005). Geomechnical Modeling techniques and Application. Society of Exploration Geophysists.
[17] Timur, A. (1968). An Investigation of Permeability, Porosity & Residual Water Saturation Relationships for Sandstone Reservoirs. The Log Analyst, Vol. 9, No. 4.
[18] White, W. A. and Tremblay, T. A. (1995). Submergence of Wetlands as a Result of Human-Induced Subsidence and Faulting along the Upper Texas Gulf coast. Journal of Coastal Research, V. 11, 788-807.
[19] Wyllie, M., Gregory, A. and Gardner, G. (1958). An Experimental Investigation of Factors Affecting Elastic Wave Velocities in Porous Media. Geophysics, 23 (3), 459-493.
[20] Zoback, M. D. (2007). Reservoir geomechanics. Cambridge University Press.
Cite This Article
  • APA Style

    Stephen, O. C., Iyenomie, T., Chinoye, A. A. R., Jiriwari, A. (2026). Geomechanical and Structural Investigations of Production-Induced Stress Changes in Reservoir Sands in Part of Niger Delta Nigeria. Petroleum Science and Engineering, 10(2), 63-84. https://doi.org/10.11648/j.pse.20261002.11

    Copy | Download

    ACS Style

    Stephen, O. C.; Iyenomie, T.; Chinoye, A. A. R.; Jiriwari, A. Geomechanical and Structural Investigations of Production-Induced Stress Changes in Reservoir Sands in Part of Niger Delta Nigeria. Pet. Sci. Eng. 2026, 10(2), 63-84. doi: 10.11648/j.pse.20261002.11

    Copy | Download

    AMA Style

    Stephen OC, Iyenomie T, Chinoye AAR, Jiriwari A. Geomechanical and Structural Investigations of Production-Induced Stress Changes in Reservoir Sands in Part of Niger Delta Nigeria. Pet Sci Eng. 2026;10(2):63-84. doi: 10.11648/j.pse.20261002.11

    Copy | Download

  • @article{10.11648/j.pse.20261002.11,
      author = {Orji Chinedu Stephen and Tamunobereton-ari Iyenomie and Amakiri Arobo Raymond Chinoye and Amonieah Jiriwari},
      title = {Geomechanical and Structural Investigations of Production-Induced Stress Changes in Reservoir Sands in Part of Niger Delta Nigeria},
      journal = {Petroleum Science and Engineering},
      volume = {10},
      number = {2},
      pages = {63-84},
      doi = {10.11648/j.pse.20261002.11},
      url = {https://doi.org/10.11648/j.pse.20261002.11},
      eprint = {https://article.sciencepublishinggroup.com/pdf/10.11648.j.pse.20261002.11},
      abstract = {Hydrocarbon production reduces pore-fluid pressure and increases the effective stress acting on the grain framework of reservoir rocks. This process induces reservoir deformation, compaction, and stress redistribution, often manifesting as fault reactivation, surface subsidence, wellbore instability, and 4D seismic time shifts. In this study, we present a geomechanical and structural interpretation of production-induced stress changes in the Kolo-Creek Field, Coastal Swamp Niger Delta, Nigeria. The analysis integrates 3D seismic interpretation, geomechanical evaluation, well-log analysis, and production data. Time-lapse seismic surveys acquired in 1997 (base) and 2009 (monitor) show clear 4D responses with a root-mean-square repeatability ratio (RRR) of 0.38, indicating excellent survey repeatability. The seismic interpretation reveals fault reactivation and fracturing associated with production-induced stress changes. Geophysical well logs from seven wells were used to delineate and correlate three reservoir zones (Sand A, Sand B, and Sand C). Petrophysical analysis indicates low shale content ranging from 7.74–37.44%, high porosity values between 0.19 and 0.36), and excellent permeability varying from 375–3327 mD, which is consistent with high-quality, coarse-grained sandstones. Production and pressure data provided by SPDC show a decline from 1592.55 to 400.34 bbl/day and from 4766 to 3103 psi over 12 years, respectively, corroborating with the geomechanical interpretation. The integration of geomechanics with seismic and structural analysis demonstrates the influence of reservoir stress changes on fault behavior and reservoir performance, providing insights to optimize production and manage risks in similar deltaic settings. This study could lead to Wellbore Stability Management; Using stress change predictions to guide well placement and drilling orientation, minimizing risks of shear failure, casing deformation, and production losses.},
     year = {2026}
    }
    

    Copy | Download

  • TY  - JOUR
    T1  - Geomechanical and Structural Investigations of Production-Induced Stress Changes in Reservoir Sands in Part of Niger Delta Nigeria
    AU  - Orji Chinedu Stephen
    AU  - Tamunobereton-ari Iyenomie
    AU  - Amakiri Arobo Raymond Chinoye
    AU  - Amonieah Jiriwari
    Y1  - 2026/07/11
    PY  - 2026
    N1  - https://doi.org/10.11648/j.pse.20261002.11
    DO  - 10.11648/j.pse.20261002.11
    T2  - Petroleum Science and Engineering
    JF  - Petroleum Science and Engineering
    JO  - Petroleum Science and Engineering
    SP  - 63
    EP  - 84
    PB  - Science Publishing Group
    SN  - 2640-4516
    UR  - https://doi.org/10.11648/j.pse.20261002.11
    AB  - Hydrocarbon production reduces pore-fluid pressure and increases the effective stress acting on the grain framework of reservoir rocks. This process induces reservoir deformation, compaction, and stress redistribution, often manifesting as fault reactivation, surface subsidence, wellbore instability, and 4D seismic time shifts. In this study, we present a geomechanical and structural interpretation of production-induced stress changes in the Kolo-Creek Field, Coastal Swamp Niger Delta, Nigeria. The analysis integrates 3D seismic interpretation, geomechanical evaluation, well-log analysis, and production data. Time-lapse seismic surveys acquired in 1997 (base) and 2009 (monitor) show clear 4D responses with a root-mean-square repeatability ratio (RRR) of 0.38, indicating excellent survey repeatability. The seismic interpretation reveals fault reactivation and fracturing associated with production-induced stress changes. Geophysical well logs from seven wells were used to delineate and correlate three reservoir zones (Sand A, Sand B, and Sand C). Petrophysical analysis indicates low shale content ranging from 7.74–37.44%, high porosity values between 0.19 and 0.36), and excellent permeability varying from 375–3327 mD, which is consistent with high-quality, coarse-grained sandstones. Production and pressure data provided by SPDC show a decline from 1592.55 to 400.34 bbl/day and from 4766 to 3103 psi over 12 years, respectively, corroborating with the geomechanical interpretation. The integration of geomechanics with seismic and structural analysis demonstrates the influence of reservoir stress changes on fault behavior and reservoir performance, providing insights to optimize production and manage risks in similar deltaic settings. This study could lead to Wellbore Stability Management; Using stress change predictions to guide well placement and drilling orientation, minimizing risks of shear failure, casing deformation, and production losses.
    VL  - 10
    IS  - 2
    ER  - 

    Copy | Download

Author Information
  • Abstract
  • Keywords
  • Document Sections

    1. 1. Introduction
    2. 2. Location and Geology of the Study Area
    3. 3. Materials and Methods
    4. 4. Results and Discussion
    5. 5. Conclusion
    Show Full Outline
  • Abbreviations
  • Acknowledgments
  • Author Contributions
  • Conflicts of Interest
  • References
  • Cite This Article
  • Author Information