Recent joint efforts led by the international financial corporation (IFC) with strong support from the Federal Government of Nigeria and various industrial and policy stakeholders has produced the Nigerian CO2 Storage Atlas, sorting prospective geological storage sites. However, the storage efficiency factors applied to the estimated resource capacity to provide low, medium and high resource estimations may not be a true representation for the underground CO2 storage space, especially for depleted hydrocarbon reservoirs, in the Nigeria rich oil province that is very porous and permeable. We therefore present assessment of CO2 storage potential of some depleted hydrocarbon reservoirs in the Niger Delta, derive specific approximate CO2 Storage efficiency factors for these reservoirs, and develop a model for determining site-specific CO2 storage efficiency factor. Comparison of results from various approaches – production-based, volumetric- based with varying CO2 storage efficiency factors obtained from the new model and previous works, and an enhanced analytical simulation tool (EASiTool) was also carried out. The newly developed model for determining site-specific CO2 storage efficiency factor can help improve the predictive capability of the volumetric method for CO2 storage potential estimates, especially for depleted oil reservoirs in the Niger Delta.
| Published in | Petroleum Science and Engineering (Volume 10, Issue 1) |
| DOI | 10.11648/j.pse.20261001.15 |
| Page(s) | 51-62 |
| Creative Commons |
This is an Open Access article, distributed under the terms of the Creative Commons Attribution 4.0 International License (http://creativecommons.org/licenses/by/4.0/), which permits unrestricted use, distribution and reproduction in any medium or format, provided the original work is properly cited. |
| Copyright |
Copyright © The Author(s), 2026. Published by Science Publishing Group |
CO2 Storage Efficiency Factor, CO2 Storage Resources, Nigerian CO2 Storage Atlas, CO2 Storage Estimates, Geological Storage
Parameters | Min. value | Max. value | Mean | Standard deviation | Variance |
|---|---|---|---|---|---|
Porosity (%) | 15 | 35 | 26.1 | 4.08 | 16.62 |
Water saturation (%) | 5.0 | 40.0 | 24.6 | 10.80 | 116.63 |
Oil formation volume factor (rb/stb) | 1.08 | 6.27 | 1.47 | 273.40 | 74748.03 |
Gas cap, m-factor | 0.01 | 4.73 | 0.66 | 0.8387 | 0.70 |
Area (acres) | 19.66 | 64593.74 | 856.64 | 5131 | 26327160 |
Average net pay (ft) | 10 | 524 | 58.53 | 47.92 | 2296.18 |
Temperature (oF) | 125 | 240 | 175.20 | 25.39 | 644.80 |
(Oil up to (OUT) pressure (psi) | 2148 | 5984 | 3717.40 | 715.06 | 511308.79 |
OUT depth (ft) | 4930 | 13017 | 8486.15 | 1584.95 | 2512061.73 |
Rsi (scf/bbl) | 76 | 6234 | 925.76 | 593.31 | 352021.17 |
Permeability (mD) | 3.36 | 18225 | 797.97 | 1439.87 | 2073213.4 |
OIP (MMstb) | 0.9 | 158.4 | 21.3 | 24.9880 | 624.4042 |
|
|
|
|
|
|---|---|---|---|---|
-2.17 | 5.95 | -2.36 | -9.61 | 3.37 |
Res. | Average porosity (%) | Res. Net height (ft) | Water Sat.% | Perm., (mD) | Res. Area (Acre) | Prospective CO2 Storage Volume (Million tonnes) | ||||||
|---|---|---|---|---|---|---|---|---|---|---|---|---|
Prod. Based | Site specific EF% | EASiTool | EF, New model | EF, 0.5% | EF, 2% | EF, 5.4% | ||||||
1 | 23.0 | 80 | 17.0 | 422 | 30.5 | 0.0895 | 0.01828 | 0.0052 | 0.0283 | 0.0012 | 0.0050 | 0.0136 |
2 | 35.0 | 27 | 15.0 | 845 | 59.4 | 0.0512 | 0.01047 | 0.00044 | 0.0459 | 0.0012 | 0.0051 | 0.0140 |
3 | 19.0 | 18 | 37.0 | 215 | 179.0 | 0.0618 | 0.01264 | 0.00031 | 0.0143 | 0.0010 | 0.0041 | 0.0113 |
4 | 19.0 | 12 | 36.0 | 218 | 292.7 | 0.0732 | 0.01496 | 0.00143 | 0.0118 | 0.0011 | 0.0046 | 0.0125 |
5 | 25.0 | 32 | 25.0 | 395 | 94.1 | 0.0206 | 0.00422 | 0.00151 | 0.0195 | 0.0015 | 0.0061 | 0.0165 |
6 | 22.0 | 61 | 13.0 | 452 | 34.3 | 0.1951 | 0.03987 | 0.00101 | 0.0310 | 0.0010 | 0.0043 | 0.0117 |
AGD | Average Global Database |
CCS | Carbon Capture, and Storage |
CCUS | Carbon Capture, Utilization, and Storage |
CSLF | Carbon Sequestration Leadership Forum |
CO2 | Carbon IV Oxide |
DOE-NETL | U.S. Department of Energy’s National Energy Technology Laboratory |
EASiTool | Enhanced Analytical Simulation Tool |
| CO2 Storage Efficiency Factor |
EU | European Union |
GOM | Gulf of Mexico |
IFC | International Financial Corporation |
Mt | Million Tonnes |
NUPRC | Nigeria Upstream Petroleum Regulatory Commission |
OGIP | Original Gas in Place |
OOIP | Original Oil in Place |
ODT | Oil Down to |
OUT | Oil Up to |
TORIS | Tertiary Oil Recovery Information System |
UAE | United Arab Emirate |
USA | United State of America |
USGS | United States Geological Survey |
US-DOE | U.S. Department of Energy |
OIIP EXP | Av. Np | Poro% | Water Sat% | Avg H, ft | ODT ftss | ODT psi | Boi v/v | Res. T, oF | API | Perm, mD | A, Acres |
|---|---|---|---|---|---|---|---|---|---|---|---|
8.90 | 2.50 | 23.00 | 17.00 | 80.00 | 10510.00 | 4576.00 | 1.77 | 218.00 | 34.97 | 423.00 | 30.53 |
25.37 | 0.36 | 35.00 | 15.00 | 27.00 | 6602.00 | 2883.00 | 1.19 | 144.00 | 22.30 | 845.33 | 59.48 |
5.67 | 0.21 | 19.00 | 37.00 | 18.00 | 9142.00 | 3974.00 | 1.77 | 196.00 | 45.38 | 215.28 | 179.06 |
3.90 | 1.29 | 19.00 | 36.00 | 12.00 | 9998.00 | 4340.00 | 1.96 | 212.00 | 45.38 | 218.25 | 292.78 |
0.90 | 0.27 | 25.00 | 25.00 | 32.00 | 8566.00 | 3751.00 | 1.97 | 182.00 | 39.19 | 395.28 | 94.17 |
6.50 | 1.05 | 22.00 | 13.00 | 61.00 | 9199.00 | 4200.00 | 1.59 | 190.00 | 40.85 | 452.51 | 34.35 |
112.70 | 0.60 | 27.00 | 24.00 | 40.00 | 6590.00 | 2880.00 | 1.14 | 125.00 | 17.76 | 452.80 | 42.91 |
95.00 | 1.74 | 28.00 | 21.00 | 20.00 | 6657.00 | 2910.00 | 1.14 | 126.00 | 18.55 | 511.21 | 82.41 |
14.80 | 0.09 | 26.00 | 30.00 | 31.00 | 8082.00 | 3530.00 | 1.24 | 155.00 | 28.93 | 382.71 | 65.34 |
15.00 | 0.18 | 26.00 | 42.00 | 8.00 | 8083.00 | 3530.00 | 1.20 | 155.00 | 26.60 | 323.45 | 297.68 |
24.10 | 3.31 | 31.00 | 11.00 | 26.00 | 8330.00 | 3640.00 | 1.26 | 160.00 | 29.48 | 822.84 | 62.37 |
68.50 | 4.97 | 28.00 | 21.00 | 42.00 | 8820.00 | 3926.00 | 1.50 | 168.00 | 36.15 | 511.21 | 51.86 |
5.40 | 3.43 | 29.00 | 20.00 | 50.00 | 7669.00 | 3365.00 | 1.17 | 142.00 | 23.65 | 552.14 | 33.61 |
7.10 | 0.25 | 27.00 | 26.00 | 22.00 | 7454.00 | 3248.00 | 1.35 | 174.00 | 25.72 | 435.04 | 95.27 |
5.10 | 0.31 | 27.00 | 26.00 | 25.00 | 7454.00 | 3248.00 | 1.24 | 174.00 | 25.72 | 435.04 | 76.96 |
41.40 | 0.32 | 23.00 | 16.00 | 110.00 | 7972.00 | 3474.00 | 1.33 | 182.00 | 29.30 | 436.02 | 16.50 |
17.10 | 0.82 | 26.00 | 20.00 | 24.00 | 8776.00 | 3824.00 | 1.51 | 184.00 | 36.15 | 468.72 | 90.40 |
39.90 | 2.57 | 24.00 | 20.00 | 100.00 | 8945.00 | 3898.00 | 1.58 | 201.00 | 34.97 | 415.69 | 22.60 |
4.10 | 2.62 | 22.00 | 19.00 | 88.00 | 9858.00 | 4278.00 | 1.68 | 220.00 | 35.96 | 374.31 | 27.02 |
4.60 | 1.10 | 22.00 | 19.00 | 27.00 | 9858.00 | 4278.00 | 1.68 | 220.00 | 35.96 | 374.31 | 88.07 |
16.20 | 3.51 | 26.00 | 10.00 | 90.00 | 10908.00 | 4734.00 | 1.53 | 221.00 | 30.77 | 662.87 | 21.64 |
2.20 | 1.91 | 26.00 | 10.00 | 30.00 | 10099.00 | 4420.00 | 1.71 | 220.00 | 35.36 | 662.87 | 72.49 |
| [1] | Adeoti, L., Ojo, A. A., Olatinsu, O. B., Fasakin, O. O. and Adesanya, O. Y. (2015). Comparative analysis of hydrocarbon potential in shaly sand reservoirs using archie and simandoux models: a case study of “x” field, Niger delta, Nigeria. Ife Journal of Science 17(1): 15-28. |
| [2] | Bachu, S., Bonijoly, D., Bradshaw, J., Burruss, R., Holloway, S., Christensen, N. P., Mathiassen, O. M., (2007). CO2 storage capacity estimation: methodology and gaps. Int. J. Greenhouse Gas Control 1, 430–443. |
| [3] | Bowker, K. A., Shuler, P. J., (1991). Carbon dioxide injection and resultant alteration of the Weber Sandstone, Rangely Field, Colorado. Am. Assoc. Pet. Geol. Bull. 75, 1489–1499. |
| [4] |
Budinis, S., Fajardy, M., Greenfield, C., (2023). Carbon Capture, Utilisation and Storage. The IEA. URL.
https://www.iea.org/energy-system/carbon-capture-utilisation-and-storage |
| [5] | Chudi, O., Lewis, H., Stow, D., and Buckman, J. (2016). Reservoir Quality Prediction of Deep-Water Oligocene Sandstones from the West Niger Delta by Integrating Petrological, Petrophysical and Basin Modeling. Geological Society of London Special Publications 435: 245-264. |
| [6] | Cantucci B, Buttinelli M, Procesi M, Sciarra A, Anselmi M (2016). Algorithms for CO2 Storage Capacity Estimation: Review and Case Study. In: Vishal V, et al. (Eds.), Geologic Carbon Sequestration. Springer Cham, pp: 21-44. |
| [7] | CSLF - Carbon Sequestration Leadership Forum, (2007). Estimation of CO2 storage capacity in geological media, June 2007. |
| [8] |
Daniels, J., (2022). Ambition Must Now Translate to Urgent, Broad, and Large-Scale Action if we Are to Maintain a Livable Climate [WWW Document]. Global CSS Institute. URL.
https://status22.globalccsinstitute.com/2022-status-report/global-status-of-ccs/ |
| [9] | Devore, J. L., (2004). Probability and Statistic for Engineering and the Sciences, 6th ed. Brooks/Cole-Thomson Learning, Belmont, CA. |
| [10] | DOE-NETL (U.S. Department of Energy – National Energy Technology Labora tory – Office of Fossil Energy), (2006). Carbon Sequestration Atlas of the United States and Canada. |
| [11] | DOE-NETL (U.S. Department of Energy – National Energy Technology Laboratory – Office of Fossil Energy), (2008). Carbon Sequestration Atlas of the United States and Canada, 2nd ed. |
| [12] | Farajzadeh, R., Eftekhari, A. A., Dafnomilis, G., Lake, L. W., Bruining, J., (2020). On the sustainability of CO2 storage through CO2–Enhanced oil recovery. Appl. Energy 261, 114467. |
| [13] | Ganjdanesh, R. and Hosseini, S. A. (2017). Geologic Carbon Storage Capacity Estimation Using Enhanced Analytical Simulation Tool (EASiTool). Energy Procedia 114 (2017) 4690–4696; |
| [14] | Global CCS Institute. Global Status of CCS 2023. GCCSI. 2023. |
| [15] | Goodman, A., Hakala, A., Bromhal, G., Deel, D., Rodosta, T., Frailey, S., Small, M., Allen, D., Romanov, V., Fazio, J., Huerta, N., Mclntyre, D., Kutchko, B., and Guthrie, G. (2011). U.S. DOE Methodology for the Development of Geologic Storage Potential for Carbon Dioxide at the National and Regional Scale. International Journal of Greenhouse Gas Control 5(4): 952 - 965. |
| [16] |
Greenfield, C., Budunis S., Fajardy, M., (2024). CO2 Transport and Storage - Energy System.
https://www.iea.org/energy-system/carbon-capture-utilisation-and-storage/co2-transportandstorage |
| [17] | Hosseininoosheri, P., Hosseini, S. A., Nunez-Lopez, V., Lake, L. W., (2018). Impact of field development strategies on CO2 trapping mechanisms in a CO2–EOR field: a case study in the permian basin (SACROC unit). Int. J. Greenhouse Gas Control 72, 92–104. |
| [18] | Ighomuaye E., Dudun A., Boukadi F., and Osumanu J. (2024). Comparative Study of CO2 Storage Capacity Estimation in Depleted Oil & Gas Reservoir: A Case Study in Vermillion Basin Gulf of Mexico. Pet Petro Chem Eng J 2024, 8(1): 000379. |
| [19] | IEA Greenhouse Gas R&D Programme (IEA GHG). Development of Storage Coefficients for CO2 Storage in Deep Saline Formations., 2009/13, October 2009. |
| [20] | International Financial corporation (IFC) – World Bank Group, Nigerian CO2 Storage Atlas, March 2025, |
| [21] | Jonas, T. M., Chou, S. I., Vasicek, S. L., (1990). Evaluation of a CO2 foam field trial: rangely weber sand unit. In: All Days. SPE. |
| [22] | Kalam, S., Olayiwola, T., Al-Rubaii, M. M., Amaechi, B. I., Jamal, M. S., Awotunde, A. A., (2021). Carbon dioxide sequestration in underground formations: review of experimental, modeling, and field studies. J. Petrol. Explor. Prod. 11, 303–325. |
| [23] | Kongsjorden, H., Kårstad, O., Torp, T. A., (1998). Saline aquifer storage of carbon dioxide in the Sleipner project. Waste Manag. 17, 303–308. |
| [24] | Mustafar, I. B. and Razali, R. (2011). A Study on Prediction of Output in Oilfield Using Multiple Linear Regression. International Journal of Applied Science and Technology, 1(4): 107-113. |
| [25] | NETL. Carbon Storage Atlas 5th Edition, Atlas V. (United States, 2015). |
| [26] | Obah B., Livinus A., Ezugwu C. (2012) Simplified Models for Forecasting Oil Production Niger Delta Oil Rim Reservoirs Case. Petroleum Technology Development Journal 2(2): 1-12. |
| [27] | Okpogo, E., Abbey, C., and Atueyi, I. (2018). Reservoir Characterization and Volumetric Estimation of Orok Field, Niger Delta Hydrocarbon Province. Egyptian Journal of Petroleum 27(4): 1087-1094. |
| [28] | Omeke J., Livinus A., Uche I. N., Obah B., Ekeoma, E. (2010). A Proposed Cone Breakthrough Time for Horizontal Wells in Thin Oil Rim Reservoirs. Paper SPE 140743 presented at the 43rd SPE Nigeria Annual International Conference and Exhibition, Tinapa - Calabar, Nigeria, July 2010. |
| [29] | Omoboriowo, A. O., Chiaghanam, O. I., Chiadikobi, K. C., Oluwajana, O. A., Soronnadi-Ononiwu C. G., Ideozu, R. U., (2012). Reservoir Characterization of KONGA Field, Onshore Niger Delta, Southern Nigeria. International Journal of Science and Emerging Technologies J 534 Sci. Emerging Tech Vol-3 No 1 IJSET, E-SSN: 2048-8688. |
| [30] | Ringrose, P. S., Mathieson, A. S., Wright, I. W., Selama, F., Hansen, O., Bissell, R., Saoula, N., Midgley, J. (2013). "The In Salah CO2 Storage Project: Lessons Learned and Knowledge Transfer". Energy Procedia. 37: 6226–6236. Bibcode: 2013EnPro.37.6226R. |
| [31] | Sengul, M., (2006). CO2 sequestration-a safe transition technology. Paper presented at the SPE International Health, Safety & Environment Conference, Abu Dhabi, UAE, April 2006. |
| [32] | Sharma, S., Cook, P., Berly, T., Lees, M., (2009). The CO2CRC Otway project: overcoming challenges from planning to execution of Australia’s first CCS project. Energy Procedia 1, 1965–1972. |
| [33] | Simon, F., 2023. EU sets World's First Target for Underground CO2 Storage Capacity. |
| [34] | Tomḉic, L., Karoviḉ-Mariḉiḉ, V., Daniloviḉ, D., Crnogorac, M., (2018). Criteria for CO2 storage in geological formations. Podzemni Radovi 61–74. |
| [35] | Tugwell K. W. and Livinus A. Predictive Models for Oil in Place for Oil Rim Reservoirs in the Niger Delta Using Machine Learning Approach. Pet Petro Chem Eng J 2023, 7(3): 000361. |
| [36] | Tuttle, M. L. W., Brownfield, M. E., and Charpentier, R. R., (1999). The Niger Delta Petroleum System. USGS Science for a changing world: Open File Report 99-50, 65 p. |
| [37] | Umar, B. A., Gholami, R., Nayak, P., Shah, A. A., and Adamu, H. (2020). Regional and Field Assessments of Potentials for Geological Storage of CO2: A Case Study of the Niger Delta Basin, Nigeria. Journal of Natural Gas Science and Engineering 77: 103-195. |
| [38] | Ukpong S. E., Livinus A. (2023) Application of a Simulation Approach to Develop Erosional Velocity Correlation for Wells in Oil Rim Reservoirs in the Niger Delta. SPE Nigeria Annual International Conference and Exhibition, Lagos, Nigeria, July 2023. |
| [39] | USGS. National assessment of geologic carbon dioxide storage resources: data. Report No. 774, 24 (Reston, VA, 2013). |
| [40] | Weaver, L. K., Anderson, K. F., (1966). Cranfield Field, Cranfield Unit, Basal Tuscaloosa Reservoir, Adams and Franklin Counties, Mississippi. |
| [41] | Yang, B., Shao, C., Hu, X., Ngata, M. R., Aminu, M. D., (2023). Advances in carbon dioxide storage projects: assessment and perspectives. Energy Fuel 37, 1757–1776. |
APA Style
Livinus, A., Obot, R. M., Eyo, A., Koffi, I. U., Etuk, V. E. (2026). Evaluation of CO2 Storage Potential of Some Depleted Hydrocarbon Reservoirs: Niger Delta Case Study. Petroleum Science and Engineering, 10(1), 51-62. https://doi.org/10.11648/j.pse.20261001.15
ACS Style
Livinus, A.; Obot, R. M.; Eyo, A.; Koffi, I. U.; Etuk, V. E. Evaluation of CO2 Storage Potential of Some Depleted Hydrocarbon Reservoirs: Niger Delta Case Study. Pet. Sci. Eng. 2026, 10(1), 51-62. doi: 10.11648/j.pse.20261001.15
@article{10.11648/j.pse.20261001.15,
  author = {Aniefiok Livinus and Raymond Mkpouto Obot and Antigha Eyo and Itoro Udofort Koffi and Victor E. Etuk},
  title = {Evaluation of CO2 Storage Potential of Some Depleted Hydrocarbon Reservoirs: Niger Delta Case Study},
  journal = {Petroleum Science and Engineering},
  volume = {10},
  number = {1},
  pages = {51-62},
  doi = {10.11648/j.pse.20261001.15},
  url = {https://doi.org/10.11648/j.pse.20261001.15},
  eprint = {https://article.sciencepublishinggroup.com/pdf/10.11648.j.pse.20261001.15},
  abstract = {Recent joint efforts led by the international financial corporation (IFC) with strong support from the Federal Government of Nigeria and various industrial and policy stakeholders has produced the Nigerian CO2 Storage Atlas, sorting prospective geological storage sites. However, the storage efficiency factors applied to the estimated resource capacity to provide low, medium and high resource estimations may not be a true representation for the underground CO2 storage space, especially for depleted hydrocarbon reservoirs, in the Nigeria rich oil province that is very porous and permeable. We therefore present assessment of CO2 storage potential of some depleted hydrocarbon reservoirs in the Niger Delta, derive specific approximate CO2 Storage efficiency factors for these reservoirs, and develop a model for determining site-specific CO2 storage efficiency factor. Comparison of results from various approaches – production-based, volumetric- based with varying CO2 storage efficiency factors obtained from the new model and previous works, and an enhanced analytical simulation tool (EASiTool) was also carried out. The newly developed model for determining site-specific CO2 storage efficiency factor can help improve the predictive capability of the volumetric method for CO2 storage potential estimates, especially for depleted oil reservoirs in the Niger Delta.},
 year = {2026}
}
TY  - JOUR
T1  - Evaluation of CO2 Storage Potential of Some Depleted Hydrocarbon Reservoirs: Niger Delta Case Study
AU  - Aniefiok Livinus
AU  - Raymond Mkpouto Obot
AU  - Antigha Eyo
AU  - Itoro Udofort Koffi
AU  - Victor E. Etuk
Y1  - 2026/05/27
PY  - 2026
N1  - https://doi.org/10.11648/j.pse.20261001.15
DO  - 10.11648/j.pse.20261001.15
T2  - Petroleum Science and Engineering
JF  - Petroleum Science and Engineering
JO  - Petroleum Science and Engineering
SP  - 51
EP  - 62
PB  - Science Publishing Group
SN  - 2640-4516
UR  - https://doi.org/10.11648/j.pse.20261001.15
AB  - Recent joint efforts led by the international financial corporation (IFC) with strong support from the Federal Government of Nigeria and various industrial and policy stakeholders has produced the Nigerian CO2 Storage Atlas, sorting prospective geological storage sites. However, the storage efficiency factors applied to the estimated resource capacity to provide low, medium and high resource estimations may not be a true representation for the underground CO2 storage space, especially for depleted hydrocarbon reservoirs, in the Nigeria rich oil province that is very porous and permeable. We therefore present assessment of CO2 storage potential of some depleted hydrocarbon reservoirs in the Niger Delta, derive specific approximate CO2 Storage efficiency factors for these reservoirs, and develop a model for determining site-specific CO2 storage efficiency factor. Comparison of results from various approaches – production-based, volumetric- based with varying CO2 storage efficiency factors obtained from the new model and previous works, and an enhanced analytical simulation tool (EASiTool) was also carried out. The newly developed model for determining site-specific CO2 storage efficiency factor can help improve the predictive capability of the volumetric method for CO2 storage potential estimates, especially for depleted oil reservoirs in the Niger Delta.
VL  - 10
IS  - 1
ER  -
Petroleum Engineering Department, University of Uyo, Uyo, Nigeria
Petroleum Engineering Department, University of Uyo, Uyo, Nigeria
Petroleum & Gas Engineering Department, University of Lagos, Lagos, Nigeria
Craft & Hawkins Department of Petroleum Engineering, Louisiana State University, Louisiana, USA
Chemical Engineering Department, University of Uyo, Uyo, Nigeria
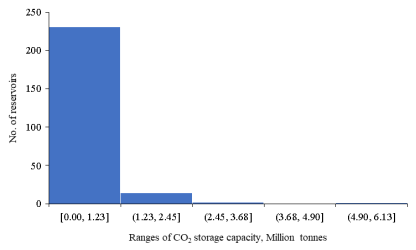
Figure 2. CO2 storage capacity, in Million tonnes, predictions using the production-based model for the reservoirs under study.
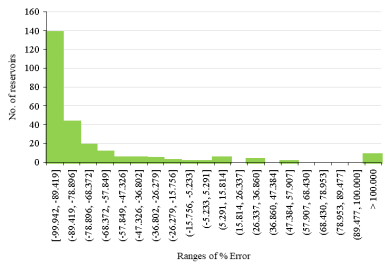
Figure 3. Ranges of percentage error for 0.5% CO2 efficiency factor volumetric-based model, when compared with that of the production-based model.
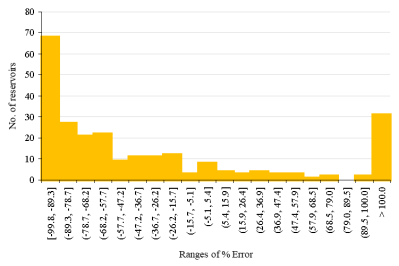
Figure 4. Ranges of percentage error for 2.0% CO2 efficiency factor volumetric-based model, when compared with that of the production-based model.
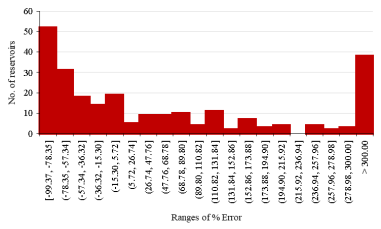
Figure 5. ranges of percentage error for 5.4% CO2 efficiency factor volumetric-based model, when compared with that of the production-based model.
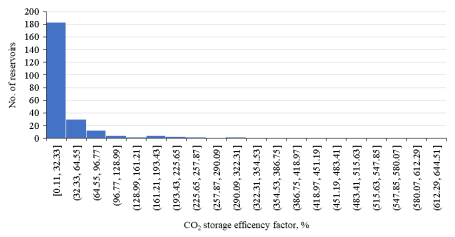
Figure 6. Distribution of the specific approximate CO2 storage efficiency factors (%) for the reservoirs under study.
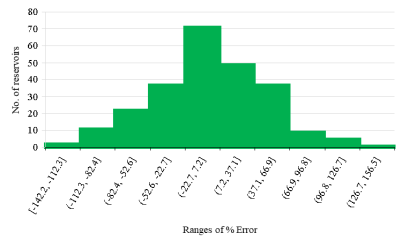
Figure 7. Percentage error and the predicted CO2 storage efficiency factor.
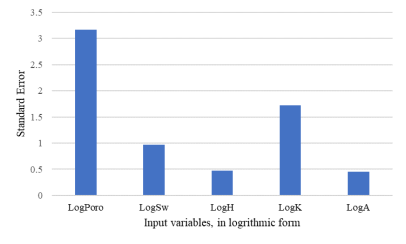
Figure 8. Standard error plot for the input variables in the MLR.
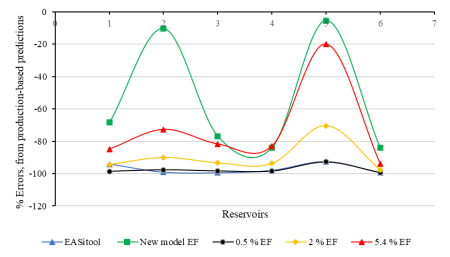
Figure 9. Comparison of predicted results from various approaches
Information

