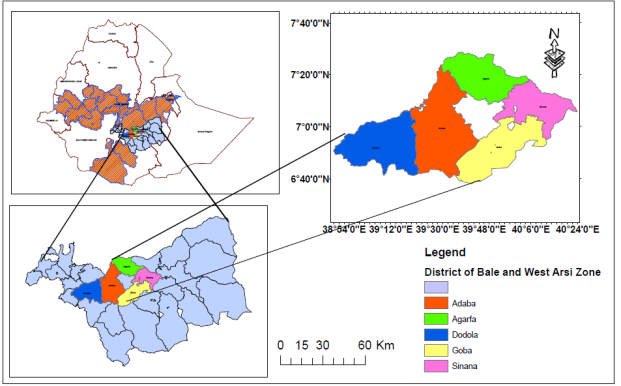
Ethiopia's economy and professions have traditionally depended on agriculture, emphasizing the need to provide the most appropriate fertilizer packages for various crops, especially to enhance the productivity of the country's small-scale farmers. A field study was conducted during the 2020–2023 cropping season in southeastern Ethiopia's Bale Highland and West Arsi Zone. This study utilized a randomized complete block design (RCBD) with five treatments and three replicates to assess different types of balanced fertilizers and confirm recommendations based on soil fertility maps for bread wheat production. The treatments included: 1) Control (no fertilizer); 2) 100 kg/ha of urea; 3) 100 kg of urea plus 100 kg of NPS/ha; 4) 100 kg of urea plus 100 kg of NPSB/ha; and 5) 100 kg/ha NPSZnB plus 100 kg of urea. Using blended fertilizers yielded significant enhancements in plant height, the number of tillers per plant, spike length, seeds per spike, grain yield, above-ground biomass, and the weight of a thousand kernels at harvest.
| Published in | Plant (Volume 13, Issue 2) |
| DOI | 10.11648/j.plant.20251302.15 |
| Page(s) | 100-107 |
| Creative Commons |
This is an Open Access article, distributed under the terms of the Creative Commons Attribution 4.0 International License (http://creativecommons.org/licenses/by/4.0/), which permits unrestricted use, distribution and reproduction in any medium or format, provided the original work is properly cited. |
| Copyright |
Copyright © The Author(s), 2025. Published by Science Publishing Group |
Balanced Fertilizer Type, Fertilizer Type, Ata Mapping, Bale, West Arsi, Biomass
Location | Textural type | PH (H2O) | OM (%) | TN% | P (mg/kg) |
|---|---|---|---|---|---|
Sinana | Clay | 6.2-6.7 | 1.45-1.93 | 0.18 | 1.18-4.45 |
Gobba | Clay | 6.01 | 1.61 | 0.16 | 5.92 |
Agarfa | Clay | 6.02-7.05 | 1.80-2.56 | 0.15 | 3.88-5.72 |
Dodala | Sandy Clay | 6.79-7.2 | 2.12-2.73 | 0.12 | 1.23 |
Adaba | Clay | 6.48-6.8 | 1.93-2.83 | 0.10 | 1.31 |
Trt (Combined) | PH (cm) | SL (cm) | SPS (cm) | NT | BM (kg) | GY (kg) | TKW |
|---|---|---|---|---|---|---|---|
Control | 84.87b | 6.27 | 38.84c | 3.13 | 9080.98 | 3006.51e | 30.11 |
100 kg Urea | 89.22a | 7.07 | 39.82bc | 3.42 | 9607.42 | 3838.87d | 32.89 |
100 kg NPS +100 Urea | 92.11a | 6.58 | 40.82ab | 4.00 | 11701.27 | 4593.89c | 32.69 |
100 kg NPSB +100 Urea | 92.27a | 6.71 | 40.27bc | 3.96 | 14054.67 | 5005.38b | 33.07 |
100 kg NPSZnB +100 Urea | 91.20a | 7.13 | 42.38a | 4.09 | 12054.27 | 5257.51a | 32.69 |
Mean | 89.93 | 6.75 | 40.43 | 3.72 | 11299.72 | 4340.43 | 32.89 |
LSD (0.05%) | 4.0 | NS | 1.7 | NS | 1212 | 232.4 | NS |
CV (%) | 10.96 | 13.64 | 10.65 | 20.62 | 15.82 | 12.89 | 12.65 |
Trt (Combined) | PH (cm) | SL (cm) | SPS (cm) | NT | BM (kg) | GY (kg) | TKW |
|---|---|---|---|---|---|---|---|
Control | 77.46b | 4.62 | 33.08 | 3.71 | 11167.79 | 2215.71c | 26.21 |
100 kg Urea | 81.21b | 6.21 | 35.00 | 3.50 | 13519.00 | 3235.88 b | 27.54 |
100 kg NPS +100 Urea | 89.17a | 6.67 | 37.08 | 3.96 | 13998.12 | 4661.96a | 27.58 |
100 kg NPSB +100 Urea | 88.83a | 6.58 | 37.83 | 4.25 | 12745.33 | 4506.29a | 27.67 |
100 kg NPSZnB +100 Urea | 87.38a | 6.67 | 38.21 | 4.08 | 12601.79 | 4580.71a | 27.29 |
Mean | 84.81 | 6.15 | 36.24 | 3.90 | 13386.41 | 3840.11 | 27.66 |
LSD (0.05%) | 4.3 | NS | 2.4 | NS | 1123 | 251 | NS |
CV (%) | 8.94 | 17.56 | 11.60 | 21.23 | 14.68 | 11.44 | 13.00 |
TKW | BM | GY | SL | SPS | NT | PH | |
|---|---|---|---|---|---|---|---|
TKW | 1 | ||||||
BM | 0.006* | 1 | |||||
GY | 0.07* | 0.53** | 1 | ||||
SL | 0.08* | 0.20* | 0.33* | 1 | |||
SPS | 0.17* | 0.20* | 0.30* | 0.18* | 1 | ||
NT | 0.14* | 0.41** | 0.31* | 0.22* | 0.20* | 1 | |
PH | -0.16* | 0.43** | 0.41* | 0.33* | 0.23* | 0.15* | 1 |
TKW | GY | BM | SL | SPS | NT | PH | |
|---|---|---|---|---|---|---|---|
TKW | 1 | ||||||
GY | -0.11* | 1 | |||||
BM | 0.39** | -0.16* | 1 | ||||
SL | -0.38* | 0.50** | -0.29* | 1 | |||
SPS | -0.049* | 0.45* | -0.05 | 0.08* | 1 | ||
NT | 0.50* | 0.08* | 0.11 | -0.38* | 0.27* | 1 | |
PH | -0.57* | 0.59** | 0.35 | 0.68** | 0.24* | -0.42* | 1 |
N | Nitrogen |
P | Phosphors |
K | Potassium |
S | Sulfur |
Cu | Coper |
Zn | Zinc |
B | Boron |
OM | Organic Mater |
TN | Total Nitrogen |
CEC | Cation Exchange Capacity |
| [1] | Abebual Woldetsadik, Wondwosen Tena, and Asmare Melese. 2019. Effect of Different Blended Fertilizer Formulation on Yield and Yield Components of Bread Wheat (Triticum aestivum L.) in Siyadebrenawayu District, North Shewa, Ethiopia. Journal of Biology, Agriculture and Healthcare, 9 (15): 13-23. |
| [2] | ATA (Agricultural Transformation Agency). 2016. Soil Fertility Status and Fertilizer Recommendation Atlas of the Southern Nations Nationalities and Peoples’ Regional State, Ethiopia, by Ministry of Agriculture and Natural Resources and Agricultural Transformation Agency, Ethiopian, Addis Ababa, Ethiopia. |
| [3] | Bekele Hundie, Mawangi W and Tanner DG. 2000. Adaptation of improved wheat technologies in Addaba and Dodola woredas of the Bale high lands of Ethiopia CIMMYT/EARO, Addis Ababa, Ethiopia. Bread wheat cultivars were released in Ethiopia from 1949 to 1987. |
| [4] | Berhan Abayu. 2012. Agronomic and Economic Effects of Blended Fertilizers under Planting Method on Yield and Yield Components of Tef: MSc Thesis, Mekelle University, Mekelle, Ethiopia. |
| [5] | Bouyoucos, G. J. (1952). A recalibration of the hydrometer method for making mechanical analysis of soils. |
| [6] | Central Statistical Agency (CSA) (2018) The Federal Democratic Republic of Ethiopia Central Statistical Agency Agricultural Sample Survey. Report on Area and Production of Crops. Statistical Bulletin No. 586. Addis Abeba, Ethiopia. |
| [7] | Dargie, S., Hadgu, F., Brhane, H., Mehari, T., Hadis, M., Hailu, G., & Berhe, D. (2021). Evaluation of NPSZn Blended Fertilizer on Yield and Yield Traits of Bread Wheat (Tritcum aestivum L.) on Cambisols and Vertisols in Southern Tigray, Ethiopia. Ethiopian Journal of Agricultural Sciences, 31(2), 33-43. |
| [8] | Chapman, H. D. (1965). Cation‐exchange capacity. Methods of soil analysis: Part 2 Chemical and microbiological properties, 9, 891-901. |
| [9] | Cottenie, A. (1980). Soil and plant testing as a basis of fertilizer recommendations. FAO soil bulletin 38/2. Food and Agriculture Organization of the United Nations, Rome. |
| [10] | CSA (Ethiopian Central Statistical Agency). 2012. Structural transformation in Ethiopia: Evidence from cereal markets, International Food Policy Research Institute (IFPRI). |
| [11] | Demeke, M., Di Marcantonio, F., & Morales-Opazo, C. (2013). Understanding the performance of food production in sub-Saharan Africa and its implications for food security. Development and Agricultural Economics, 5(11), 425-443. |
| [12] | Dinkinesh Abera, Tamado Tana and Tadesse Dessalegn. 2020. Effects of blended NPSB fertilizer rates on yield and grain quality of durum wheat (Triticum turgidum L.) varieties in Minijar Shenkora District, Central Ethiopia. Ethiopian Journal of Agricultural Sciences, 30(3): 57–76. |
| [13] | Efrem Bechere, Hirut Kebede and Getachew Belay. 2000. Durum wheat in Ethiopia: An old crop in an ancient land. Institute of Biodiversity Conservation and Research. Addis Ababa, Ethiopia. |
| [14] | EthioSIS (Ethiopian Soils Information System). 2013. Status of soil resources in Ethiopia and priorities for sustainable management, GSP for eastern and southern Africa Mar 25-27, 2013 Nairobi, Kenya. |
| [15] | FAO (Food and Agricultural Organization). 1998. Ethiopia: Soil Fertility Initiative, concept paper, Report No. 98/028 CP-ETH, FAO/World Bank Cooperative Program. FAO, Rome. |
| [16] | FAO AND ITPS. 2015. Status of the World Soil Resource (SESR)-main report, pp. 132. |
| [17] | FAOSTAT (The Food and Agriculture Organization Corporate Statistical Database). 2013. Agricultural production Statistics. |
| [18] | Haji Jewaro Beketa, Demelash Kefale and Tarekegn Yoseph. 2020. Effect of Blended Fertilizer Types and Rates on Growth, Yield and Yield Components of Bread Wheat (Triticum aestivum L.) in Wondo District, Southern Ethiopia. International Journal of Agriculture Innovations and Research, 8(4): 326-342. |
| [19] | Hazelton. (2007). Interpreting Soil Test Results, CSIRO Publishing, 150 Oxford Street (P O Box 1139) Collingwood VIC 3066, Australia. |
| [20] | Jackson, M. L. (1962, February). Interlayering of expansible layer silicates in soils by chemical weathering. In Clays and Clay Minerals (National Conference on Clays and Clay Minerals) (Vol. 11, pp. 29-46). Cambridge University Press & Assessment. |
| [21] | Landon, J. R. (1991). Booker Tropical Soil Manual: A handbook for soil survey and Agricultural Land Evaluation in the Tropics and Subtropics. Longman Scientific and Technical, Essex, New York. 474p. OR John Wiley & Sons Inc., New York. |
| [22] | Meshram, P., P. Bagade, S. Bachhav, Y. Shaniware and R. Shirsath. (2024). Influence of different sources and levels of phosphorus on growth and nutrient uptake of soybean in low calcareous soil. International Journal of Statistics and Applied Mathematics, 9(6): 104-108. |
| [23] | Walkley, A., & Black, I. A. (1934). An examination of the Degtjareff method for determining soil organic matter, and a proposed modification of the chromic acid titration method. Soil science, 37(1), 29-38. |
| [24] | Olsen, S. R. (1954). Estimation of available phosphorus in soils by extraction with sodium bicarbonate (No. 939). US Department of Agriculture |
| [25] | Roy, R. N., Misra, R. V, Lesschen, J. P. &Smaling, E. M. A. 2003. Assessment of Soil Nutrient Balance: Approaches and Methodologies. Rome, FAO. |
| [26] | Sanchez, P. A., Shepherd, K. D., Soule, M. J., Place, F. M., Buresh, R. J., Izac, A. M. N., ... & Woomer, P. L. (1997). Soil fertility replenishment in Africa: an investment in natural resource capital. Replenishing soil fertility in Africa, 51, 1-46. |
| [27] | Seyoum Alemu. 2017. Effect of blended NPS and N fertilizer rates on yield components, yield, and grain protein content of bread wheat (Triticum aestivum L.) in Bore district, Guji Zone, Southern Ethiopia. MSc Thesis. School of Plant Sciences, Haramaya University, Ethiopia. |
| [28] | Stewart, I. T., Cayan, D. R., & Dettinger, M. D. (2005). Changes toward earlier streamflow timing across western North America. Journal of Climate, 18(8), 1136-1155. |
| [29] | Tekalign, T. (1991). Soil, plant, water, fertilizer, animal manure, and compost analysis. Working Document No. 13. International Livestock Research Center for Africa, Addis Ababa. |
| [30] | Tesfaye Ketema Defar, Mulugeta Eshetu Diriba, Regassa Gosa Telila, Girma Getachew Gemechu (2024). Evaluation of Balanced Fertilizer Types and Validation of Soil Fertility Map-Based Fertilizer Recommendation for Bread Wheat Production in Bale Highland Southeastern Ethiopia. Cross Current Int J Agri Vet Sci, 6(3), 40-46. |
| [31] | Teklu, E., & Hailemariam, T. (2009). Agronomic and economic efficiency of manure and urea fertilizers use on vertisols in Ethiopian highlands. Agricultural sciences in China, 8(3), 352-360. |
APA Style
Defar, T. K., Diriba, M. E., Telila, R. G., Gemechu, G. G. (2025). Evaluation and Verification of the Type of Blended Fertilizer for Soil Fertility Based on the Soil Fertility Map Recommendations for Bread Wheat Production. Plant, 13(2), 100-107. https://doi.org/10.11648/j.plant.20251302.15
ACS Style
Defar, T. K.; Diriba, M. E.; Telila, R. G.; Gemechu, G. G. Evaluation and Verification of the Type of Blended Fertilizer for Soil Fertility Based on the Soil Fertility Map Recommendations for Bread Wheat Production. Plant. 2025, 13(2), 100-107. doi: 10.11648/j.plant.20251302.15
@article{10.11648/j.plant.20251302.15,
  author = {Tesfaye Ketema Defar and Mulugeta Eshetu Diriba and Regassa Gosa Telila and Girma Getachew Gemechu},
  title = {Evaluation and Verification of the Type of Blended Fertilizer for Soil Fertility Based on the Soil Fertility Map Recommendations for Bread Wheat Production
},
  journal = {Plant},
  volume = {13},
  number = {2},
  pages = {100-107},
  doi = {10.11648/j.plant.20251302.15},
  url = {https://doi.org/10.11648/j.plant.20251302.15},
  eprint = {https://article.sciencepublishinggroup.com/pdf/10.11648.j.plant.20251302.15},
  abstract = {Ethiopia's economy and professions have traditionally depended on agriculture, emphasizing the need to provide the most appropriate fertilizer packages for various crops, especially to enhance the productivity of the country's small-scale farmers. A field study was conducted during the 2020–2023 cropping season in southeastern Ethiopia's Bale Highland and West Arsi Zone. This study utilized a randomized complete block design (RCBD) with five treatments and three replicates to assess different types of balanced fertilizers and confirm recommendations based on soil fertility maps for bread wheat production. The treatments included: 1) Control (no fertilizer); 2) 100 kg/ha of urea; 3) 100 kg of urea plus 100 kg of NPS/ha; 4) 100 kg of urea plus 100 kg of NPSB/ha; and 5) 100 kg/ha NPSZnB plus 100 kg of urea. Using blended fertilizers yielded significant enhancements in plant height, the number of tillers per plant, spike length, seeds per spike, grain yield, above-ground biomass, and the weight of a thousand kernels at harvest.
},
 year = {2025}
}
TY  - JOUR
T1  - Evaluation and Verification of the Type of Blended Fertilizer for Soil Fertility Based on the Soil Fertility Map Recommendations for Bread Wheat Production

AU  - Tesfaye Ketema Defar
AU  - Mulugeta Eshetu Diriba
AU  - Regassa Gosa Telila
AU  - Girma Getachew Gemechu
Y1  - 2025/06/23
PY  - 2025
N1  - https://doi.org/10.11648/j.plant.20251302.15
DO  - 10.11648/j.plant.20251302.15
T2  - Plant
JF  - Plant
JO  - Plant
SP  - 100
EP  - 107
PB  - Science Publishing Group
SN  - 2331-0677
UR  - https://doi.org/10.11648/j.plant.20251302.15
AB  - Ethiopia's economy and professions have traditionally depended on agriculture, emphasizing the need to provide the most appropriate fertilizer packages for various crops, especially to enhance the productivity of the country's small-scale farmers. A field study was conducted during the 2020–2023 cropping season in southeastern Ethiopia's Bale Highland and West Arsi Zone. This study utilized a randomized complete block design (RCBD) with five treatments and three replicates to assess different types of balanced fertilizers and confirm recommendations based on soil fertility maps for bread wheat production. The treatments included: 1) Control (no fertilizer); 2) 100 kg/ha of urea; 3) 100 kg of urea plus 100 kg of NPS/ha; 4) 100 kg of urea plus 100 kg of NPSB/ha; and 5) 100 kg/ha NPSZnB plus 100 kg of urea. Using blended fertilizers yielded significant enhancements in plant height, the number of tillers per plant, spike length, seeds per spike, grain yield, above-ground biomass, and the weight of a thousand kernels at harvest.

VL  - 13
IS  - 2
ER  -
Oromia Agricultural Research Institute, Sinana Agricultural Research Centre, Soil Fertility Improvement Team, Bale-Robe, Ethiopia
Information