3. Results and Analysis
3.1. Phenotypic Characterization of Aspergillus from El Salvador
From the tree called NACASCOL whose scientific name is
Caeselpinia coriaria, of the family
Caesalpnieaceae, of the genus
Caesalpinia, a leguminous plant with a stem from 3 to 11 meters high, with leaves in pairs pinnae 5 to 10 cm long, each with more than 10 leaflets 4 to 8 mm long and 2 mm wide, The seeds are approximately 3 to 4 cm long, apex rounded, brown seeds with a black appearance, from which grows a fungus whose resemblance is to a possible
Aspergillus sp. The
Caeselpinia coriaria tree contains tannins, triterpenes, glycosides, and flavonoids. The fungus reproduces exclusively in the seeds of the Nacascol tree, from which it is prepared for the extraction and preparation of the dye and then cultivated in vitro for the production of the dye by Salvadoran artisans.
| [51] | Vásquez H., A. Extracto acuoso de colorante negro natural a partir de las semillas de nacazcol. La Universidad (10-11). pp. 113-118. ISSN 0041-8242. 2010. |
[51]
. The fungus found in the seeds is described as follows: Sterygmas. The head of the conidia is black, smooth conidiophore 1 to 4 μm long with moderate conidia or internal spores of 1 to 3 microns, brown to black
. It is a hyaline, saprophytic filamentous fungus, belonging to the phylum Ascomycota. Macroscopic characteristics: When cultured in special Saboraud medium they produce a black coloration with pigment production in the tube in the posterior region in the tubes within 7 days. In plate and tube Saboraud agar culture: the colony its mycelium is white with a columnar appearance and then turns black. The texture of the colognes, they look like cotton or velvet, there are no sclerotes. The reverse of the colony is black or pigmented black depending on the oxidizing agent, low mycelium height, appearance of the colony is dusty black. It is a filamentous fungus. Microscopic characteristics: The conidiophore of
Aspergillus has three distinct parts: a terminal globose vesicle with a uniseriate fialid without metal, a tubular stipe, and the foot cell that joins the conidiophore with the mycelium. Conidiophores are smooth-walled and rough and are grouped together to form a compact, hyaline or pigmented mass and are 3 to 5 μm long and 15 to 20 μm in diameter. Hundreds of spores or conidia are observed inside. The spore is spherical and irregular, aseptate, ameroporous, colored and dark of the columnar feospore type. The vesicle is globose with 52-66 μm in diameter with a stipe length of 100-300 μm, a stipe width of 2-2 μm, irregular ornamentation, and produces phylalides around it. The phylalides are monoseriate, the primary branches are 30 μm long, short and 8 microns long, from which the conidia sprout, which are globose and rough 4 to 5 μm in diameter, brown brown or brown to black. The diameter of the colony is 9-10 μm, the conidia are columnar and have a length of 3-5 μm and a width of 1.96-2 μm. Smooth conidia heads with a round and irregular wall, arranged in a column; smooth, pronounced, thin-walled stipes, brown to black; no columella is observed; there are abundant conidia that detach from the head; It has a row of phylalides. The sporangium is a simple globose peridial structure, the sterygma is black. Mature brown conidia are spherical with abundant spiny-like projections throughout the periphery; and the central ones are few, forming spicules in number greater than ten. The conidia have a spherical appearance in the form of a mallet with spicules, from the ends emerge long filaments arranged in the form of linear chains that come out of the protuberances. The entire structure forms a solid shell. Immature asexual spores are spherical, thin-walled, colorless, large in size, which then fill in to form internal brown masses. The conidiophore is long, smooth, uniseriate, with abundant spores. In general, the spore is elongated and irregular, aseptate, ameroporous, colored, and dark of the type feospora, large, with a diameter of 1 to 3 μm; Hyphae are not septate with continuous mycelium. The head is not radiated, it is columnar, it is uniserial, from which the conidia are detached, it grows at room temperature of 37°C. Immature asexual conidia/spores are irregular with a thin, colorless wall of large size, which then fill in forming brown inner masses, the appearance of the colony is dusty black. The mycelium is short or flattened and thin and black as it ages. This species of
Aspergillus found, it is suggested that given its morphological characterization it is another found in El Salvador deduced by the international taxonomic classification. When comparing both the
niger and the discovered species, the vesicle of the
niger species is irradiated with round conidia and the other discovered is shaped like an elongated mallet without irradiation. At 100x it can be observed that the conidia of the
niger are round with thick walls and a smooth center biseriate, with metula and radiated
| [46] | Samson, R. et al. Phylogeny, identification and nomenclature of the genus Aspergillus. studies in mycology 78: 141-173. 2014. |
[46]
. The one of the new species has spicules coming out of the armor. Both conidia can be observed, in which it is highlighted that the conidia of the new species are not stained with cotton blue lactophenol and those of
niger are
| [51] | Vásquez H., A. Extracto acuoso de colorante negro natural a partir de las semillas de nacazcol. La Universidad (10-11). pp. 113-118. ISSN 0041-8242. 2010. |
[51]
.
Aspergillus has asexual reproduction because it has conidia formation, at first the mycelium is white and then after weeks at room temperature it changes to black, with progressive increase in brown sporulation. These grow at the ends of the phylalids. Due to the presence of pigments, it looks black in color. The fungus of the genus
Aspergillus spp has the particularity of being mycotoxin producers. Mycotoxins are secondary metabolites produced and secreted by the fungus during the degradation process of organic matter, as a defense mechanism against other microorganisms.
| [14] | Couri, S. et al. Digital Image processing a tool to monitor biomasss growth in Aspergillus niger 3TSB8 solid state fermentation: preliminary results. Journal of Microscopy vol 224. pt. pp 290-297. 2006. |
| [15] | Cruz, R. Micheli y el género Aspergillus. Rev. chil. infectol. [online]. 2023, vol. 40, n. 2, pp. 169-171. 2023. |
| [16] | Demeke, T and R. P. Adams. The UBe of PCR-RAPD Analysis in Plant Taxonomy and Evolution., p. 179-191. 1994. |
| [17] | Frisvad, J. Secondary metabolite profiling, growth profiles and other tools for species recognition and important Aspergillus mycotoxins, Studies in Mycology, Volume 59, Pages 31-37. 2007. |
| [18] | Garraway, M. Fungal Nutrition and Physiology". John Wiley & Sons, Inc. (CanadA), 22-48. 1984. |
| [19] | Gassiot C. et al. Aspergilosis pulmonar: un nuevo enfoque en la reemergencia. Acta Medica. 9(1-2): 67-72. 2000. |
| [20] | Geiser et al. Geiser DM, Klich MA, Frisvad JC, Peterson SW, Varga J, Samson RA (2007). The current status of species recognition and identification in Aspergillus. Studies in Mycology 59: 1-10. 2007. |
| [21] | Gibbons JG, Rokas A. The function and evolution of the Aspergillus genome. Trends MicrobiolJan; 21(1): 14-22. https://doi.org/10.1016/j.tim.2012.09.005 Epub 2012 Oct 17 2013. |
| [22] | Gmoser, J. A. et all. Filamentous ascomycetes fungi as a source of natural pigments. Fungal Biol. Biotechnol. 2017. |
| [23] | Hawksworth DL. Naming Aspergillus species: progress towards one name for each species. Medical Mycology 49: S70-S76. 2011. |
| [24] | Horn, P., and A. Rafalski. Non-Destructive RAPD Genetic Diagnostic of Microspore-Derived Brassica Embryos. Plant Molecular Biology Reporter 10285-293. 1992. |
| [25] | Illumina, “An introduction to Next-Generation Sequencing Technology.” www.illumina.com/technology/nextgeneration-sequencing.html (accessed Oct. 03, 2022). |
| [26] | Journal microbiology. Microbiology Aspergillus sp. 2005. |
| [27] | Kilich, M. Identification of clinically relevant Aspergillus. Medical Mycology. 44, 5127-5131. 2006. |
| [28] | Klingspor, L et al. Aspergillus PCR formidable challenges and progress. Medical Mycology, 47, S241 S247. 2009. |
| [29] | Lee, J. Simple Chemical Extraction Method for DNA Isolation from Aspergillus fumigatus and Other Aspergillus Species. Journal of clinical Microbiology. 2004. |
| [30] | Labbox, Introducción a la técnica de qPCR. Online. https://labbox.es/ 2024. |
| [31] | Lifeder. (18 de agosto de 2023). Aspergillus. Recuperado de: https://www.lifeder.com/aspergillus/ 2023. |
| [32] | Loredo, A., Tesis, Anáslisis genético de Aspergillus spp y su implicación en la identificación de hongos alatoxigenicos. 1997. |
| [33] | Loeffler, J, et al. Comparison between Plasma and Whole Blood Specimens for Detection of Aspergillus DNA by PCR. Journal of Clinical Microbiology. 2000. |
| [34] | Marchese S, et al. Aflatoxin B1 and M1: Biological Properties and Their Involvement in Cancer Development. Toxins. 2018. |
| [35] | Macrogen, Inc. /Shaun Seonwoo Lee. /Public Biotechnology Company. South Korea. https://dna.macrogen.com/2024 |
| [36] | Martinez-Soriano, J. Detection of Brucella abortus by means of the Polymerase Chain Reaction. Bioquimia 18: 10-16.57. 1993. |
| [37] | MERK qPCR. Online. https://www.merckmillipore.com/GT/es/life-scienceresearch/genomic-analysis/dna-preparationloning/PCR/qPCR/7Rub.qB.GXwAAAFEdVlXHZkB,nav?ReferrerURL=https%3A%2F%2Fwww.google.com%2F.2024 |
| [38] | Nitiu, D. Pigmentos sintetizados por hongos negros y su impacto en el deterioro del patrimonio documental en papel. Bol. Soc. Argent. Bot. 57: 169-184. 2022. |
| [39] | Palomares, J. Revista Iberoamericana de Micología - ISBN: 978-84-611-8776-8. 2007. |
| [40] | Rapaer Kb et al. The genus Aspergillus. Tratado de Micología Medica. 3a edic. pp 668-703. 1998. |
| [41] | Rippon. JW. Tratado de Micología Medica. 3ª edición Interamericana. Mc Graw Hill México. 1990. |
| [42] | Ruiz, I, Pulmonary aspergillosis. Rev. Med. Electrón. vol. 40 no. 4. 2018. |
| [43] | Salazar, C et al. Características morfológicas microscópicas de especies de Aspergillus asociadas a infecciones en humanos. Hechos Microbiol. 3(2); 93-96. 2012. |
[14-43]
. The hyphae continue their way in a codinidophore that at its terminal end ends in a globose conidial head from which the phyllids emerge and the spores or conidia are detached to return to their cycle. Each hyphae, at its end, forms globose conidial heads that can produce more than 500,000 conidia.
. These conidia at 100x have a rough appearance like pectorals, thick wall with brown spicules projecting outward, filled and whole that are not colored with cotton blue lactophenol. From the base of the hyphae, each conidia is pushed into the conidiophore to the end until it reaches the vesicle where it accumulates, exerting a mechanical effect of pressure outwards from where it emerges from the phylids to the outside, this is constant over and over again. Hyphae are filamentous cylindrical structures that form the body of multicellular fungi. They are made up of a row of elongated cells wrapped by a chitinous cell wall. The cells that make it up may or may not be separated from each other by a transverse cell wall called septa. These conidia are considered infectious and constitute the starting point for the development of the mycelium of the fungus. Uniseriate hyphae are usually transparent where the spores are visible. It is a fungus that produces mycotoxins that are considered as secondary metabolites produced and secreted by the fungus during the process of degradation of organic matter, as a defense mechanism against other microorganisms that produce aflatoxins B1 and M1 that are carcinogenic, others also associate it with mycotoxins or ochratoxins that are secondary metabolites of the strains of
Aspergillus and Penicillium. | [9] | Bolet, M. et all. Micotoxinas y cáncer. Rev Cubana Invest Bioméd v. 24 n. 1 Ciudad de la Habana. 2005. |
| [10] | Bustillo, Alex. Método para cuantificar suspensiones de esporas de hongos y otros organismos. https://doi.org/10.13140/RG.2.1.3594.5128. 2010 |
| [11] | Cao W, et all. Aflatoxin B1: metabolism, toxicology, and its involvement in oxidative stress and cancer development. Toxicol Mech Methods. 2022. |
| [34] | Marchese S, et al. Aflatoxin B1 and M1: Biological Properties and Their Involvement in Cancer Development. Toxins. 2018. |
| [35] | Macrogen, Inc. /Shaun Seonwoo Lee. /Public Biotechnology Company. South Korea. https://dna.macrogen.com/2024 |
| [36] | Martinez-Soriano, J. Detection of Brucella abortus by means of the Polymerase Chain Reaction. Bioquimia 18: 10-16.57. 1993. |
| [37] | MERK qPCR. Online. https://www.merckmillipore.com/GT/es/life-scienceresearch/genomic-analysis/dna-preparationloning/PCR/qPCR/7Rub.qB.GXwAAAFEdVlXHZkB,nav?ReferrerURL=https%3A%2F%2Fwww.google.com%2F.2024 |
| [38] | Nitiu, D. Pigmentos sintetizados por hongos negros y su impacto en el deterioro del patrimonio documental en papel. Bol. Soc. Argent. Bot. 57: 169-184. 2022. |
| [39] | Palomares, J. Revista Iberoamericana de Micología - ISBN: 978-84-611-8776-8. 2007. |
| [40] | Rapaer Kb et al. The genus Aspergillus. Tratado de Micología Medica. 3a edic. pp 668-703. 1998. |
[9-11, 34-40]
mainly
Aspergillus flavus with aflatoxins B1, B2, G1 and G2 and
Asperillus parasiticus both related to Pulmonary Aspergilloma or Lung Abscess or also various cancers of the liver, kidney, pancreas, colorectal.
| [9] | Bolet, M. et all. Micotoxinas y cáncer. Rev Cubana Invest Bioméd v. 24 n. 1 Ciudad de la Habana. 2005. |
| [10] | Bustillo, Alex. Método para cuantificar suspensiones de esporas de hongos y otros organismos. https://doi.org/10.13140/RG.2.1.3594.5128. 2010 |
| [11] | Cao W, et all. Aflatoxin B1: metabolism, toxicology, and its involvement in oxidative stress and cancer development. Toxicol Mech Methods. 2022. |
| [12] | Casas, R. Micología General. 2da Edición. Universidad Central de Venezuela. Ediciones de la Biblioteca. Caracas. Online. 2010. |
| [13] | Conant, S. et al. Micología. 3ª edición. Interamericana. México. 1972. |
| [14] | Couri, S. et al. Digital Image processing a tool to monitor biomasss growth in Aspergillus niger 3TSB8 solid state fermentation: preliminary results. Journal of Microscopy vol 224. pt. pp 290-297. 2006. |
| [15] | Cruz, R. Micheli y el género Aspergillus. Rev. chil. infectol. [online]. 2023, vol. 40, n. 2, pp. 169-171. 2023. |
| [16] | Demeke, T and R. P. Adams. The UBe of PCR-RAPD Analysis in Plant Taxonomy and Evolution., p. 179-191. 1994. |
| [17] | Frisvad, J. Secondary metabolite profiling, growth profiles and other tools for species recognition and important Aspergillus mycotoxins, Studies in Mycology, Volume 59, Pages 31-37. 2007. |
| [18] | Garraway, M. Fungal Nutrition and Physiology". John Wiley & Sons, Inc. (CanadA), 22-48. 1984. |
| [19] | Gassiot C. et al. Aspergilosis pulmonar: un nuevo enfoque en la reemergencia. Acta Medica. 9(1-2): 67-72. 2000. |
| [20] | Geiser et al. Geiser DM, Klich MA, Frisvad JC, Peterson SW, Varga J, Samson RA (2007). The current status of species recognition and identification in Aspergillus. Studies in Mycology 59: 1-10. 2007. |
| [21] | Gibbons JG, Rokas A. The function and evolution of the Aspergillus genome. Trends MicrobiolJan; 21(1): 14-22. https://doi.org/10.1016/j.tim.2012.09.005 Epub 2012 Oct 17 2013. |
| [22] | Gmoser, J. A. et all. Filamentous ascomycetes fungi as a source of natural pigments. Fungal Biol. Biotechnol. 2017. |
| [23] | Hawksworth DL. Naming Aspergillus species: progress towards one name for each species. Medical Mycology 49: S70-S76. 2011. |
| [24] | Horn, P., and A. Rafalski. Non-Destructive RAPD Genetic Diagnostic of Microspore-Derived Brassica Embryos. Plant Molecular Biology Reporter 10285-293. 1992. |
| [25] | Illumina, “An introduction to Next-Generation Sequencing Technology.” www.illumina.com/technology/nextgeneration-sequencing.html (accessed Oct. 03, 2022). |
| [26] | Journal microbiology. Microbiology Aspergillus sp. 2005. |
| [27] | Kilich, M. Identification of clinically relevant Aspergillus. Medical Mycology. 44, 5127-5131. 2006. |
| [28] | Klingspor, L et al. Aspergillus PCR formidable challenges and progress. Medical Mycology, 47, S241 S247. 2009. |
| [29] | Lee, J. Simple Chemical Extraction Method for DNA Isolation from Aspergillus fumigatus and Other Aspergillus Species. Journal of clinical Microbiology. 2004. |
| [30] | Labbox, Introducción a la técnica de qPCR. Online. https://labbox.es/ 2024. |
| [31] | Lifeder. (18 de agosto de 2023). Aspergillus. Recuperado de: https://www.lifeder.com/aspergillus/ 2023. |
| [32] | Loredo, A., Tesis, Anáslisis genético de Aspergillus spp y su implicación en la identificación de hongos alatoxigenicos. 1997. |
| [33] | Loeffler, J, et al. Comparison between Plasma and Whole Blood Specimens for Detection of Aspergillus DNA by PCR. Journal of Clinical Microbiology. 2000. |
| [34] | Marchese S, et al. Aflatoxin B1 and M1: Biological Properties and Their Involvement in Cancer Development. Toxins. 2018. |
| [35] | Macrogen, Inc. /Shaun Seonwoo Lee. /Public Biotechnology Company. South Korea. https://dna.macrogen.com/2024 |
| [36] | Martinez-Soriano, J. Detection of Brucella abortus by means of the Polymerase Chain Reaction. Bioquimia 18: 10-16.57. 1993. |
| [37] | MERK qPCR. Online. https://www.merckmillipore.com/GT/es/life-scienceresearch/genomic-analysis/dna-preparationloning/PCR/qPCR/7Rub.qB.GXwAAAFEdVlXHZkB,nav?ReferrerURL=https%3A%2F%2Fwww.google.com%2F.2024 |
| [38] | Nitiu, D. Pigmentos sintetizados por hongos negros y su impacto en el deterioro del patrimonio documental en papel. Bol. Soc. Argent. Bot. 57: 169-184. 2022. |
| [39] | Palomares, J. Revista Iberoamericana de Micología - ISBN: 978-84-611-8776-8. 2007. |
| [40] | Rapaer Kb et al. The genus Aspergillus. Tratado de Micología Medica. 3a edic. pp 668-703. 1998. |
| [41] | Rippon. JW. Tratado de Micología Medica. 3ª edición Interamericana. Mc Graw Hill México. 1990. |
| [42] | Ruiz, I, Pulmonary aspergillosis. Rev. Med. Electrón. vol. 40 no. 4. 2018. |
| [43] | Salazar, C et al. Características morfológicas microscópicas de especies de Aspergillus asociadas a infecciones en humanos. Hechos Microbiol. 3(2); 93-96. 2012. |
| [44] | Sabino, R. Fungi Journal ofBrief Report Molecular Detection of Aspergillus: Application of a Real-Time PCR Multiplex Assay in Tissue Samples. 2020. |
| [45] | Sanger, F., Nicklen, S., & Coulson DNA sequencing withchain-terminating inhibitors. Proceedings of the National Academy of Sciences. 1977. |
| [46] | Samson, R. et al. Phylogeny, identification and nomenclature of the genus Aspergillus. studies in mycology 78: 141-173. 2014. |
| [47] | Sarria C. et al. Aspergillosis. Servicio clínico de Medicina Interna. Madrid. 2005. |
| [48] | Schaberciter-Gurtner et al. Molecular diagnosis of Aspergillus and Candida infections. J. clinic Microb. https://doi.org/10.1128/jcm-01344-06 2006. |
| [49] | The Aspergillus Website Fungical Resec trust. https://fungalinfectiontrust.org/what-we-do/the-aspergillus-website/ 2007. |
| [50] | UNAM. Asocian diversos tipos de cáncer con alimentos contaminados por aflatoxinas. Boletín UNAM-DGCS-420. 2013. |
[9-50]
. The fungus under study produces mycotoxins and bioactive peptides related to the lung diseases Aspergillosis. The growth in the tube with Sabororaud after weeks becomes flat velvety black. In a petri dish, when the colony is old, the conidia chains detach from the head, resembling a sharp fall, exposing only the gallbladder surrounded by an almost black halo. When viewed under a 40 x microscope, more than 20-30 abundant brown conidia are observed per field that are not stained with cotton blue lactophenol. As it has more than 1 to 2 months on Agar saboraud, it dries out with the medium and the entire colony shrinks, so the fungus does not sporulate but releases the spore. But conidia are viable, so if a pure crop is carried out in a new reseeding, the fungus grows again in optimal conditions. In the petri dish, growth is similar except that at first the mycelium is white and then turns black. No sclerotes, which is characteristic of the
Niger, are observed, but in our case it does not occur. Over time, more than a month, it turns velvety black.
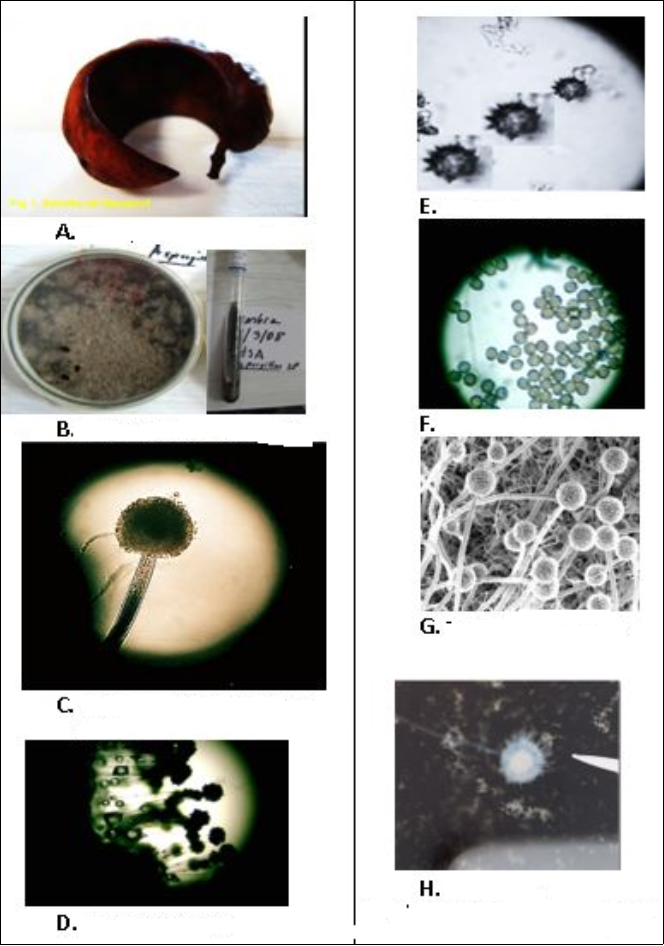
Figure 1 shows the phenotypic characterization described above.
Figure 1. Aspergillus uessalvadorensis. Phenotypic characterization. A.seem Nacascol, B. culture and tube Saboraud, C. Aspergillus conidial heads 100x, D. Microculture conidial head 100x, E. Conidia 100x, expanded, F. Conidia 100x, G y H. conidiophorus and vesicles conidial heads.
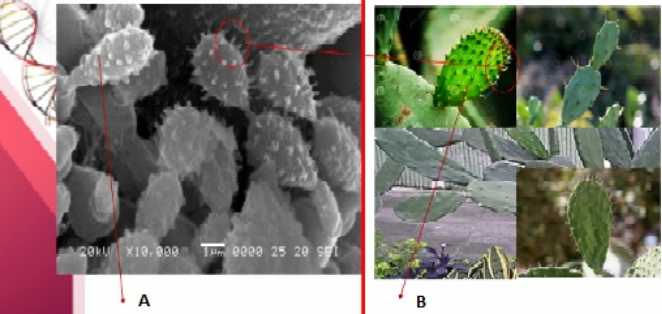
Figure 2. Comparison of species with natural cactus plant. A. Aspergillus uessalvadorensis. B. Cactus plant.
In
Figure 2, Comparison of the species with spicules conidia with the natural cactus plant that also observed spicules. These give it heat resistance and provide moisture. They can survive temperatures above 60-100 °C or more. The spines or spicules protect it from heat by providing moisture. In
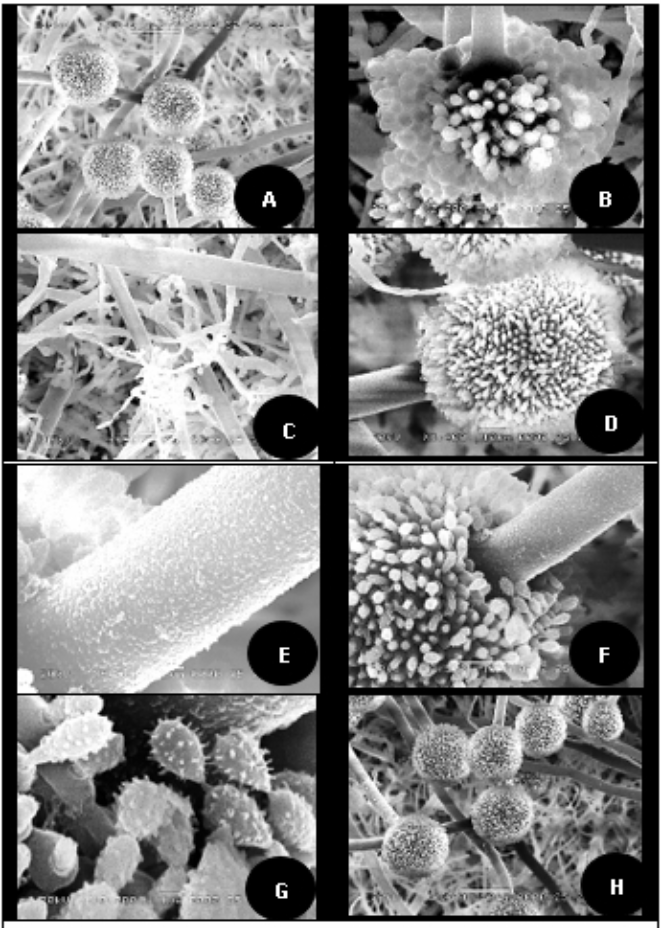
Figure 3, By the laboratory scanning electron microscopy method, it was found that two weeks after culture, conidia emerge from the uniseriate phylalides in the vesicle column. There was a rapid growth of sporulation within five minutes, within an hour there were millions of spores in 10 fields. The rough hyaline conidiophore with an ogl head and hyphae is observed, in
Figure 1 (C) elongation of the hyphae accumulated with filament and branching is observed. There are racket-shaped conidia
Figure 1 (G). This
Aspergillus is in a position to favor high temperatures since relative humidity stops the growth of fungi that produce these toxins temperature as aflatoxins, when exposed to heat it grows and is heat-resistant. Fungi are formed by a wall composed of 80% carbohydrates that constitutes 30% of the dry weight, this wall is rigid which allows it to be protected. Its chemical composition is based on proteins and glycoproteins in 10%, lipids in 8%, minerals such as calcium, magnesium and phosphorus. They have components of chitin, chitosans, peptidoglycans, and mannans. In the laboratory, chitin is softened with 40% potassium hydroxide for morphological study.
| [18] | Garraway, M. Fungal Nutrition and Physiology". John Wiley & Sons, Inc. (CanadA), 22-48. 1984. |
[18].
Mushrooms do not have cellulose in most of them, unlike vegetables.
Aspergillus has a very simple biological cycle, in which spores are formed for reproduction and after germination hyphae are formed, which will be the invasive forms of the fungus. The spores are found in the angiospore, so they have a high rate of sporulation and therefore their concentration in the environment is high. The size of the spores or conidia is 0.2 to 3.5 microns.
| [1] | Abarca, M. Taxonomía e identificación de especies implicadas en la aspergilosis nosocomial. Rev Iberoam Micología; 17: S79-S84. 2000. |
| [2] | Alcala, L et al. Aspergillus y Aspergilosis. Disponible https://revistas.unimilitar.edu.co/index.php/rfcb/article/view/5610/4915.2018 |
| [3] | Arenas. R. Micología Médica Ilustrada. 2ª edición, Interamericana. Mc Graw Hill. México.2003. |
| [4] | Atlas Virtual de Micología Medica. Depto de Microbiología. Universidad de Panamá. 2006. |
[1-4]
. The pulmonary alveolus is a sac that measures approximately 0.2 to 0.5 mm in diameter, it is smaller than the alveoli so they can be easily inhaled. They resist high temperatures due to their hard shell, some contain melanin that protects them from the heat and can travel miles away to other areas and colonize. They grow quickly in less than 5 days and have already matured.
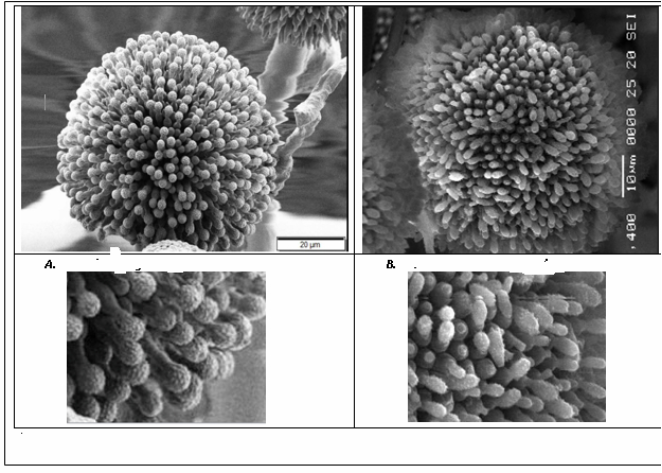
Figure 4 shows the heads of the A.niger and A.uessalvadorensis
species, in which the differences of
A.niger are observed, their head is round, radiated and biserialized with metula, while
A.uessalvadorensis they have the shape of an elongated columnar mallet at their end uniserial, without cetula. Multiple species and varieties of the genus
Aspergillus circulate around the world, Rapper and Fennell qualify around 900 species of
Aspergillus are known, which in 18 groups, of which only 12 are related to human diseases:
Aspergillus fumigatus (85%), A. flavus (5-10%), A. niger (2-3%), A. terreus (2-3%), A. versicolor, A. nidulans, A. glaucus, A. clavatus, A. cervinus, A. candidus, A. flavipes, and A. ustus et al.
| [2] | Alcala, L et al. Aspergillus y Aspergilosis. Disponible https://revistas.unimilitar.edu.co/index.php/rfcb/article/view/5610/4915.2018 |
| [3] | Arenas. R. Micología Médica Ilustrada. 2ª edición, Interamericana. Mc Graw Hill. México.2003. |
| [4] | Atlas Virtual de Micología Medica. Depto de Microbiología. Universidad de Panamá. 2006. |
| [5] | Baker. S. Aspergillus Níger genomics: past, present and into the future. Medical Micology September, 44, 517-521.2006. |
| [6] | Bille, G. et al. Aspergillus species isolated from clinical specimens: suggested clinical and microbiological criteria to determine significance. Clinic. Microbiology Infect. 4: 700-716.1998. |
| [7] | Bogdanov, K. V., & Ignat'eva, S. M. Klinicheskaia laboratornaia diagnostika, (10), 42-44.2009. |
| [8] | Broad Institute. Aspergillus Comparative Database. 2007. |
| [9] | Bolet, M. et all. Micotoxinas y cáncer. Rev Cubana Invest Bioméd v. 24 n. 1 Ciudad de la Habana. 2005. |
| [10] | Bustillo, Alex. Método para cuantificar suspensiones de esporas de hongos y otros organismos. https://doi.org/10.13140/RG.2.1.3594.5128. 2010 |
| [11] | Cao W, et all. Aflatoxin B1: metabolism, toxicology, and its involvement in oxidative stress and cancer development. Toxicol Mech Methods. 2022. |
| [12] | Casas, R. Micología General. 2da Edición. Universidad Central de Venezuela. Ediciones de la Biblioteca. Caracas. Online. 2010. |
| [13] | Conant, S. et al. Micología. 3ª edición. Interamericana. México. 1972. |
| [14] | Couri, S. et al. Digital Image processing a tool to monitor biomasss growth in Aspergillus niger 3TSB8 solid state fermentation: preliminary results. Journal of Microscopy vol 224. pt. pp 290-297. 2006. |
| [15] | Cruz, R. Micheli y el género Aspergillus. Rev. chil. infectol. [online]. 2023, vol. 40, n. 2, pp. 169-171. 2023. |
| [16] | Demeke, T and R. P. Adams. The UBe of PCR-RAPD Analysis in Plant Taxonomy and Evolution., p. 179-191. 1994. |
| [17] | Frisvad, J. Secondary metabolite profiling, growth profiles and other tools for species recognition and important Aspergillus mycotoxins, Studies in Mycology, Volume 59, Pages 31-37. 2007. |
| [18] | Garraway, M. Fungal Nutrition and Physiology". John Wiley & Sons, Inc. (CanadA), 22-48. 1984. |
| [19] | Gassiot C. et al. Aspergilosis pulmonar: un nuevo enfoque en la reemergencia. Acta Medica. 9(1-2): 67-72. 2000. |
| [20] | Geiser et al. Geiser DM, Klich MA, Frisvad JC, Peterson SW, Varga J, Samson RA (2007). The current status of species recognition and identification in Aspergillus. Studies in Mycology 59: 1-10. 2007. |
| [21] | Gibbons JG, Rokas A. The function and evolution of the Aspergillus genome. Trends MicrobiolJan; 21(1): 14-22. https://doi.org/10.1016/j.tim.2012.09.005 Epub 2012 Oct 17 2013. |
| [22] | Gmoser, J. A. et all. Filamentous ascomycetes fungi as a source of natural pigments. Fungal Biol. Biotechnol. 2017. |
| [23] | Hawksworth DL. Naming Aspergillus species: progress towards one name for each species. Medical Mycology 49: S70-S76. 2011. |
| [24] | Horn, P., and A. Rafalski. Non-Destructive RAPD Genetic Diagnostic of Microspore-Derived Brassica Embryos. Plant Molecular Biology Reporter 10285-293. 1992. |
| [25] | Illumina, “An introduction to Next-Generation Sequencing Technology.” www.illumina.com/technology/nextgeneration-sequencing.html (accessed Oct. 03, 2022). |
| [26] | Journal microbiology. Microbiology Aspergillus sp. 2005. |
| [27] | Kilich, M. Identification of clinically relevant Aspergillus. Medical Mycology. 44, 5127-5131. 2006. |
| [28] | Klingspor, L et al. Aspergillus PCR formidable challenges and progress. Medical Mycology, 47, S241 S247. 2009. |
| [29] | Lee, J. Simple Chemical Extraction Method for DNA Isolation from Aspergillus fumigatus and Other Aspergillus Species. Journal of clinical Microbiology. 2004. |
| [30] | Labbox, Introducción a la técnica de qPCR. Online. https://labbox.es/ 2024. |
| [31] | Lifeder. (18 de agosto de 2023). Aspergillus. Recuperado de: https://www.lifeder.com/aspergillus/ 2023. |
| [32] | Loredo, A., Tesis, Anáslisis genético de Aspergillus spp y su implicación en la identificación de hongos alatoxigenicos. 1997. |
| [33] | Loeffler, J, et al. Comparison between Plasma and Whole Blood Specimens for Detection of Aspergillus DNA by PCR. Journal of Clinical Microbiology. 2000. |
| [34] | Marchese S, et al. Aflatoxin B1 and M1: Biological Properties and Their Involvement in Cancer Development. Toxins. 2018. |
| [35] | Macrogen, Inc. /Shaun Seonwoo Lee. /Public Biotechnology Company. South Korea. https://dna.macrogen.com/2024 |
| [36] | Martinez-Soriano, J. Detection of Brucella abortus by means of the Polymerase Chain Reaction. Bioquimia 18: 10-16.57. 1993. |
| [37] | MERK qPCR. Online. https://www.merckmillipore.com/GT/es/life-scienceresearch/genomic-analysis/dna-preparationloning/PCR/qPCR/7Rub.qB.GXwAAAFEdVlXHZkB,nav?ReferrerURL=https%3A%2F%2Fwww.google.com%2F.2024 |
| [38] | Nitiu, D. Pigmentos sintetizados por hongos negros y su impacto en el deterioro del patrimonio documental en papel. Bol. Soc. Argent. Bot. 57: 169-184. 2022. |
| [39] | Palomares, J. Revista Iberoamericana de Micología - ISBN: 978-84-611-8776-8. 2007. |
| [40] | Rapaer Kb et al. The genus Aspergillus. Tratado de Micología Medica. 3a edic. pp 668-703. 1998. |
| [41] | Rippon. JW. Tratado de Micología Medica. 3ª edición Interamericana. Mc Graw Hill México. 1990. |
| [42] | Ruiz, I, Pulmonary aspergillosis. Rev. Med. Electrón. vol. 40 no. 4. 2018. |
[2-42]
. In general, the genus
Aspergillus has between 30-40 megabases (Mb), which is equivalent to about 30-40 million base pairs (bp) to be considered in a sequencing.
| [2] | Alcala, L et al. Aspergillus y Aspergilosis. Disponible https://revistas.unimilitar.edu.co/index.php/rfcb/article/view/5610/4915.2018 |
| [3] | Arenas. R. Micología Médica Ilustrada. 2ª edición, Interamericana. Mc Graw Hill. México.2003. |
| [4] | Atlas Virtual de Micología Medica. Depto de Microbiología. Universidad de Panamá. 2006. |
| [5] | Baker. S. Aspergillus Níger genomics: past, present and into the future. Medical Micology September, 44, 517-521.2006. |
| [6] | Bille, G. et al. Aspergillus species isolated from clinical specimens: suggested clinical and microbiological criteria to determine significance. Clinic. Microbiology Infect. 4: 700-716.1998. |
| [7] | Bogdanov, K. V., & Ignat'eva, S. M. Klinicheskaia laboratornaia diagnostika, (10), 42-44.2009. |
| [8] | Broad Institute. Aspergillus Comparative Database. 2007. |
| [9] | Bolet, M. et all. Micotoxinas y cáncer. Rev Cubana Invest Bioméd v. 24 n. 1 Ciudad de la Habana. 2005. |
| [10] | Bustillo, Alex. Método para cuantificar suspensiones de esporas de hongos y otros organismos. https://doi.org/10.13140/RG.2.1.3594.5128. 2010 |
| [11] | Cao W, et all. Aflatoxin B1: metabolism, toxicology, and its involvement in oxidative stress and cancer development. Toxicol Mech Methods. 2022. |
| [12] | Casas, R. Micología General. 2da Edición. Universidad Central de Venezuela. Ediciones de la Biblioteca. Caracas. Online. 2010. |
| [49] | The Aspergillus Website Fungical Resec trust. https://fungalinfectiontrust.org/what-we-do/the-aspergillus-website/ 2007. |
[2-12, 49]
.
Figure 3. Aspergillus uessalvadorensis Scanning electron microphotography. Courtesy of CENSALUD by Dr. Vianney de Abrego. A.Morphology Aspergillus, B. vesicle, C: Zapata, elongation of hyphae with filament and branching D. Head of conidia, E. rough codiophore, F. globose and fialide vesicle, G. conidia, H. head of columnar conidials and conidophore.
Figure 4. Heads: radial globose vesicle of the species A. niger and B columnar globose vesicle of A. uessalvadorensis.
3.2. Genotypic Characterization
1) PCR preliminar
In
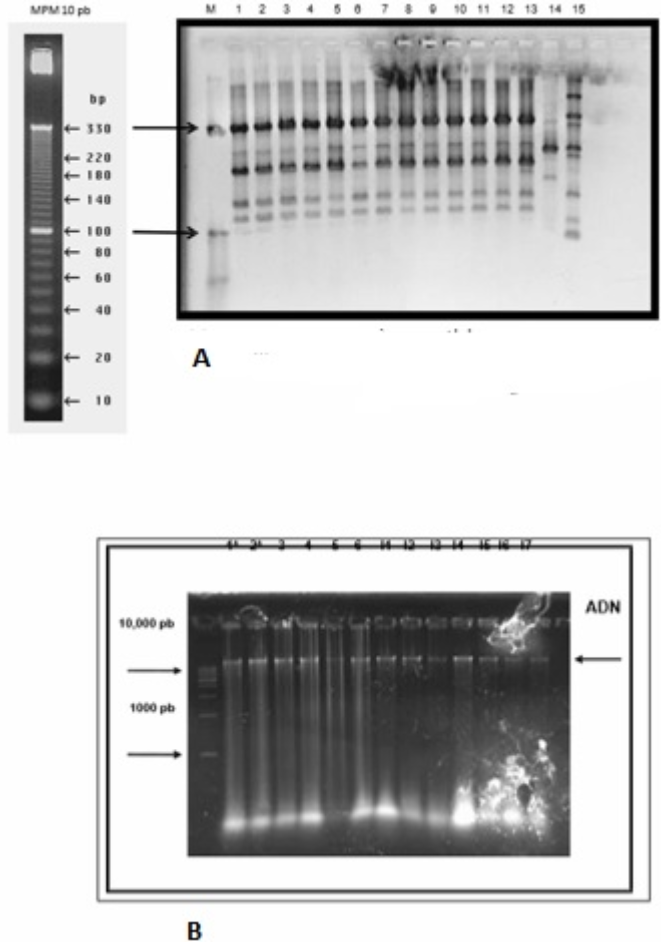
Figure 5. The PCR of the sample of the species is observed, in which it stands out in the first place that it is of the genus
Aspergillus spp. In agarose gel, PCR products or amplicons are represented by bands of a specific size and compared to a known molecular weight marker to determine the specificity of the reaction. PB = number of base pairs. Several samples are observed and several species comparable to the study sample are highlighted.
Figure 5. PCR sample of different species. El Salvador. A. Aspergillus uessalvadorensis. B. Others species. Source: Institute of Molecular Biology. México.
2) PCR
3) gDNA extraction.
4) gDNA extraction Aspergillus
Figure 6. Aspergillus sp gDNA extraction MACROGEN INC. 2024.
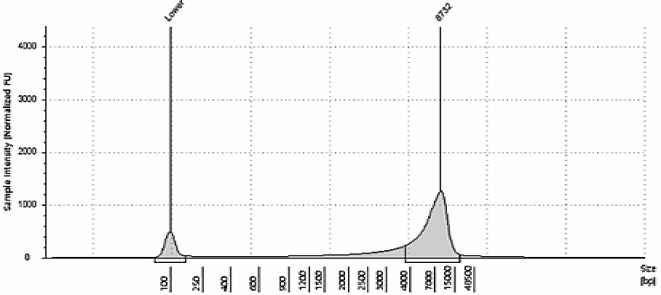
Analysis. In
Figure 6. The extraction of gDNA from the TapeStation gDNA Screen Tape was observed, obtaining a maximum concentration of 12.297 ng/ul, volume 30 ul, total quantity 0.369 and DIN 6.4 maximum level 8732 sample intensity for 15000 bp in quality control. This indicates that the sequencing and identification of the fungus may continue. In the first corner, the sample of its load was insufficient. It refers to DNA extracted from cells or mycelium, which contains the complete genetic information of an organism based on the quantity, quality, or characteristics of the total DNA extracted from a sample before sequencing. Primers should be specially designed to ensure high specificity and generate amplicons ranging in size from 100 to 150 bp. A high concentration: Indicates a good amount of extracted DNA, which is essential for sequencing. If there is not enough DNA, the quality of the sequencing can be compromised. Low concentration: It may indicate problems with extraction or that the sample has a low amount of DNA. Genomic gDNA is the DNA that contains the complete genetic information of an organism, including all the genes and regulatory regions present in its genome.
5) qPCR technique.
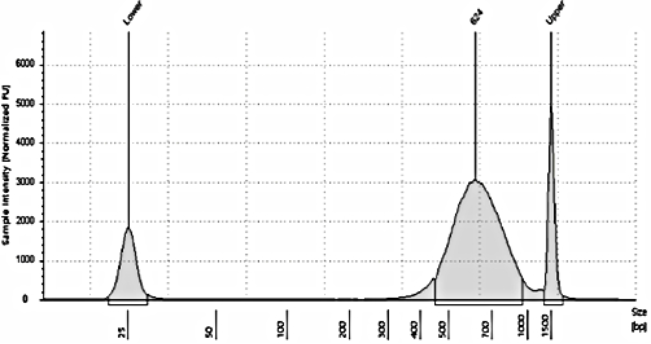
Figure 7. qDNA. Aspergillus uessalvadorensis MACROGEN INC. 2024.
In
Figure 7. It is observed from the sample sent from El Salvador of the LightCycle qPCR, 624 bp were obtained at a concentration of 103.24 nM and 41.87 ng/ul with the TruSeq Nano DNA (350_META) library, indicating that the test goes to the next stage, which is the construction with 32 library kits ranging from 5 to 10 nM on the NovaSeq platform. It refers to quality and indicates a DNA preparation that has been treated and analyzed that meets certain standards of purity and quality, which is essential for applications in molecular biology, such as DNA sequencing or PCR. This involves the isolation of high-quality DNA using methods such as spectrophotometry or gel electrophoresis. Indicates that at high concentrations: DNA samples >10 ng/μL are ideal for sequencing, as they ensure that there is enough genetic material to generate accurate readings. On the other hand, at low concentrations: they may require additional concentration or repeat extraction to ensure sufficient DNA for analysis. To sequence a fungus a number of base pairs needed to sequence fungi can vary depending on the objective of the study and the type of sequencing being used. To get proper coverage of a fungus's entire genome, millions of base pairs usually need to be sequenced. The exact amount depends on the size of the fungus's genome in question. For example, fungal genomes can range from a few megabases to more than 100 Mb megabases. If you want to sequence specific regions or certain genes, the number of base pairs required will be much lower. This could be on the order of thousands or millions of base pairs, depending on the number of regions of interest. In other words, it is quantified DNA.
| [21] | Gibbons JG, Rokas A. The function and evolution of the Aspergillus genome. Trends MicrobiolJan; 21(1): 14-22. https://doi.org/10.1016/j.tim.2012.09.005 Epub 2012 Oct 17 2013. |
| [22] | Gmoser, J. A. et all. Filamentous ascomycetes fungi as a source of natural pigments. Fungal Biol. Biotechnol. 2017. |
| [23] | Hawksworth DL. Naming Aspergillus species: progress towards one name for each species. Medical Mycology 49: S70-S76. 2011. |
| [24] | Horn, P., and A. Rafalski. Non-Destructive RAPD Genetic Diagnostic of Microspore-Derived Brassica Embryos. Plant Molecular Biology Reporter 10285-293. 1992. |
| [25] | Illumina, “An introduction to Next-Generation Sequencing Technology.” www.illumina.com/technology/nextgeneration-sequencing.html (accessed Oct. 03, 2022). |
| [26] | Journal microbiology. Microbiology Aspergillus sp. 2005. |
| [27] | Kilich, M. Identification of clinically relevant Aspergillus. Medical Mycology. 44, 5127-5131. 2006. |
| [28] | Klingspor, L et al. Aspergillus PCR formidable challenges and progress. Medical Mycology, 47, S241 S247. 2009. |
| [29] | Lee, J. Simple Chemical Extraction Method for DNA Isolation from Aspergillus fumigatus and Other Aspergillus Species. Journal of clinical Microbiology. 2004. |
| [30] | Labbox, Introducción a la técnica de qPCR. Online. https://labbox.es/ 2024. |
| [31] | Lifeder. (18 de agosto de 2023). Aspergillus. Recuperado de: https://www.lifeder.com/aspergillus/ 2023. |
| [32] | Loredo, A., Tesis, Anáslisis genético de Aspergillus spp y su implicación en la identificación de hongos alatoxigenicos. 1997. |
| [33] | Loeffler, J, et al. Comparison between Plasma and Whole Blood Specimens for Detection of Aspergillus DNA by PCR. Journal of Clinical Microbiology. 2000. |
| [34] | Marchese S, et al. Aflatoxin B1 and M1: Biological Properties and Their Involvement in Cancer Development. Toxins. 2018. |
| [35] | Macrogen, Inc. /Shaun Seonwoo Lee. /Public Biotechnology Company. South Korea. https://dna.macrogen.com/2024 |
| [36] | Martinez-Soriano, J. Detection of Brucella abortus by means of the Polymerase Chain Reaction. Bioquimia 18: 10-16.57. 1993. |
| [37] | MERK qPCR. Online. https://www.merckmillipore.com/GT/es/life-scienceresearch/genomic-analysis/dna-preparationloning/PCR/qPCR/7Rub.qB.GXwAAAFEdVlXHZkB,nav?ReferrerURL=https%3A%2F%2Fwww.google.com%2F.2024 |
[21-37]
.
6) cDNA library
33 bookcase kits were used. It refers to evaluating the quality and representativeness of the cDNA library prepared for sequencing. This technique is often used to create a complementary DNA copy of mRNA from a specific organism. It also refers to the visualization of the quantity and/or quality of double-stranded DNA extracted from a sample for subsequent analysis, such as sequencing. If the fragments are short: it is an indication of RNA degradation or inefficient library preparation. If fragments are long: indicates problems in RNA fragmentation during preparation. That is, it refers to complementary DNA. This type of DNA is generated from messenger RNA (mRNA) through a process called reverse transcription. cDNA is used to create a sequencing library. cDNA fragments are prepared by adding adapters to their ends. These adapters allow fragments to bind to the surface of the cell stream and amplify during the sequencing process.
7) dsDNA
Refers to double-stranded DNA, if it has a high concentration: A high value on the graph indicates a good amount of double-stranded DNA, which is ideal for sequencing. For example, concentrations above 10 ng/μL are generally considered suitable for most sequencing techniques. If it is low concentration: indicates problems with DNA extraction and may require additional concentrations. That is, double-stranded DNA is denatured into single-stranded DNA to allow the reading of nucleotide sequences. During sequencing, these DNA fragments are amplified and read to determine the correct nucleotide sequence. In Macrogen it is the FASTQ Files that contain the nucleotide sequences read directly from the sequencing machine, accompanied by quality information. Metagenome Shotgun Sequencing Report 2024.09 (SMSR):
Figure 8. dsDNA extraction.
1) Total bases of a genome: bp. a value of 11,705,895,990 bp is reported. This value indicates in the context of DNA refers to the total amount of nucleotides (or nitrogenous bases) present in a DNA sample. In this case, it could indicate the total amount of bases in picomoles, or some other quantitative measure, that are present in the sample being tested. That is, count of how many guanines, cytokines and adenine and thymines in the sample. That is, 5,735,889,035.1 were GCs that contain this number of nucleotides that contain the GC nitrogenous base and 5,852,947,995 were AT, that is, there is this number of nucleotides that contains the AT nitrogenous base. In percentage, the total bases sequenced in Gb expressed as a percentage was 11.7, that is, the total amount of nucleotides or nitrogenous bases present in the DNA sample. In its effect, 11.7 the total amount of picomoles present in the analyzed sample.
2) -Total readings: Value. 77,522,490. This could indicate that a total of 77,522 reads have been recorded. 77,522,490 reads are produced and the total read bases are 11.7 Gbp. In other words, 66% of DNA reads is the proportion of sequences that were successfully read from the DNA fragments that have been sequenced and then assembled or aligned to reconstruct the entire sequence. This percentage also indicates that it has been sequenced correctly and has generated quality data and the remaining 34% could correspond to failed or low quality readings or that could not be aligned or assembled correctly.
3) GC/AT Content: has a GC % 49.7 and AT % 50.30. It indicates that there is 49.7% guanine-cytokine and 50.30% adenine-thymine.
4) GC Content: has a value (%) of 49.7% suggests a considerable balance between GC and AT base pairs, which can influence the stability and properties of the DNA sequence. GC percentage: 50%. It indicates that 50% of the bases in the DNA sequence are guanine or cytosine, while the remaining 50% are adenine or thymine. This percentage is a measure of the balance between these two types of base pairs in a sequence.
5) AT Content: The value "55.0 AT %" refers to the percentage of adenine-thymine (AT) base pair content in a DNA sequence. That is, the composition of DNA, the bases adenine (A) and thymine (T), pair with each other by two hydrogen bonds. The AT content in a DNA sequence refers to the ratio of adenine and thymine bases compared to the guanine and cytosine bases. An AT percentage of 50.0 AT %" means that 50% of the bases in the DNA sequence are adenine or thymine, while the remaining 50% corresponds to guanine or in In general, a percentage of 50.0% AT in a DNA sequence indicates that most of the sequence is made up of adenine-thymine base pairs, with a balance in the base pairs.
6) The Q20 and Q30 metrics: their value is Q 20 95.1 and Q 30 88.3. A Q value of 20 of 95.1 indicates that it has a high score, which is good, because if it were low it would indicate low quality which did not happen.
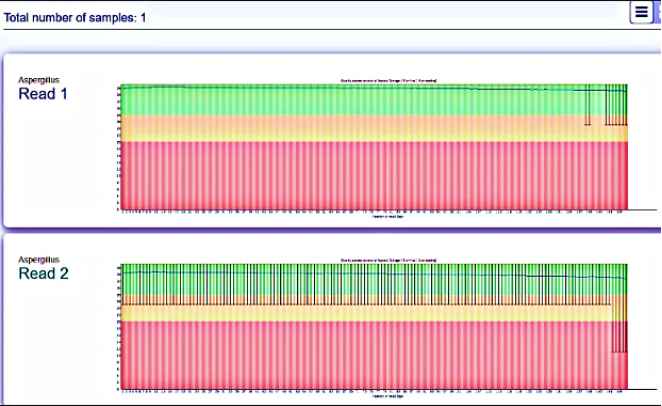
Quality per cycle:
Figure 9. Macrogen Cycle Data Quality.
In
Figure 9, reading 1 reading 2 indicates the degree of identification in each of these cycles. It is commonly represented on a graph where the X-axis shows the cycles at positions in the sequence, and the Y-axis shows a measure of quality, often in the form of a quality score such as the Q-value. It is a quality analysis performed by FASTQC for raw readings of the Aspergillus genome. At the top it refers to quality. In the lower part it is observed in the direction 5" to 3 " and vice versa in the opposite direction. X-axis is the bases and the Y-axis is the value of Q30. The colors represent quality, so green indicates high quality, yellow indicates intermediate quality and low quality pink. A high quality value per cycle suggests that the sequencing is accurate and that the bases in that specific cycle are correctly identified. A low value could indicate problems with reading at that point, such as sequencing errors or problems with the sample.
1) Raw data. They report a value. 38,761,245 n is the number of reads or fragments of DNA that were generated during the experiment.
2) Adapter quality and trimming. (Quality and adapter trim.). They report a value of 32,535,420 that unwanted adapters were removed.
3) Elimination of contaminants. (Contaminant removal). They report a value of 30,961,740. It refers to 30,961,740 as a high value that was identified as contaminants and immediately eliminated during the sequencing process. These contaminants can include unwanted sequences, such as DNA from bacteria, viruses, or even unwanted human DNA fragments if you are working with a sample from another organism. Contaminant removal is a crucial step in analyzing sequencing data to ensure that the results are accurate and reflect only the sequences of interest. This helps to improve the quality and reliability of the final data used in subsequent studies.
4) Quality control of previous reading. (QC passed read). They report a value of 79.88 indicating that it was accepted as good performance of the process.
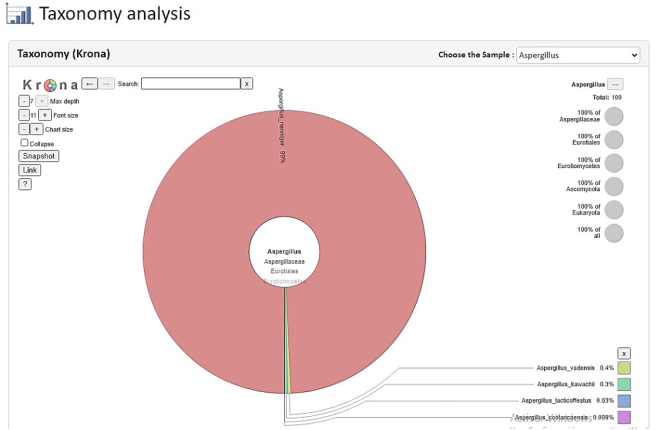
Taxonomic analysis: - Krona taxonomy:
Figure 10. Taxonomy Krona. Aspergillus sp. MACROGEN.
In
Figure 10 Analysis: From the sequencing report, there are varieties similar to the sample, 99%
of Aspergillus neoniger. Aspergillus vadensis 0.4%, Aspergillus kawachii 0.3%, Aspergillus lacticoffeatus 0.03% and Aspergillus costaricaensis 0.009%. Molecular bioinformatics analysis showed that it is another similar species not discovered and described in EL SALVADOR compared to other species. It is clarified that the report is circular DNA.Molecular analysis. Aspergillus from the sample sent from El Salvador. For molecular analysis, the following programs were used: BLAST Basic Local Alignment Search Tool, MEGA 11 Molecular Evolutionary Genetics Analysis, CLUSTAL OMEGA Multiple Sequence Alignment program, Nucleotid BLAST program, GENEBANK Genetic Sequence database and others no less important. By analysis of molecular studies with the Clustal Omega Multiple Sequence Alignment (MSA) program. It was determined that the strain is of the genus Aspergillus but its species is similar but not the same as that reported by DNA type.
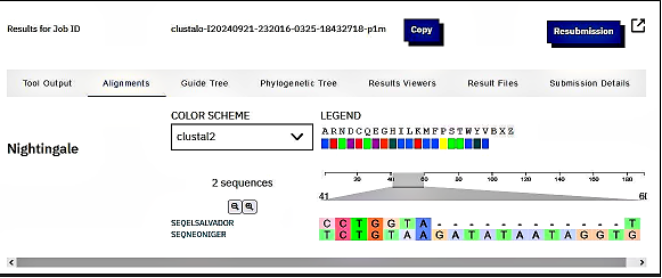
Figure 11. Genome comparison of the species of El Salvador and that reported by DNA type according to the base sequence.
Figure 11 shows that a segment of DNA sequences from El Salvador 1 with the sequence from the species Neoniger 2 is not the same. The similarity between the Cytokine and Guanine bases can be seen in the graph, it is not a higher percentage that varies in range between 40 and 60 that of El Salvador in relation to the neoniger strain that is between 41 and 60 nucleotides of Pb. That is, CC, GG and AA coincide in 0.15% with that of the neoniger species reported by DNA type. White spaces are gaps that do not match the neoniger species.
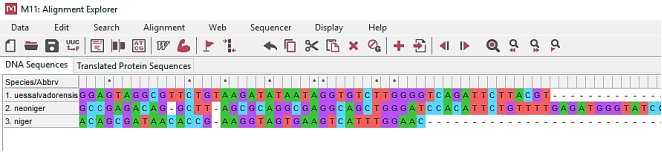
Type of relationship between the species uessalvadorensis, neoniger and niger.
Figure 12. Relationship between the species uessalvadorensis, neoniger and niger.
In
Figure 12 it can be seen that the three species do not coincide in the sequence, but only in 8 aligned cases that are marked with an asterisk they coincide in the sequence of GGG, CCC, AAA, TTT preserving a relationship but the rest of the bases are different. So the three species are not the same in the guidelines, so they may have had mutations or non-conserved regions.
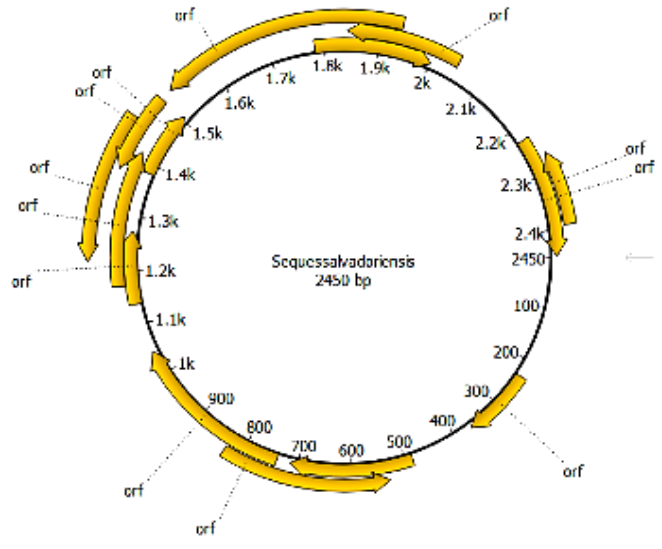
Aspergillus Open Reading Frame Sample from El Salvador
Figure 13. ORF plot of the sequence Sequessalvadorensis of 2450 bp.
In
Figure 13 is a circular ORF (Open Reading Frame) graph involves interpreting the graphical representation of the reading frames in a biological context, usually in genome studies. Circular Structure: The graph is usually circular as well as the results are circular DNA, representing the DNA sequence. The points or segments in the circle correspond to different regions of the DNA. Reading Frames: Look for open reading frames, which are marked and presented as lines or blocks. Each ORF represents a possible coding sequence for a protein. Direction: Observe the direction of the ORFs. They can be in the direct chain (5' to 3') or in the complementary chain (3' to 5'). This indicates how they are transcribed and translated. Size: ORFs of different lengths can indicate different coding potentials. Generally, a longer ORF is more likely to encode a functional protein. In a pie ORF chart, "1.7k" usually refers to the length of an open reading frame (ORF) measuring 1,700 base pairs (bp) in length. The "k" stands for "kilo," which in this case means a thousand. This implies that the ORF in question could encode a protein, and its length is relevant to understanding its potential function. An ORF of 1.7k is relatively long and could be indicative of a gene encoding a protein of significant size. In a pie ORF chart, arrows usually have specific meanings related to the genetic information represented. According to Transcription Direction: Arrows indicate the direction in which DNA is transcribed to RNA. Normally, they point from 5' to 3', which is the direction in which RNA is synthesized. Gene orientation: They can show whether the gene is in the sense chain or in the chain complementary (antisense). An outward arrow in the circle indicates a gene in the direct strand, while an inward arrow may represent a gene in the complementary strand. Promoter or Terminator Signals: Some arrows can point to the location of promoters or terminators, which are regulatory elements that control gene transcription. Relationship between ORF: In more complex graphs, arrows can connect different ORFs or genes, indicating functional or regulatory relationships between them. On a pie ORF chart, arrows pointing to to the left or right usually indicate the direction of transcription of the open reading frames (ORF). Here's more about what it means: Right arrows: They indicate that the corresponding ORF is located on the DNA strand in the 5' to 3' direction, which means that it is being transcribed from that strand This is considered the sense or direct string. Arrows to the left: Indicate that the ORF is in the complementary chain, transcribed in the direction 3' to 5'. This chain is known as antisense. In short, the direction of the arrows provides information about how RNA is synthesized from DNA and the orientation of genes in the genome is oriented in the opposite direction to other genes in the same region of the genome.
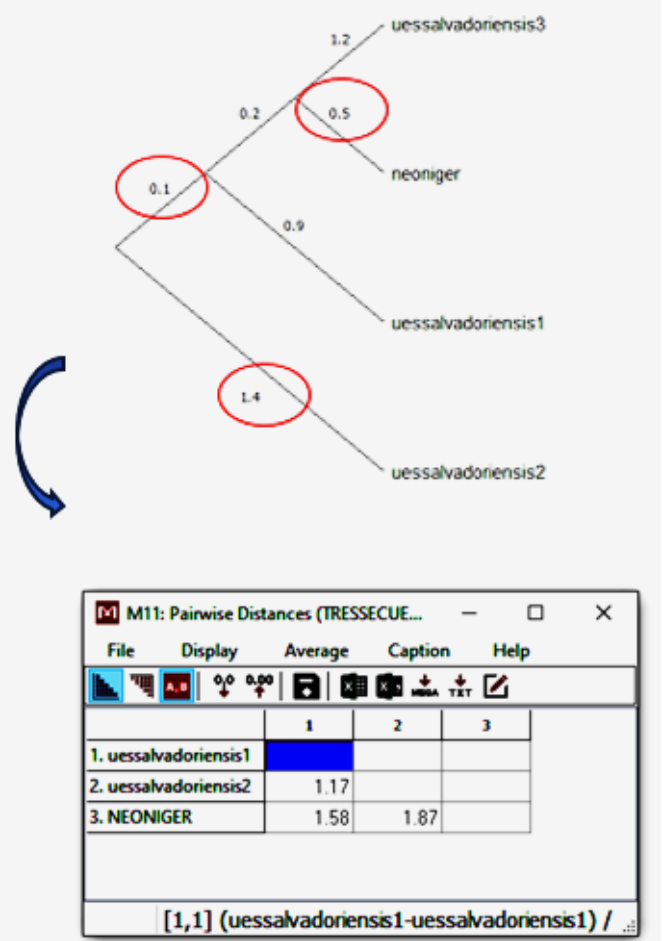
Figure 14. Aspergillus evolution phylogeny.
In
Figure 14 Evolutionary analyses were performed in MEGA11. It indicates a DNA or RNA sequence from different samples, probably from a genetic analysis. Each line appears to represent a different sequence, with a species or sample name followed by the nucleotide sequence and its length. uessalvadoriensis2 and uessalvadoriensis1 they seem to refer to samples of a species that could be endemic to El Salvador, given the name among varieties identified as neoniger could refer to another species or sample, possibly an organism that has been studied in the same context. The numbers at the end of each line could indicate the length of the sequence in bases. The numbers (1.17, 1.58, 1.87): These could be values that represent some measure, such as genetic distance, divergence between sequences, or some other type of comparison (such as substitution rates or diversity measures). In this context, they could indicate the similarity or genetic difference between the samples. Numbers such as 1.17, 1.58, and 1.87, in the context of a genetic analysis, are usually interpreted as measurements of genetic distance between the DNA sequences of the samples. Genetic distance: These numbers usually represent the amount of nucleotide changes or differences between sequences. A lower number suggests greater genetic similarity, while a higher number indicates that the sequences are more different. Scale: The scale of distances can vary depending on the method used to calculate them (e.g., Kimura distance, Jukes-Cantor distance, etc.).
It is important to know which method was used to correctly interpret the values. Comparisons: If the sequence uessalvadoriensis1 and uessalvadoriensis2 are 1.17 apart, this could indicate that they are quite similar genetically. On the other hand, when comparing uessalvadoriensis1 with neoniger there is a distance of 1.58, which suggests that there is a notable difference between them. A distance of 1.87 between uessalvadorensis2 and neoniger indicates an even greater difference, which could mean that these two species are more distant evolutionarily. Evolutionary interpretation: These distances can provide information about the evolutionary history of species, helping to build phylogenetic trees that show the relationships between species. In the context of phylogeny, a "position" of 58 usually refers to a specific location on a phylogenetic tree, which is a graphical representation of the evolutionary relationships between different species or groups. According to the position number: It can indicate that a species is ranked 58th in the phylogenetic tree. This means that, when counting from the root of the tree to the leaves (the most modern species), that particular species is in the 58th position, indicating that there has been an evolutionary divergence. Branch length: In some phylogenetic trees, numbers may be related to branch length, indicating the amount of genetic changes that have occurred in that evolutionary line. Sequence identification: If you're analyzing a dataset, the number 58 could be a reference to a specific sequence, making it easier to identify in analysis. Comparative analysis: It can be used to facilitate comparison between species or groups in studies where they have been ordered according to their genetic characteristics. We have uessalvadorensis1 - uessalvadorensis2: The distance is 18.62, which indicates that there is a relatively small evolutionary difference between these two sequences. uessalvadorensis1 - neoniger2: The distance is 20.29, which also indicates a moderate evolutionary difference. uessalvadorensis2 - neoniger2: The distance is 32.89, suggesting a greater evolutionary difference compared to the previous pairs. Last row (neoniger): There seems to be an additional value that includes a comparison with neoniger. The distances indicate how the neoniger sequences are related to the other two: neoniger - uessalvadoriensis1: 40.58, neoniger - uessalvadoriensis2: 42.65, neoniger - neoniger2: 50.41. General interpretation: Lower numbers indicate that sequences are more closely related evolutionarily, while higher numbers suggest greater divergence. This could be used to infer phylogenetic relationships, such as which species are most closely related to each other and how they have evolved over time. The farther away they are from the horizontal axis, the more they tell us that there are genetic differences between the others and that they have evolved. Of the proteins studied in Aspergillus, Protein A was found 594 times, which represents 24.24% of the total observations. Protein B: Not found in any observations, meaning its percentage is 0.00%.