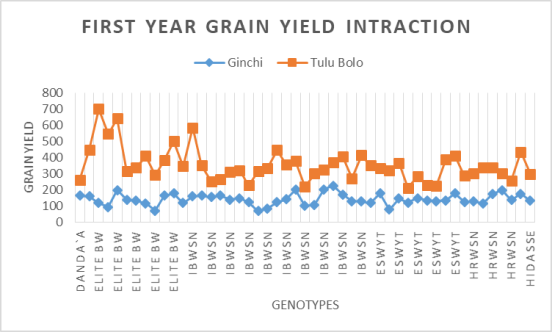
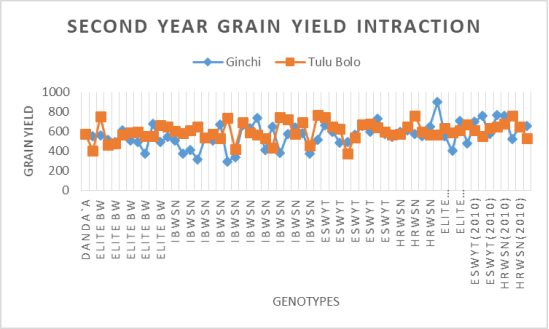
Due to a serious waterlogging issue, Ethiopia's agricultural productivity has been severely limited, yielding much lower than expected results. In this study conducted on screening of 49 for first year and 60 for second year bread wheat genotypes selected from international nursery. An experiment was undertaken at two locations namely, Ginchi Agricultural Research Sub Center and Tulu Bolo farmer field in Ethiopia in 2018/19 and 2019/20 cropping seasons. The main objective of this study was to select best performed genotypes in waterlogged areas for next variety development and future breeding program. The experiment was conducted using apha lattice with three replications. Data on yield and associated traits were collected and analyzed using SAS version 9.3 software. The results revealed that the separate analysis of variance over the two years conducted at Ginchi showed statistically significant (P ≤ 0.01) differences among the genotypes for all phenotypic traits except Septoria disease severity, Number of tiller and biomass yield considered in this study. The results revealed that the separate analysis of variance over the two years conducted at Tulu bolo showed statistically non-significant (P <0.01) differences among the genotypes for all phenotypic traits except days to heading, plant height, Septoria disease severity agronomic score, hectoliter weight and thousand kernel weight considered in this study. In general from the two locations the maximum and minimum were revealed 29.85qt/ha and 2.32qt/ha respectively. This indicated that almost all genotypes were showed low performed and the wheat breeder give more attentions to provide resistance genotypes for waterlogging.
| Published in | Plant (Volume 12, Issue 2) |
| DOI | 10.11648/j.plant.20241202.11 |
| Page(s) | 19-24 |
| Creative Commons |
This is an Open Access article, distributed under the terms of the Creative Commons Attribution 4.0 International License (http://creativecommons.org/licenses/by/4.0/), which permits unrestricted use, distribution and reproduction in any medium or format, provided the original work is properly cited. |
| Copyright |
Copyright © The Author(s), 2024. Published by Science Publishing Group |
Alpha Lattice, Bread Wheat, Low Oxygen, Waterlogging
2.1. Description of the Experimental Site and Materials
2.2. Data Collected
2.3. Statistical Analysis
Traits (y) | MSG /48/ | MS Rep /2/ | MS Blk /Rep/ | MSE /78/ | Mean | CV (%) | R2 | LSD (5%) |
|---|---|---|---|---|---|---|---|---|
PTH | 48.200847** | 425.170068** | 36.585477ns | 23.817794 | 59.32 | 8.23 | 0.68 | 7.9331 |
SDS | 52.128324ns | 119.047619ns | 98.400399ns | 76.80382 | 93.95 | 9.33 | 0.44 | 14.246 |
NT | 0.51053470* | 0.49884354ns | 0.59716284* | 0.30230831 | 3.14 | 17.50 | 0.61 | 0.8938 |
AgrSc | 0.60191653** | 1.52714286** | 0.80907900** | 0.24156785 | 2.28 | 21.52 | 0.71 | 0.7989 |
TKW | 16.3534714** | 12.7259864* | 13.6729305** | 2.899256 | 33.21 | 5.13 | 0.84 | 2.7678 |
GYLD | 3746.0952** | 1813.5580ns | 3579.3196ns | 2098.6094 | 142.05 | 32.25 | 0.60 | 74.466 |
Traits | MSG /59/ | MS Rep /2/ | MS Blk /Rep/ | MSE /91/ | Mean | CV (%) | R2 | LSD (5%) |
|---|---|---|---|---|---|---|---|---|
DHT | 21.998534** | 1.688889ns | 2.526015ns | 2.187763 | 67.94 | 2.18 | 0.90 | 2.3989 |
PTH | 45.794783* | 350.138889** | 41.109176ns | 29.924261 | 71.78 | 7.62 | 0.67 | 8.8721 |
SDS | 21.096429ns | 62.751936* | 25.157039ns | 19.864004 | 10.99 | 40.54 | 0.56 | 7.2285 |
AgrSc | 0.24313565** | 4.09305556** | 0.35156390** | 0.12258238 | 2.49 | 14.07 | 0.75 | 0.5678 |
NT | 0.39474340ns | 1.68888889* | 0.45970676ns | 0.47849970 | 2.83 | 24.46 | 0.50 | 1.1219 |
BMY | 0.33084466ns | 8.13872722** | 0.52256717ns | 0.33374174 | 1.66 | 34.86 | 0.64 | 0.937 |
TKW | 36.003740** | 10.006722ns | 17.021634* | 9.373950 | 35.77 | 8.56 | 0.79 | 4.9657 |
HLW | 40.557375** | 1.514056ns | 22.244720** | 10.985195 | 73.49 | 4.51 | 0.76 | 5.3755 |
GYLD | 35888.656** | 109781.264** | 67392.547** | 19584.766 | 562.23 | 24.89 | 0.72 | 226.97 |
Traits | MSG /48/ | MS Rep /2/ | MS Blk /Rep/ | MSE /78/ | Mean | CV (%) | R2 | LSD (5%) |
|---|---|---|---|---|---|---|---|---|
PHT | 29.507773ns | 269.695578** | 104.631273** | 25.768110 | 67.60 | 7.51 | 0.70 | 8.2515 |
SDS | 77.712143ns | 31.422433ns | 129.468431ns | 64.13564 | 13.11 | 61.08 | 0.54 | 13.018 |
AgrSc | 0.32192203ns | 0.93367347* | 1.09466434** | 0.26617985 | 2.10 | 24.54 | 0.70 | 0.8386 |
TKW | 31.412318** | 69.955397** | 33.724583** | 8.631548 | 41.50 | 7.08 | 0.79 | 4.7757 |
HLW | 70.546267ns | 96.503929ns | 261.781460** | 48.36552 | 68.82 | 10.11 | 0.71 | 11.305 |
GYLD | 19319.960ns | 81095.754ns | 87459.863** | 20903.992 | 353.18 | 40.94 | 0.67 | 235.02 |
Traits | MSG /59/ | MS Rep /2/ | MS Blk /Rep/ | MSE /91/ | Mean | CV (%) | R2 | LSD (5%) |
|---|---|---|---|---|---|---|---|---|
DHT | 8.4936059** | 3.0055556* | 0.7695668ns | 0.7019478 | 71.06 | 1.18 | 0.90 | 1.3588 |
PTH | 58.029244** | 55.972222ns | 91.177073** | 25.197157 | 82.56 | 6.08 | 0.76 | 8.1413 |
SDS | 48.198014* | 84.752761ns | 33.678239ns | 31.578602 | 10.23 | 54.92 | 0.59 | 9.1141 |
AgrSc | 0.26926318** | 0.08888889ns | 0.24538579** | 0.10655831 | 3.01 | 10.84 | 0.72 | 0.5294 |
NT | 1.44992206ns | 10.15555556** | 2.27410953ns | 1.4537135 | 4.54 | 26.56 | 0.58 | 1.9555 |
BMY | 0.22672808ns | 0.41921056ns | 0.37503897ns | 0.19784022 | 1.85 | 24.05 | 0.59 | 0.7214 |
TKW | 22.097706** | 4.546889ns | 7.232008* | 3.868593 | 33.99 | 5.79 | 0.83 | 3.19 |
HLW | 17.171893** | 4.956292ns | 15.444858ns | 9.910490 | 76.34 | 4.12 | 0.61 | 5.1058 |
GYLD | 17920.150ns | 74288.237** | 64260.077 | 14081.945 | 602.19 | 19.71 | 0.72 | 192.46 |
| [1] | Amri, M., El, Ouni, M. H and Salem, M. B., 2014. Waterlogging affect the development, yield and components, chlorophyll content and chlorophyll fluorescence of six bread wheat genotypes (Triticum aestivum L.)." Bulg. J. Agric. Sci 20(3), 647-657. |
| [2] | Bekele H, Verkuiji W, Mawangi T., 2000. Adaptation of improved heat technologies in Addaba and Doddola Worede’s of the Bale highlands of Ethiopia. CIMMYT/EARO, Addis Ababa, Ethiopia. |
| [3] |
Central Statistics Agency for Ethiopia. Agricultural sample survey of area and production of major crops. Available from:
https://www.statsethiopia.gov.et/ (Accessed 2022 Jul 15) |
| [4] | Collaku, A. and Harrison, S. A., 2002. Losses in wheat due to waterlogging. Crop Science, 42(2), pp. 444-450. |
| [5] | Condon, A. G. and Giunta, F., 2003. Yield response of restricted-tillering wheat to transient waterlogging on duplex soils. Australian Journal of Agricultural Research, 54(10), pp. 957-967. |
| [6] | Hanson H, Borlaug NE and Anderson RG, 1982. Wheat in the third world. West view press. 192p. |
| [7] | Ma, Y., Zhou, M., Shabala, S. and Li, C., 2016. Exploration and utilization of waterlogging-tolerant barley germplasm. Exploration, Identification and Utilization of Barley Germplasm, pp. 153-179. |
| [8] | SAS. 2012. Statistical analysis system, version 9.3 editions. SAS Institute Inc. Cary, NC. |
| [9] | Sears, E. R., 1966. Nullisomic-tetrasomic combinations in hexaploid wheat. In Chromosome Manipulations and Plant Genetics: The contributions to a symposium held during the Tenth International Botanical Congress Edinburgh 1964 (pp. 29-45). |
| [10] | Singh, G., Kumar, P., Gupta, V., Tyagi, B. S., Singh, C., Sharma, A. K. and Singh, G. P., 2020. Characterizing waterlogging tolerance using multiple selection indices in bread wheat (Triticum aestivum). The Indian Journal of Agricultural Sciences, 90(3), pp. 662-665. |
| [11] | Thomson, C. J., Colmer, T. D., Watkin, E. L. J. and Greenway, H., 1992. Tolerance of wheat (Triticum aestivum cvs Gamenya and Kite) and triticale (Triticosecale cv. Muir) to waterlogging. New Phytologist, 120(3), pp. 335-344. |
| [12] | Van Gínkel, M., Sayre, K. and Boru, G., 1997. La tolerancia al anegamiento en el trigo: problemas relacionados con el fitomejoramiento. Explorando altos rendimientos de trigo, p. 193. |
APA Style
Girma, E. (2024). Screening of Bread Wheat (Triticum aestivum L.) Genotypes for Waterlogged Area in Highlands of Ethiopia. Plant, 12(2), 19-24. https://doi.org/10.11648/j.plant.20241202.11
ACS Style
Girma, E. Screening of Bread Wheat (Triticum aestivum L.) Genotypes for Waterlogged Area in Highlands of Ethiopia. Plant. 2024, 12(2), 19-24. doi: 10.11648/j.plant.20241202.11
AMA Style
Girma E. Screening of Bread Wheat (Triticum aestivum L.) Genotypes for Waterlogged Area in Highlands of Ethiopia. Plant. 2024;12(2):19-24. doi: 10.11648/j.plant.20241202.11
@article{10.11648/j.plant.20241202.11,
  author = {Endashaw Girma},
  title = {Screening of Bread Wheat (Triticum aestivum L.) Genotypes for Waterlogged Area in Highlands of Ethiopia
},
  journal = {Plant},
  volume = {12},
  number = {2},
  pages = {19-24},
  doi = {10.11648/j.plant.20241202.11},
  url = {https://doi.org/10.11648/j.plant.20241202.11},
  eprint = {https://article.sciencepublishinggroup.com/pdf/10.11648.j.plant.20241202.11},
  abstract = {Due to a serious waterlogging issue, Ethiopia's agricultural productivity has been severely limited, yielding much lower than expected results. In this study conducted on screening of 49 for first year and 60 for second year bread wheat genotypes selected from international nursery. An experiment was undertaken at two locations namely, Ginchi Agricultural Research Sub Center and Tulu Bolo farmer field in Ethiopia in 2018/19 and 2019/20 cropping seasons. The main objective of this study was to select best performed genotypes in waterlogged areas for next variety development and future breeding program. The experiment was conducted using apha lattice with three replications. Data on yield and associated traits were collected and analyzed using SAS version 9.3 software. The results revealed that the separate analysis of variance over the two years conducted at Ginchi showed statistically significant (P ≤ 0.01) differences among the genotypes for all phenotypic traits except Septoria disease severity, Number of tiller and biomass yield considered in this study. The results revealed that the separate analysis of variance over the two years conducted at Tulu bolo showed statistically non-significant (P <0.01) differences among the genotypes for all phenotypic traits except days to heading, plant height, Septoria disease severity agronomic score, hectoliter weight and thousand kernel weight considered in this study. In general from the two locations the maximum and minimum were revealed 29.85qt/ha and 2.32qt/ha respectively. This indicated that almost all genotypes were showed low performed and the wheat breeder give more attentions to provide resistance genotypes for waterlogging.
},
 year = {2024}
}
TY  - JOUR
T1  - Screening of Bread Wheat (Triticum aestivum L.) Genotypes for Waterlogged Area in Highlands of Ethiopia

AU  - Endashaw Girma
Y1  - 2024/05/17
PY  - 2024
N1  - https://doi.org/10.11648/j.plant.20241202.11
DO  - 10.11648/j.plant.20241202.11
T2  - Plant
JF  - Plant
JO  - Plant
SP  - 19
EP  - 24
PB  - Science Publishing Group
SN  - 2331-0677
UR  - https://doi.org/10.11648/j.plant.20241202.11
AB  - Due to a serious waterlogging issue, Ethiopia's agricultural productivity has been severely limited, yielding much lower than expected results. In this study conducted on screening of 49 for first year and 60 for second year bread wheat genotypes selected from international nursery. An experiment was undertaken at two locations namely, Ginchi Agricultural Research Sub Center and Tulu Bolo farmer field in Ethiopia in 2018/19 and 2019/20 cropping seasons. The main objective of this study was to select best performed genotypes in waterlogged areas for next variety development and future breeding program. The experiment was conducted using apha lattice with three replications. Data on yield and associated traits were collected and analyzed using SAS version 9.3 software. The results revealed that the separate analysis of variance over the two years conducted at Ginchi showed statistically significant (P ≤ 0.01) differences among the genotypes for all phenotypic traits except Septoria disease severity, Number of tiller and biomass yield considered in this study. The results revealed that the separate analysis of variance over the two years conducted at Tulu bolo showed statistically non-significant (P <0.01) differences among the genotypes for all phenotypic traits except days to heading, plant height, Septoria disease severity agronomic score, hectoliter weight and thousand kernel weight considered in this study. In general from the two locations the maximum and minimum were revealed 29.85qt/ha and 2.32qt/ha respectively. This indicated that almost all genotypes were showed low performed and the wheat breeder give more attentions to provide resistance genotypes for waterlogging.

VL  - 12
IS  - 2
ER  -
Department of Plant Breeding, Ethiopian Institute of Agricultural Research, Addis Ababa, Ethiopia
Information