Air pollution control is a safe method for achieving a sustainable environment and can be accomplished by adequately monitoring pollutants that pose significant environmental risks. The combustion of sulfur-containing petroleum products has been a major concern for several decades. Therefore, this study was aimed at determining sulfur levels in refined petroleum products such as Premium Motor Spirit (PMS), Automotive Gas Oil (AGO), and Dual-Purpose Kerosene (DPK). It also investigated the air quality implications of sulfur levels and estimated the contribution of the refinery’s products to sulfur dioxide air emission. Fuel samples were collected from the Warri Refining and Petrochemical Company (WRPC) in Nigeria and analyzed using Ultraviolet-visible spectrophotometer (UV-Vis) and Energy-Dispersive X-ray Fluorescence (EDXRF). Sulfur levels were determined at 425 nm wavelength, and sulfur dioxide air emission were estimated for seven consecutive years from 2010 to 2016 using the emission factor approach. The densities of PMS, AGO, and DPK were 0.77 kg/l, 0.832 kg/l, and 0.82 kg/l respectively. The levels of sulfur in PMS, AGO, and DPK were 2.007 x 10⁻⁴ %, 6.970 x 10⁻⁵ wt%, and 4.233 x 10⁻⁵ wt% respectively from UV-Vis technique and 0.016, 0.087 and 0.029% respectively for EDXRF technique were found below the sulfur limit of 0.015 %, 0.005 % and 0.015 % for PMS, AGO and DPK respectively specified by Standard Organization of Nigeria (SON) specifications of 0.1, 0.5 and 0.15wt% for PMS, AGO and DPK respectively. The annual sulfur dioxide emissions were obtained for seven consecutive years from 2010 to 2016. The results from UV-VIS were observed to have the highest SO2 emission of 0.1718 tons for PMS in 2011, 0.2593 tons in 2010 for AGO, and 0.0974 tons for DPK in 2010, while the lowest emission was observed to be 0.029 tons for PMS in 2015, 0.0362 tons in 2015 for AGO and 0.0181 tons for DPK also in 2015. The results from EDXRF technique were observed to have the highest SO2 emission of 13.6939 tons for PMS in 2012, 323.6881 tons for AGO in 2010, and 66.7147 tons for DPK also in 2010, while the lowest emissions for PMS, AGO and DPK were all observed in 2015 to be 2.3122, 45.1872, and 12.4182 tons respectively. The study concluded that the refinery complied with the set requirements.
| Published in | Journal of Energy, Environmental & Chemical Engineering (Volume 9, Issue 2) |
| DOI | 10.11648/j.jeece.20240902.11 |
| Page(s) | 46-55 |
| Creative Commons |
This is an Open Access article, distributed under the terms of the Creative Commons Attribution 4.0 International License (http://creativecommons.org/licenses/by/4.0/), which permits unrestricted use, distribution and reproduction in any medium or format, provided the original work is properly cited. |
| Copyright |
Copyright © The Author(s), 2024. Published by Science Publishing Group |
Sulfur dioxide, Air pollution, Gasoline, Diesel, Kerosene, UV-VIS Spectrophotometer, Energy Dispersive X-Ray Fluorescence, Emission Factor
Fuels | Power Output | Fuel Input | ||
|---|---|---|---|---|
(g/hp-hr)a | (g/L)b | (lb/MMBtu) | g/L | |
PMS | 0.268 | 1.27 | 0.084 | 1.26 |
AGO | 0.931 | 4.82 | 0.29 | 4.72 |
DPK | 0.931 | 4.82 | 0.29 | 4.67 |
Fuels | Requirements (wt%) |
|---|---|
PMS | 0.015 |
AGO | 0.005 |
DPK | 0.015 |
| [1] | S. Motesaddi, Y. Hashempour, and P. Nowrouz, “Characterizing of Air Pollution in Tehran: Comparison of Two Air Quality Indices,” cej, vol. 3, no. 9, pp. 749–758, Oct. 2017, |
| [2] | E. Von Schneidemesser, K. Steinmar, E. C. Weatherhead, B. Bonn, H. Gerwig, and J. Quedenau, “Air pollution at human scales in an urban environment: Impact of local environment and vehicles on particle number concentrations,” Science of The Total Environment, vol. 688, pp. 691–700, Oct. 2019, |
| [3] | B. S. Fakinle, E. L. Odekanle, A. P. Olalekan, H. E. Ije, D. O. Oke, and J. A. Sonibare, “Air pollutant emissions by anthropogenic combustion processes in Lagos, Nigeria,” Cogent Engineering, vol. 7, no. 1, p. 1808285, Jan. 2020, |
| [4] | G. Richard, S. Izah, and M. Ibrahim, “Air pollution in the Niger Delta region of Nigeria: Sources, health effects, and strategies for mitigation,” Journal of Environmental Studies, vol. 29, no. 1, pp. 1–15, Mar. 2023. |
| [5] | N. Zen, H. S. Huboyo, M. S. Romadhon, J. A. Fatkhurrahman, and S. K. Amrulah, “A Low-Cost Instrument to Monitor Sulphur Dioxide Emissions Based on The DOAS Method,” vol. 14, no. 1, 2023. |
| [6] | T. A. Saleh, “Characterization, determination and elimination technologies for sulfur from petroleum: Toward cleaner fuel and a safe environment,” Trends in Environmental Analytical Chemistry, vol. 25, p. e00080, Mar. 2020, |
| [7] | P. Bani et al., “Modest volcanic SO2 emissions from the Indonesian archipelago,” Nat Commun, vol. 13, no. 1, p. 3366, Jun. 2022, |
| [8] | F. B. Sunday, “Total Suspended Solids and Volatile Organic Compounds In The Airshed of A Reconstructed Road Along Lagos-Ibadan Express Way”. |
| [9] | F. Zhang et al., “Sulfur dioxide may predominate in the adverse effects of ambient air pollutants on semen quality among the general population in Hefei, China,” Science of The Total Environment, vol. 867, p. 161472, Apr. 2023, |
| [10] | C. Guo et al., “Long-Term Exposure to Ambient Fine Particulate Matter (PM2.5) and Lung Function in Children, Adolescents, and Young Adults: A Longitudinal Cohort Study,” Environ Health Perspect, vol. 127, no. 12, p. 127008, Dec. 2019, |
| [11] | Y. Liu et al., “Inverse Association between Ambient Sulfur Dioxide Exposure and Semen Quality in Wuhan, China,” Environ. Sci. Technol., vol. 51, no. 21, pp. 12806–12814, Nov. 2017, |
| [12] | H. Héritier et al., “A systematic analysis of mutual effects of transportation noise and air pollution exposure on myocardial infarction mortality: a nationwide cohort study in Switzerland,” European Heart Journal, vol. 40, no. 7, pp. 598–603, Feb. 2019, |
| [13] | N. Wang et al., “Short-term association between ambient air pollution and lung cancer mortality,” Environmental Research, vol. 179, p. 108748, Dec. 2019, |
| [14] | B. S. Fakinle, O. D. Oke, O. A. Odunlami, J. A. Sonibare, F. A. Akeredolu, and O. S. Oni, “Emission characterization and performance of conventional liquefied petroleum gas cookstove burners,” Cogent Engineering, vol. 6, no. 1, p. 1652228, Jan. 2019, |
| [15] | M. A. Fayad, M. T. Chaichan, H. A. Dhahad, and A. A. Al-Amiery, “Reducing the Effect of High Sulfur Content in Diesel Fuel on NOx Emissions and PM Characteristics Using a PPCI Mode Engine and Gasoline–Diesel Blends,” ACS Omega, 2022. |
| [16] | Chuka Anthony Arinze, Olakunle Abayomi Ajala, Chinwe Chinazo Okoye, Onyeka Chrisanctus Ofodile, and Andrew Ifesinachi Daraojimba, “Evaluating The Integration Of Advanced It Solutions For Emission Reduction In The Oil And Gas Sector,” Eng. sci. technol. j., vol. 5, no. 3, pp. 639–652, Mar. 2024, |
| [17] | K. Ekoue-Kovi, S. Murugesan, O. Ugono, S. Pinappu, and J. Weers, “Novel Environmentally Responsible Solvents for Sulfur Removal in Oil and Gas Applications,” in Day 2 Thu, June 29, 2023, The Woodlands, Texas, USA: SPE, Jun. 2023, p. D021S010R003. |
| [18] | S. C. Bajia, R. J. Singh, B. Bajia, and S. Kumar, “Determination of sulfur content in petroleum products – an overview,” Journal of Sulfur Chemistry, vol. 38, no. 4, pp. 450–464, Jul. 2017. |
| [19] | A. Haruna, Z. M. A. Merican, and S. G. Musa, “Recent advances in catalytic oxidative desulfurization of fuel oil – A review,” Journal of Industrial and Engineering Chemistry, vol. 112, pp. 20–36, Aug. 2022. |
| [20] | S. Chavan, H. Kini, and R. Ghosal, “Process for Sulfur Reduction from High Viscosity Petroleum Oils,” IJESD, pp. 228–231, 2012. |
| [21] | S. Houda, C. Lancelot, P. Blanchard, L. Poinel, and C. Lamonier, “Oxidative Desulfurization of Heavy Oils with High Sulfur Content: A Review,” 2018. |
| [22] | R. Y. Mamuad and A. E. S. Choi, “Biodesulfurization Processes for the Removal of Sulfur from Diesel Oil: A Perspective Report,” Energies, vol. 16, no. 6, p. 2738, Mar. 2023, |
| [23] | X. Meng, M. Zhang, and Y. Zhao, “Environmental regulation and green transition: Quasi-natural experiment from China’s efforts in sulfur dioxide emissions control,” Journal of Cleaner Production, vol. 434, p. 139741, Jan. 2024, |
| [24] | S. Niu, Y. Chen, R. Zhang, and Y. Feng, “How does the air pollution control prevention and control action plan affect sulfur dioxide intensity in China”. |
| [25] | R. Javadli and A. De Klerk, “Desulfurization of heavy oil,” Appl Petrochem Res, vol. 1, no. 1–4, pp. 3–19, Mar. 2012. |
| [26] | S. Chen et al., “Efficient biodesulfurization of diesel oil by Gordonia sp. SC-10 with highly hydrophobic cell surfaces,” Biochemical Engineering Journal, vol. 174, p. 108094, Oct. 2021. |
| [27] | “United States Environmental Protection Agency.” [Online]. Available: |
| [28] | “Emission Factor of Sulfur dioxide emission in Uncontrolled PMS, AGO and DPK.” [Online]. Available: Background Document for AP-42 Section 3.3, Gasoline and Diesel Industrial Engines. |
| [29] |
“Standard Organization of Nigeria, SON requirements for refined petroleum products.” [Online]. Available:
https://www.aneej.org/son-releases-new-industrial-standards-petroleum-products/ |
| [30] | O. S. Olatunji, L. A. Jimoda, B. S. Fakinle, J. A. Adeniran, and J. A. Sonibare, “Total Sulfur Levels in Refined Petroleum Products of Southwestern Nigeria Using UV/VIS Spectrophotometer,” Petroleum Science and Technology, vol. 33, no. 1, pp. 102–109, Jan. 2015, |
| [31] | R. Wang, G. Zhang, and H. Zhao, “Polyoxometalate as effective catalyst for the deep desulfurization of diesel oil,” Catalysis Today, vol. 149, no. 1–2, pp. 117–121, Jan. 2010, |
| [32] |
Department of Petroleum Resources Annual Oil and Gas Report
https://www.nuprc.gov.ng/wp-content/uploads/2018/07/2016-Oil-Gas-Industry-Annual-Report-2.pdf |
| [33] | R. Wang, F. Yu, G. Zhang, and H. Zhao, “Performance evaluation of the carbon nanotubes supported Cs2.5H0.5PW12O40 as efficient and recoverable catalyst for the oxidative removal of dibenzothiophene,” Catalysis Today, vol. 150, no. 1–2, pp. 37–41, Feb. 2010. |
| [34] | A. O. Ogunkeyede, C. O. Mbaoma, A. D. Iyogbon, A. A. Adebayo, and E. J. Isukuru, “Air Pollution Prediction in Warri and Its Environs Using Quality Parameters,” IJG, vol. 14, no. 06, pp. 531–546, 2023 |
| [35] | V. S. Balogun and P. A. O. Odjugo, “Spatial Analyses of Air Pollutants Concentration around the Warri Refining and Petrochemical Company (WRPC), Delta State, Nigeria,” Ghana J. Geography, vol. 14, no. 2, pp. 50–81, Aug. 2022 |
| [36] | “Population distribution in Nigeria.” [Online]. Available: |
| [37] | N. Tijjani, P. O. Ike, B. B. Usman, D. I. Malami, and A. Matholo, “Trace Elemental Analysis of Nigerian Petroleum Products Using AAS Method,” ISS N, vol. 3, no. 2, 2012. |
| [38] |
“Heating Values of Refined Petroleum Products.” [Online]. Available:
https://www.engineeringtoolbox.com/fuels-higher-calorific-values-d_169.html |
| [39] | S. M. Farroha, A. E. Habboush, and M. N. Micheal, “Determination of milligram amounts of sulfur in hydrocarbons by constant current coulometry,” Anal. Chem., vol. 56, no. 7, pp. 1182–1183, Jun. 1984, |
| [40] | G. Igile, F. Uboh, U. Luke, S. Ufot, A. Robert, and P. Ebong,“Environmental Quality in Communities around Warri Refining and Petrochemical Company (WRPC), Niger Delta Region, Nigeria,” JSRR, vol. 7, no. 6, pp. 400–412, Jan. 2015. |
APA Style
Oni, O., Sonibare, J., Fakinle, B., Oke, D., Odofin, O., et al. (2024). Determination of Sulphur Dioxide Air Emission of Refined Petroleum Products by Emission Factor Approach for Air Pollution Control. Journal of Energy, Environmental & Chemical Engineering, 9(2), 46-55. https://doi.org/10.11648/j.jeece.20240902.11
ACS Style
Oni, O.; Sonibare, J.; Fakinle, B.; Oke, D.; Odofin, O., et al. Determination of Sulphur Dioxide Air Emission of Refined Petroleum Products by Emission Factor Approach for Air Pollution Control. J. Energy Environ. Chem. Eng. 2024, 9(2), 46-55. doi: 10.11648/j.jeece.20240902.11
AMA Style
Oni O, Sonibare J, Fakinle B, Oke D, Odofin O, et al. Determination of Sulphur Dioxide Air Emission of Refined Petroleum Products by Emission Factor Approach for Air Pollution Control. J Energy Environ Chem Eng. 2024;9(2):46-55. doi: 10.11648/j.jeece.20240902.11
@article{10.11648/j.jeece.20240902.11,
  author = {Olufemi Oni and Jacob Sonibare and Bamidele Fakinle and Daniel Oke and Odunola Odofin and Motunrayo Oladele and Michael Ikeh},
  title = {Determination of Sulphur Dioxide Air Emission of Refined Petroleum Products by Emission Factor Approach for Air Pollution Control},
  journal = {Journal of Energy, Environmental & Chemical Engineering},
  volume = {9},
  number = {2},
  pages = {46-55},
  doi = {10.11648/j.jeece.20240902.11},
  url = {https://doi.org/10.11648/j.jeece.20240902.11},
  eprint = {https://article.sciencepublishinggroup.com/pdf/10.11648.j.jeece.20240902.11},
  abstract = {Air pollution control is a safe method for achieving a sustainable environment and can be accomplished by adequately monitoring pollutants that pose significant environmental risks. The combustion of sulfur-containing petroleum products has been a major concern for several decades. Therefore, this study was aimed at determining sulfur levels in refined petroleum products such as Premium Motor Spirit (PMS), Automotive Gas Oil (AGO), and Dual-Purpose Kerosene (DPK). It also investigated the air quality implications of sulfur levels and estimated the contribution of the refinery’s products to sulfur dioxide air emission. Fuel samples were collected from the Warri Refining and Petrochemical Company (WRPC) in Nigeria and analyzed using Ultraviolet-visible spectrophotometer (UV-Vis) and Energy-Dispersive X-ray Fluorescence (EDXRF). Sulfur levels were determined at 425 nm wavelength, and sulfur dioxide air emission were estimated for seven consecutive years from 2010 to 2016 using the emission factor approach. The densities of PMS, AGO, and DPK were 0.77 kg/l, 0.832 kg/l, and 0.82 kg/l respectively. The levels of sulfur in PMS, AGO, and DPK were 2.007 x 10⁻⁴ %, 6.970 x 10⁻⁵ wt%, and 4.233 x 10⁻⁵ wt% respectively from UV-Vis technique and 0.016, 0.087 and 0.029% respectively for EDXRF technique were found below the sulfur limit of 0.015 %, 0.005 % and 0.015 % for PMS, AGO and DPK respectively specified by Standard Organization of Nigeria (SON) specifications of 0.1, 0.5 and 0.15wt% for PMS, AGO and DPK respectively. The annual sulfur dioxide emissions were obtained for seven consecutive years from 2010 to 2016. The results from UV-VIS were observed to have the highest SO2 emission of 0.1718 tons for PMS in 2011, 0.2593 tons in 2010 for AGO, and 0.0974 tons for DPK in 2010, while the lowest emission was observed to be 0.029 tons for PMS in 2015, 0.0362 tons in 2015 for AGO and 0.0181 tons for DPK also in 2015. The results from EDXRF technique were observed to have the highest SO2 emission of 13.6939 tons for PMS in 2012, 323.6881 tons for AGO in 2010, and 66.7147 tons for DPK also in 2010, while the lowest emissions for PMS, AGO and DPK were all observed in 2015 to be 2.3122, 45.1872, and 12.4182 tons respectively. The study concluded that the refinery complied with the set requirements.
},
 year = {2024}
}
TY  - JOUR
T1  - Determination of Sulphur Dioxide Air Emission of Refined Petroleum Products by Emission Factor Approach for Air Pollution Control
AU  - Olufemi Oni
AU  - Jacob Sonibare
AU  - Bamidele Fakinle
AU  - Daniel Oke
AU  - Odunola Odofin
AU  - Motunrayo Oladele
AU  - Michael Ikeh
Y1  - 2024/04/28
PY  - 2024
N1  - https://doi.org/10.11648/j.jeece.20240902.11
DO  - 10.11648/j.jeece.20240902.11
T2  - Journal of Energy, Environmental & Chemical Engineering
JF  - Journal of Energy, Environmental & Chemical Engineering
JO  - Journal of Energy, Environmental & Chemical Engineering
SP  - 46
EP  - 55
PB  - Science Publishing Group
SN  - 2637-434X
UR  - https://doi.org/10.11648/j.jeece.20240902.11
AB  - Air pollution control is a safe method for achieving a sustainable environment and can be accomplished by adequately monitoring pollutants that pose significant environmental risks. The combustion of sulfur-containing petroleum products has been a major concern for several decades. Therefore, this study was aimed at determining sulfur levels in refined petroleum products such as Premium Motor Spirit (PMS), Automotive Gas Oil (AGO), and Dual-Purpose Kerosene (DPK). It also investigated the air quality implications of sulfur levels and estimated the contribution of the refinery’s products to sulfur dioxide air emission. Fuel samples were collected from the Warri Refining and Petrochemical Company (WRPC) in Nigeria and analyzed using Ultraviolet-visible spectrophotometer (UV-Vis) and Energy-Dispersive X-ray Fluorescence (EDXRF). Sulfur levels were determined at 425 nm wavelength, and sulfur dioxide air emission were estimated for seven consecutive years from 2010 to 2016 using the emission factor approach. The densities of PMS, AGO, and DPK were 0.77 kg/l, 0.832 kg/l, and 0.82 kg/l respectively. The levels of sulfur in PMS, AGO, and DPK were 2.007 x 10⁻⁴ %, 6.970 x 10⁻⁵ wt%, and 4.233 x 10⁻⁵ wt% respectively from UV-Vis technique and 0.016, 0.087 and 0.029% respectively for EDXRF technique were found below the sulfur limit of 0.015 %, 0.005 % and 0.015 % for PMS, AGO and DPK respectively specified by Standard Organization of Nigeria (SON) specifications of 0.1, 0.5 and 0.15wt% for PMS, AGO and DPK respectively. The annual sulfur dioxide emissions were obtained for seven consecutive years from 2010 to 2016. The results from UV-VIS were observed to have the highest SO2 emission of 0.1718 tons for PMS in 2011, 0.2593 tons in 2010 for AGO, and 0.0974 tons for DPK in 2010, while the lowest emission was observed to be 0.029 tons for PMS in 2015, 0.0362 tons in 2015 for AGO and 0.0181 tons for DPK also in 2015. The results from EDXRF technique were observed to have the highest SO2 emission of 13.6939 tons for PMS in 2012, 323.6881 tons for AGO in 2010, and 66.7147 tons for DPK also in 2010, while the lowest emissions for PMS, AGO and DPK were all observed in 2015 to be 2.3122, 45.1872, and 12.4182 tons respectively. The study concluded that the refinery complied with the set requirements.

VL  - 9
IS  - 2
ER  -
Department of Chemical Engineering, University of North Dakota, Grand Forks, United States
Biography: Olufemi Oni is a PhD student in the Department of Chemical Engineering at the University of North Dakota, USA. He obtained his Bachelor of Science degree in Chemical Engineering from Obafemi Awolowo University, Nigeria and his Master of Science in Chemical Engineering with distinction from the same institution. He was awarded the 2023 Judges Choice Presentation Award by the Red-River Valley, American Chemical Society (RRV-ACS) annual conference in Minnesota, USA, and 2024 North Dakota Academy of Science (NDAS) annual conference in Grand Forks, USA. In addition, he is a member of The American Institute of Chemical Engineers (AIChE) and The American Chemical Society (ACS). He has served as a Judge for poster presentation at the 2024 North Dakota Academy of Science Annual meeting. He currently serves as the Speaker Head of the American Institute of Chemical Engineers at the University of North Dakota, United States.
Research Fields: Air Quality, Bioprocess, Renewable Energy, Wastewater Management, polymers, Air Pollution Control, Corrosion control
Department of Chemical Engineering, Obafemi Awolowo University, Ile-Ife, Nigeria
Biography: Jacob Sonibare is a Professor of Chemical Engineering, Obafemi Awolowo University, Ile-Ife, Nigeria. He is a consultant in Air quality and Life Cycle Analysis (LCA). Additionally, he has con-ducted multiple environmental Impact Assessment Projects and has published his works in reputable journals.
Research Fields: Air Quality, Life Cycle Analysis, Air Pollution Control and Modelling, Natural Gas
Department of Chemical Engineering, Landmark University, Omu-Aran, Nigeria
Biography: Bamidele Fakinle is an Associate Professor in the Department of Chemical Engineering at Landmark University, Omu Aran, Otta in Nigeria. Bamidele does research in Chemical Engineering and Environmental Engineering. His focuses on Air Quality and Life Cycle Analysis (LCA). Currently he is an Ag. Head of Department, Chemical Engineering. He has conducted and supervised multiple Research projects published a lot of works in reputable journals.
Research Fields: Air Quality, Life Cycle Analysis, Air Pollution Control and Modelling
Department of Chemical Engineering, Landmark University, Omu-Aran, Nigeria
Biography: Daniel Oke is a Lecturer in the Department of Chemical Engineering at Landmark University, Omu Aran, Otta in Nigeria. Daniel does research in Chemical Engineering and Environmental Engineering. He has conducted multiple Research projects in En-vironmental Engineering. He has also published a lot of works in reputable journals.
Research Fields: Air Quality, Life Cycle Analysis, Air Pollution Control, Life Cycle Analysis
Department of Chemical Engineering, University of North Dakota, Grand Forks, United States
Biography: Odunola Odofin is a PhD student in the Chemical Engineering Department at the University of North Dakota, United States. She earned her B.Tech in Chemical Engineering from Ladoke Akintola University of Technology, Nigeria. She has actively participated in various research collaboration projects in recent years. Additionally, she served as a poster judge at the North Dakota Academy of Science Annual Conference held in March 2024.
Research Fields: Air Quality, Renewable Energy, Bioprocess, Air Pollution Control, Wastewater treatment
Department of Chemistry, University of Kentucky, Lexington, Kentucky, United States
Biography: Motunrayo Oladele is PhD student at Chemistry at the University of Kentucky. She obtained her Bachelor of Science degree in Chemistry from Olabisi Onabanjo University in Nigeria with a First Class. She was awarded at the GradTeach Live event in February 2024 and the UK Sustainability poster competition in October 2023. She is the Principal Investigator alongside peers for an NSF-funded project on soil remediation, and she actively contributes as a reviewer for academic journals. She is a member of esteemed organizations such as the American Chemical Society and the Kentucky Academy of Science. She holds leadership roles as the Diversity and Inclusion Officer for the Chemistry Graduate Student Association and the Volunteer Coordinator for the American Chemical Society, University of Kentucky chapter.
Research Fields: Environmental Chemistry, Analytical chemistry, Separation
College of Earth, Ocean, and Atmospheric Sciences, Oregon State University, Oregon, United States
Biography: Michael Ikeh is a seasoned environmental scientist specializing in natural climate solutions, particularly in habitat restoration, REDD+ methodologies, and natural resource management. He obtained his Bachelor of Science degree in Geology and Mineral Sciences from the University of Ilorin in 2018, followed by the completion of a Professional master’s degree in environmental sciences at Oregon State University in 2023. He has been actively engaged in various research endeavors, notably contributing to projects focused on the restoration of riparian forest ecosystems in the coastal region of the Pacific Northwest. He currently serves as the head of operations and consultant at an electronic recycling firm, where he applies his academic knowledge to address contemporary environmental challenges.
Research Fields: Environmental Science, Environmental Remediation, restoration of riparian forest ecosystems in the coastal region
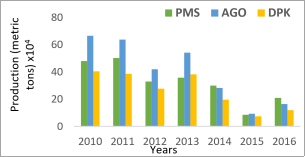
Figure 1. Yearly production rate of WRPC.
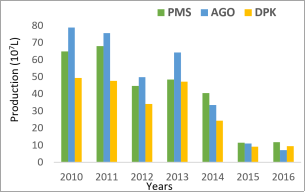
Figure 2. Yearly production rate of WRPC.
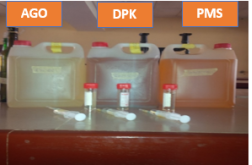
Figure 3. Refined petroleum products from WRPC.
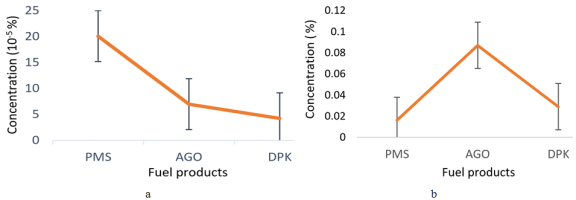
Figure 4. a: Average sulphur concentrations of the samples (UV-VIS), b: Average sulphur concentrations of the samples (EDXRF).
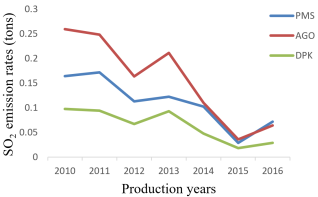
Figure 5. Estimated annual sulphur dioxide emission (UV-VIS).
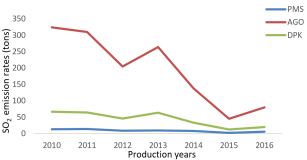
Figure 6. Estimated annual sulphur dioxide emission (EDXRF).
Information

