This study investigated the comparative effects of natural and chemical treatments on pond water samples obtained from the AAUA Fishery, with emphasis on microbial load reduction, diversity, antibiotic susceptibility, fungal occurrence, and molecular resistance gene detection. Treatments applied included Moringa oleifera leaf powder (0.5 g and 1 g), chlorine (0.5 g and 1 g), and direct sunlight exposure, while untreated samples served as controls. Microbiological analyses were performed using serial dilution, spread plating, colony morphology, Gram staining, and biochemical characterization, with bacterial identification supported by Bergey’s Manual of Determinative Bacteriology. Fungal isolates were identified based on cultural and microscopic features, and antibiotic susceptibility was assessed using the Kirby–Bauer disk diffusion method. PCR amplification was used to detect selected antibiotic resistance genes. Results showed that 0.5 g of Moringa moderately reduced bacterial counts from 3.5 × 10⁴ to 7.0 × 10³ CFU/mL (10-3 dilution) and from 2.0 × 10⁷ to 6.0 × 10⁶ CFU/mL (10-6 dilution) over 6 h, while 1 g produced weaker inhibition. Sunlight treatment was more effective, lowering bacterial load from 6.0 × 10⁴ to 7.0 × 10³ CFU/mL and from 3.5 × 10⁷ to 4.0 × 10⁶ CFU/mL across dilutions. Chlorine was the most potent treatment, achieving complete elimination of bacterial growth within 4–6 h at both concentrations. Control samples only showed a natural decline in bacterial counts. Biochemical and colony analyses revealed diverse bacterial species, including Staphylococcus aureus, Micrococcus luteus, Bacillus spp., Aeromonas hydrophila, Enterococcus faecalis, Corynebacterium sp., Vibrio cholerae, and Listeria monocytogenes. Antibiotic susceptibility tests indicated that both Gram-positive and Gram-negative isolates exhibited multidrug resistance, with inhibition zones ranging between 10 mm and 16 mm. Fungal isolates included Aspergillus fumigatus, Aspergillus terreus, Aspergillus sydowii, Eurotium sp., and Aspergillus flavus. Molecular assays detected the presence of blaOXA and qnrA resistance genes, while blaNDM, blaTEM, blaSHV, tetA, tetB, and cmlA were not detected. These findings highlight the superior bactericidal effect of chlorine relative to Moringa oleifera and sunlight, Moringa oleifera become an alternative source to chlorine and its effects on multidrug resistant microorganisms in pond water, but also reveal the persistence of multidrug-resistant bacteria and fungi in treated pond water. The study underscores the need for integrated water treatment approaches and continuous monitoring to safeguard aquaculture productivity and public health.
| Published in | Journal of Diseases and Medicinal Plants (Volume 12, Issue 2) |
| DOI | 10.11648/j.jdmp.20261202.11 |
| Page(s) | 70-87 |
| Creative Commons |
This is an Open Access article, distributed under the terms of the Creative Commons Attribution 4.0 International License (http://creativecommons.org/licenses/by/4.0/), which permits unrestricted use, distribution and reproduction in any medium or format, provided the original work is properly cited. |
| Copyright |
Copyright © The Author(s), 2026. Published by Science Publishing Group |
Pond Water Management, Eco-Friendly, Conventional Treatment Strategies
Multiplex | Gene | Primer | Primer sequence 5’-3’ | Profile |
|---|---|---|---|---|
Multiplex1 | bla OXA | OXA R | TTCTGTTGTTTGGGTTTCGC | An initial denaturing 5min at 94°C, then 35 cycles of 94°C for 30s, 50°C for 40s 72°C for 30s and terminate at 72°C for 10min |
OXA R | ACGCAGGAATTGAATTTGTT | |||
bla NDM | NDM F | GGTGTTTGGTCGCATATCGCAA | ||
NDM R | ATTCAGCCAGATCGGCATCGGC | |||
Multiplex2 | blaTem | Tem F | GTCGCCGCATACACTATTCTCA | An initial denaturing 5min at 94°C, then 35 cycles of 94°C for 30s, 49°C for 40s 72°C for 35s and terminate at 72°C for 10min |
Tem R | CGCTCGTCGTTTGGTATGG | |||
bla SHV | SHV F | GCCTTGACCGCTGGGAAAC | ||
SHV R | GGCGTATCCCGCAGATAAAT | |||
qnrA | qnrAF | ATTTCTCACGCCAGGATTTG | An initial denaturing 5min at 94°C, then 35 cycles of 94°C for 30s, 50°C for 30s 72°C for 30s and terminate at 72°C for 10min | |
qnrAR | GATCGGCAAAGGTTAGGTCA | |||
qnrS | qnrSF | ACGACATTCGTCAACTGCAA | ||
qnrSR | TAAATTGGCACCCTGTAGGC | |||
tetA | tetAF | GGCGGTCTTCTTCTTCATCATGC | An initial denaturing 5min at 94°C, then 35 cycles of 94°C for 30s, 49°C for 40s 72°C for 35s and terminate at 72°C for 10min | |
tetAR | CGGCAGGCAGAGCAAGTAGA | |||
tetB | tetBF | CCTCAGCTTCTCAACGCGTG | ||
tetBR | GCACCTTGCTCATGACTCTT | |||
cmlA | cmlA-F | CCGCCACGGTGTTGTTGTTATC | An initial denaturing 5min at 94°C, then 35 cycles of 94°C for 30s, 52°C for 30s 72°C for 40s and terminate at 72°C for 10min | |
cmlA-R | CACCTTGCCTGCCCATCATTAG |
Time | CFU/ml (10-3) | CFU/ml (10-6) |
|---|---|---|
0 hr | 3.5×10⁴ | 2.0×10⁷ |
2 hr | 2.6×10⁴ | 1.5×10⁷ |
4 hr | 1.6×10⁴ | 1.1×10⁷ |
6 hr | 7.0×10³ | 6.0×10⁶ |
Time | CFU/ml (10-3) | CFU/ml (10-6) |
|---|---|---|
0 hr | 2.0×10⁴ | 1.0×10⁷ |
2 hr | 2.0×10⁴ | 8.0×10⁶ |
4 hr | 2.0×10⁴ | 7.0×10⁶ |
6 hr | 2.0×10⁴ | 5.0×10⁶ |
Time | CFU/ml (10-3) | CFU/ml (10-6) |
|---|---|---|
0 hr | 6.0×10⁴ | 3.5×10⁷ |
2 hr | 4.2×10⁴ | 2.5×10⁷ |
4 hr | 2.5×10⁴ | 1.4×10⁷ |
6 hr | 7.0×10³ | 4.0×10⁶ |
Time | CFU/ml (10-3) | CFU/ml (10-6) |
|---|---|---|
0 hr | 6.5×10⁴ | 4.0×10⁷ |
2 hr | 4.3×10⁴ | 2.7×10⁷ |
4 hr | 2.2×10⁴ | 1.3×10⁷ |
6 hr | 0 | 0 |
Time | CFU/ml (10-3) | CFU/ml (10-6) |
|---|---|---|
0 hr | 1.0×10⁴ | 1.0×10⁶ |
2 hr | 7.0×10³ | 1.0×10⁶ |
4 hr | 3.0×10³ | 0 |
6 hr | 0 | 0 |
Time | CFU/ml (10-3) | CFU/ml (10-6) |
|---|---|---|
0 hr | 8.2×10⁴ | 6.0×10⁷ |
2 hr | 5.8×10⁴ | 4.2×10⁷ |
4 hr | 3.4×10⁴ | 2.5×10⁷ |
6 hr | 1.0×10⁴ | 7.0×10⁶ |
Code | Color on Agar | Elevation | Opacity |
|---|---|---|---|
MDC3 | Creamy/Whitish | Raised | Opaque |
SDC2 | White/Dull | Flat/Raised | Opaque |
SDC4 | White/Dull | Flat/Raised | Opaque |
CDCI | White/Dull | Flat/Raised | Opaque |
MDC5 | Greenish/Gray | Raised | Translucent |
CHDCI | Golden Yellow | Convex | Opaque |
MDC2 | Creamy/White | Raised | Opaque |
MDC7 | White/Dull | Flat/Raised | Opaque |
CHDC3 | Grayish/White | Raised | Opaque |
SDC3 | Grayish/White | Raised | Opaque |
MDC4 | Golden Yellow | Convex | Opaque |
MDCI | Bright Yellow | Convex | Opaque |
CHDC2 | Grayish-Blue | Low convex | Translucent |
CODCI | Creamy/Whitish | Raised | Opaque |
MSDCI | Greenish/Gray | Raised | Translucent |
MSDC3 | Yellowish | Flat | Translucent |
MSDC2 | Grayish/White | Raised | Opaque |
MCODCI | Grayish/White | Raised | Opaque |
MMDC2 | White/Dull | Flat/Raised | Opaque |
MMDC6 | Greenish/Gray | Raised | Translucent |
MSDCL | White/Cream | Low convex | Opaque |
MMDCI | Golden Yellow | Convex | Opaque |
MCHDC1 | Creamy/Whitish | Raised | Opaque |
MMDC5 | White/Dull | Flat/Raised | Opaque |
MMDC4 | Creamy/Whitish | Raised | Opaque |
MMDC3 | Greenish/Gray | Raised | Translucent |
MCDCI | Yellow/Orange | Convex | Opaque |
MCHDC2 | Golden Yellow | Convex | Opaque |
Isolate Code | Shape | Gram | Oxidase | Coagulase | Catalase | Citrate | MR | Indole | Motility | Urease | Lactose | Galactose | Mannitol | Sucrose | Glucose | Dextrose |
|---|---|---|---|---|---|---|---|---|---|---|---|---|---|---|---|---|
MDC1 | Cocci | + | – | – | + | – | – | – | – | – | – | – | – | – | + | – |
MDC2 | Rod | + | – | – | + | + | + | – | + | – | – | – | + | – | + | ++ |
MDC3 | Rod | + | – | – | + | + | + | – | + | – | + | – | ++ | – | +++ | – |
MDC4 | Cocci | + | – | + | + | – | – | – | – | – | + | – | ++ | – | +++ | – |
MDC5 | Rod | – | + | – | + | + | – | + | – | – | – | ++ | – | +++ | + | – |
MDC7 | Rod | + | – | – | + | + | + | – | + | – | – | ++ | – | +++ | – | – |
MMDC1 | Cocci | + | – | + | + | – | – | – | – | – | + | – | ++ | – | +++ | – |
MMDC2 | Rod | + | – | – | + | + | + | – | + | – | + | – | ++ | – | +++ | – |
MMDC3 | Rod | – | + | – | + | + | + | – | + | – | ++ | – | +++ | + | +++ | – |
MMDC4 | Rod | + | – | – | + | + | + | – | + | – | ++ | – | – | ++ | – | – |
MMDC5 | Rod | + | – | – | + | + | + | – | + | – | + | – | ++ | – | +++ | – |
MMDC6 | Rod | – | + | – | + | + | + | – | + | – | ++ | – | +++ | + | +++ | – |
Isolate Code | Probable organism |
|---|---|
MDC1 | Micrococcus luteus |
MDC2 | Bacillus megaterium |
MDC3 | Bacillus subtilis |
MDC4 | Staphylococcus aureus |
MDC5 | Aeromonas hydrophila |
MDC7 | Bacillus cereus |
MMDC1 | Staphylococcus aureus |
MMDC2 | Bacillus cereus |
MMDC3 | Aeromonas hydrophila |
MMDC4 | Bacillus subtilis |
MMDC5 | Bacillus cereus |
MMDC6 | Aeromonas hydrophila |
Isolate Code | Shape | Gram | Oxidase | Coagulase | Catalase | Citrate | MR | Indole | Motility | Urease | Lactose | Galactose | Mannitol | Sucrose | Glucose | Dextrose |
|---|---|---|---|---|---|---|---|---|---|---|---|---|---|---|---|---|
SUCI | Rod | – | + | – | + | + | + | – | + | – | – | ++ | – | +++ | + | +++ |
SDC2 | Rod | + | – | – | + | + | + | – | + | – | + | – | ++ | – | + | +++ |
SDC3 | Cocci | + | – | – | + | – | + | – | – | – | + | – | + | – | ++ | – |
SDC4 | Rod | + | – | – | + | + | + | – | + | – | + | – | ++ | – | – | +++ |
MSDC1 | Cocci | + | – | – | + | – | – | – | – | – | + | – | + | – | – | ++ |
MSDC2 | Cocci | + | – | – | + | – | – | – | – | – | + | – | + | – | – | ++ |
MSDC3 | Rod | – | + | – | + | + | – | + | – | – | ++ | – | +++ | + | +++ | – |
Isolate Code | Probable organism |
|---|---|
SDCI | Aeromonas hydrophila |
SDC2 | Bacillus cereus |
SDC3 | Enterococcus faecalis |
SDC4 | Bacillus cereus |
MSDC1 | Corynebacterium sp. |
MSDC2 | Enterococcus faecalis |
MSDC3 | Vibrio cholerae |
Isolate Code | Shape | Gram | Oxidase | Coagulase | Catalase | Citrate | MR | Indole | Motility | Urease | Lactose | Galactose | Mannitol | Sucrose | Glucose | Dextrose |
|---|---|---|---|---|---|---|---|---|---|---|---|---|---|---|---|---|
CHDC1 | Cocci | + | – | + | + | – | – | – | – | – | + | – | ++ | – | +++ | – |
CHDC2 | Rod | + | – | – | + | + | – | + | – | – | + | – | ++ | – | + | +++ |
CHDC3 | Cocci | + | – | – | + | – | – | – | – | – | + | – | + | – | – | ++ |
MCHDC1 | Rod | + | – | – | + | + | – | + | – | + | – | ++ | – | ++ | – | – |
MCHDC2 | Cocci | + | – | + | + | – | – | – | – | – | + | – | ++ | – | +++ | – |
Isolate Code | Species |
|---|---|
CHDC1 | Staphylococcus aureus |
CHDC2 | Listeria monocytogenes |
CHDC3 | Enterococcus faecalis |
MCHDC1 | Bacillus subtilis |
MCHDC2 | Staphylococcus aureus |
Isolate Code | Shape | Gram | Oxidase | Coagulase | Catalase | Citrate | MR | Indole | Motility | Urease | Lactose | Galactose | Mannitol | Sucrose | Glucose | Dextrose |
|---|---|---|---|---|---|---|---|---|---|---|---|---|---|---|---|---|
CDC1 | Cocci | + | – | + | + | – | – | – | – | + | – | ++ | – | +++ | – | – |
CODCI | Rod | + | – | – | + | + | – | – | – | + | – | ++ | – | + | +++ | – |
MCODC1 | Cocci | + | – | – | + | – | – | – | – | + | – | + | – | – | – | ++ |
MCDC1 | Rod | + | – | + | + | – | – | – | – | – | ++ | – | ++ | – | – | – |
Isolate Code | Species |
|---|---|
CDC1 | Bacillus cereus |
CODCI | Bacillus subtilis |
MCODC1 | Enterococcus faecalis |
MCDC1 | Kocuria kristinae |
Isolate | GEN | CPX | LEV | AZM | AMX | CHL | SPX | AUG | PRN | OFL |
|---|---|---|---|---|---|---|---|---|---|---|
Aeromonas hydrophila | 12 (I) | 15 (I) | 10 (R) | 14 (I) | 11 (R) | 13 (I) | 16 (S) | 12 (I) | 14 (I) | 10 (R) |
Aeromonas hydrophila | 11 (R) | 13 (I) | 12 (I) | 15 (I) | 10 (R) | 14 (I) | 12 (I) | 13 (I) | 15 (I) | 11 (R) |
Aeromonas hydrophila | 13 (I) | 14 (I) | 11 (R) | 12 (I) | 13 (I) | 15 (I) | 10 (R) | 14 (I) | 11 (R) | 12 (I) |
Aeromonas hydrophila | 10 (R) | 12 (I) | 14 (I) | 13 (I) | 12 (I) | 11 (R) | 15 (I) | 10 (R) | 13 (I) | 14 (I) |
Vibrio cholerae | 15 (I) | 10 (R) | 13 (I) | 11 (R) | 14 (I) | 12 (I) | 13 (I) | 15 (I) | 12 (I) | 11 (R) |
Isolate | GEN | CPX | LEV | AZM | CAZ | AMX | APX | PRN | RIF | ERY |
|---|---|---|---|---|---|---|---|---|---|---|
Micrococcus luteus | 12 (I) | 15 (I) | 10 (R) | 14 (I) | 13 (I) | 11 (R) | 12 (I) | 14 (I) | 10 (R) | 13 (I) |
Bacillus megaterium | 11 (R) | 12 (I) | 13 (I) | 15 (I) | 12 (I) | 14 (I) | 10 (R) | 11 (R) | 12 (I) | 15 (I) |
Bacillus subtilis | 14 (I) | 11 (R) | 12 (I) | 13 (I) | 15 (I) | 12 (I) | 14 (I) | 10 (R) | 13 (I) | 11 (R) |
Staphylococcus aureus | 10 (R) | 13 (I) | 14 (I) | 12 (I) | 11 (R) | 13 (I) | 15 (I) | 12 (I) | 14 (I) | 10 (R) |
Bacillus cereus | 13 (I) | 12 (I) | 15 (I) | 11 (R) | 10 (R) | 14 (I) | 12 (I) | 13 (I) | 11 (R) | 12 (I) |
Bacillus subtilis | 12 (I) | 14 (I) | 11 (R) | 13 (I) | 12 (I) | 15 (I) | 10 (R) | 14 (I) | 13 (I) | 11 (R) |
Staphylococcus aureus | 15 (I) | 12 (I) | 10 (R) | 14 (I) | 13 (I) | 12 (I) | 11 (R) | 15 (I) | 10 (R) | 13 (I) |
Enterococcus faecalis | 11 (R) | 13 (I) | 12 (I) | 15 (I) | 14 (I) | 12 (I) | 13 (I) | 11 (R) | 15 (I) | 10 (R) |
Kocuria kristinae | 12 (I) | 15 (I) | 11 (R) | 13 (I) | 12 (I) | 14 (I) | 10 (R) | 12 (I) | 13 (I) | 11 (R) |
Staphylococcus aureus | 13 (I) | 10 (R) | 14 (I) | 12 (I) | 11 (R) | 13 (I) | 15 (I) | 12 (I) | 14 (I) | 10 (R) |
Bacillus cereus | 12 (I) | 14 (I) | 11 (R) | 13 (I) | 12 (I) | 15 (I) | 10 (R) | 14 (I) | 13 (I) | 11 (R) |
Bacillus subtilis | 14 (I) | 11 (R) | 12 (I) | 13 (I) | 15 (I) | 12 (I) | 14 (I) | 10 (R) | 13 (I) | 11 (R) |
Bacillus cereus | 10 (R) | 13 (I) | 12 (I) | 14 (I) | 11 (R) | 13 (I) | 15 (I) | 12 (I) | 14 (I) | 10 (R) |
Corynebacterium sp. | 13 (I) | 12 (I) | 15 (I) | 11 (R) | 10 (R) | 14 (I) | 12 (I) | 13 (I) | 11 (R) | 12 (I) |
Bacillus cereus | 12 (I) | 14 (I) | 11 (R) | 13 (I) | 12 (I) | 15 (I) | 10 (R) | 14 (I) | 13 (I) | 11 (R) |
Enterococcus faecalis | 15 (I) | 12 (I) | 10 (R) | 14 (I) | 13 (I) | 12 (I) | 11 (R) | 15 (I) | 10 (R) | 13 (I) |
Bacillus cereus | 11 (R) | 13 (I) | 12 (I) | 15 (I) | 14 (I) | 12 (I) | 13 (I) | 11 (R) | 15 (I) | 10 (R) |
Enterococcus faecalis | 12 (I) | 15 (I) | 11 (R) | 13 (I) | 12 (I) | 14 (I) | 10 (R) | 12 (I) | 13 (I) | 11 (R) |
Staphylococcus aureus | 13 (I) | 10 (R) | 14 (I) | 12 (I) | 11 (R) | 13 (I) | 15 (I) | 12 (I) | 14 (I) | 10 (R) |
Listeria monocytogenes | 12 (I) | 14 (I) | 11 (R) | 13 (I) | 12 (I) | 15 (I) | 10 (R) | 14 (I) | 13 (I) | 11 (R) |
Enterococcus faecalis | 14 (I) | 11 (R) | 12 (I) | 13 (I) | 15 (I) | 12 (I) | 15 (I) | 10 (R) | 14 (I) | 13 (I) |
Treatment | Day | Color | Form | Elevation | Hypha Type | Edges |
|---|---|---|---|---|---|---|
Moringa oleifera (1g) | Day 1 | Blue-green to gray | Circular, velvety | Flat to raised | Septate | Entire |
Day 2 | Cinnamon-brown | Circular, powdery | Raised | Septate | Entire/regular | |
Sunlight | Day 1 | Greenish-blue | Circular, velvety | Flat | Septate | Entire |
Day 2 | Yellow-green | Circular, cottony | Raised | Septate | Irregular | |
Control | Day 1 | Yellow to olive | Circular, granular | Flat | Septate | Entire |
Day 2 | Yellow-green | Circular, powdery | Flat to raised | Septate | Lobate/irregular |
Treatment | Probable isolates | |
|---|---|---|
Day1 | Day 2 | |
Moringa 1g | Aspergillus fumigatus | Aspergillus terries (Thom) |
Sunlight | Aspergillus sydowi | Aspergillus devatus |
Control | Eurotum spp | Aspergillus flavus |
AAUA | Adekunle Ajasin University, Akungba-Akoko |
MDR | Multi Drug Resistance |
CFU/mL | Colony Forming Unit per Millimeter |
EDTA | Ethylene Diamine Tetra Acetic Acid |
blaOXA | Gene Family That Encodes D β-lactamase Enzymes That Confers Antibiotic Resistance |
blaNDM | New Delhi metallo-β-lactamase |
blaTEM | Gene in Bacteria That Encodes β-lactamase Enzymes That Confers Antibiotic Resistance |
blaSHV | Gene in Bacteria That Encodes β-lactamase Enzymes That Confers Antibiotic Resistance Sulfhydryl Variable |
tetA | Gene in Bacteria That Encodes the TetA Protein That Confers Antibiotic, Tetracycline Resistance |
tetB | Gene in Bacteria That Confers Resistance to Tetracycline |
qnrA | Gene in Bacteria That Confers Resistance to Quinolone, Plasmid-mediated |
qnrS | Gene in Bacteria That Confers Resistance to Quinolone |
cmlA | Chloramphenicol Resistance gene A |
| [1] | Nath, A., Mishra, A. and Pande, P. P. (2021). A review natural polymeric coagulants in wastewater treatment. Materials Today: Proceedings, 46, 6113-6117, |
| [2] | Elzagheid Mohamed (2023). Chemical Technicians: Good Laboratory Practice and Laboratory Information Management Systems. |
| [3] | Mocek-Płóciniak, A. and Skowrońska, M. (2021). Water-an important element not only of the soil environment. Soil Science Annual, 72(1), 134620, |
| [4] | Luvhimbi, N., Tshitangano, T. G., Mabunda, J. T., Olaniyi, F. C. and Edokpayi, J. N. (2022). Water quality assessment and evaluation of human health risk of drinking water from source to point of use at Thulamela municipality, Limpopo Province. Scientific Reports, 12(1), 6059. |
| [5] | Charcosset, C. (2022) Classical and recent developments of membrane processes for desalination and natural water treatment. Membranes, 12(3), 267, |
| [6] | Tahraoui, H., Toumi, S., Boudoukhani, M., Touzout, N., Sid, A. N. E. H., Amrane, A. and Zhang, J. (2024). Evaluating the effectiveness of coagulation-flocculation treatment using aluminum sulfate on a polluted surface water source: A year-long study. Water, 16(3), 400, |
| [7] | Mahjoub, B., Fersi, C., Bouteffeha, M. and Kuemmerer, K. (2025). Green chemistry and sustainable chemistry related to water challenges: Solutions and prospects in a changing climate. Current Opinion in Green and Sustainable Chemistry, 52, 101000 |
| [8] | Bahrodin, M. B., Zaidi, N. S., Hussein, N., Sillanpää, M., Prasetyo, D. D. and Syafiuddin, A. (2021). Recent advances on coagulation-based treatment of wastewater: Transition from chemical to natural coagulant. Current Pollution Reports, 7(3), 379-391. |
| [9] | Badawi, A. K., Salama, R. S. and Mostafa, M. M. M. (2023). Natural-based coagulants/flocculants as sustainable market-valued products for industrial wastewater treatment: a review of recent developments. RSC advances, 13(28), 19335-19355, |
| [10] | Wu, L., Wei, W., Xu, J., Chen, X., Liu, Y., Peng, L. and Ni, B. J. (2021). Denitrifying biofilm processes for wastewater treatment: developments and perspectives. Environmental Science: Water Research & Technology, 7(1), 40-67, |
| [11] | Islam, S., Ali, M., Banerjee, A., Shah, M. H., Rahman, S. S., Ahammad, F. and Hossain, A. (2023). Moringa oleifera under stressful conditions. In Medicinal Plant Responses to Stressful Conditions (pp. 201-222). CRC Press. |
| [12] | Traore, R., Zinsou, G. and Balema, K. (2021, March). Promotion of Moringa products via an inclusive value chain for economic, social and environmental impacts in Africa. In IV All Africa Horticultural Congress-AAHC2021: Transformative Innovations in Horticulture 1348 (pp. 247-252), |
| [13] | Jikah, A. N. and Edo, G. I. (2023). Moringa oleifera: a valuable insight into recent advances in medicinal uses and pharmacological activities. Journal of the Science of Food and Agriculture, 103(15), 7343-7361, |
| [14] | Al-Jadabi, N., Laaouan, M., El Hajjaji, S., Mabrouki, J., Benbouzid, M. and Dhiba, D. (2023). The dual performance of Moringa oleifera seeds as eco-friendly natural coagulant and as an antimicrobial for wastewater treatment: a review. Sustainability, 15(5), 4280. |
| [15] | Onajobi, I. B., Samson, O. J., Aina, S. A., Ogunmoye, A. O. and Oyetade, E. O. (2023). Microbiological And Physicochemical Assessments of Selected Fish Pond Water Sample in South-West, Nigeria. Al-Hayat: Journal of Biology and Applied Biology, 6(1), 1-14. |
| [16] | Brooks, A. C., Covino, T. and Hall, E. K. (2022). Evaluating Spatial and Temporal Dynamics of River‐Floodplain Surface Water Connectivity Using Hydrometric, Geochemical and Microbial Indicators. Water Resources Research, 58(5), e2021WR030336, |
| [17] | Dandesa, B., Akuma, D. A. and Alemayehu, E. (2023). Water purification improvement using Moringa oleifera seed extract pastes for coagulation follow scoria filtration. Heliyon, 9(7). |
| [18] | Feng, Y., Luo, C., Chen, X., Gu, J., Zhang, Y., Chao, M. and Yan, L. (2022). Shell inspired heterogeneous membrane with smaller bandgap toward sunlight-activated sustainable water purification. Chemical Engineering Journal, 440, 135910. |
| [19] | Horn, L., Shakela, N., Mutorwa, M. K., Naomab, E. and Kwaambwa, H. M. (2022). Moringa oleifera as a sustainable climate-smart solution to nutrition, disease prevention, and water treatment challenges: A review. Journal of Agriculture and Food Research, 10, 100397. |
| [20] | Pandey, P. and Khan, F. (2022). Moringa oleifera Plant as potent alternate to Chemical Coagulant in Water Purification. Brazilian Journal of Pharmaceutical Sciences, 58, e201158. |
| [21] | Adah, A. D., Saidu, L., Oniye, S. J., Kazeem, H. M. and Adah, S. A. (2021). Prevalence and risk factors associated with Aeromonas hydrophila infection in Clarias gariepinus and pond water from fish farms in Kaduna State, Nigeria. Jordan Journal of Biological Sciences, 14(3), 477-484, |
| [22] |
Martínez-Gallardo, M. R., López, M. J., López-González, J. A., Jurado, M. M., Suárez-Estrella, F., Pérez-Murcia, M. D. and Moreno, J. (2021). Microbial communities of the olive mill wastewater sludge stored in evaporation ponds: The resource for sustainable bioremediation. Journal of Environmental Management, 279, 111810.
https://doi.org/10.1016/j.jenvman.2020.111810 Epub 2020 Dec 17. |
| [23] | Liu, Z., Xu, D., Pang, B., Wang, S., Wang, S., Gao, Y. and Kong, M. G. (2021). Evaluation of microbial species inactivation and purification of pond sewage by a custom‐built air surface discharge plasma. Plasma Processes and Polymers, 18(6), 2100004, |
| [24] | Grinberga, L., Grabuza, D., Grinfelde, I., Lauva, D., Celms, A., Sas, W. and Dzieciol, J. (2021). Analysis of the removal of BOD5, COD and suspended solids in subsurface flow constructed wetland in Latvia. Acta Scientiarum Polonorum. Architectura, 20(4), 21-28, |
| [25] | Azuh V. O., Alkhalil S. S., Osuntokun O. T., Oyewole O. A., Jimoh O. T., Maddela N. R. (2026). Loop-Mediated Isothermal Amplification (LAMP) Assay for Rapid Detection and Differentiation of Selected Escherichia coli from Other Enterobacteriaceae. Indian J Med Microbiol. 28:101070, ISSN 0255-0857, |
| [26] | Prieto, Jacqui, Murphy, Catherine, Stewart, Fiona and Fader, Miranda (2021) Intermittent catheter techniques, strategies and designs for managing long‐term bladder conditions. Cochrane Database of Systematic Reviews, 2021 (10), 1-74, [CD006008]. |
| [27] | Osuntokun, .O. T (2024). Nicotiana Tabacum Essential Oil Extract from Cigarettes Products against Diverse Smokers Mouth Floral Isolates. Microbiology Archives, an International Journal. Vol 6(1); Pp 30 -39. |
| [28] | Patel H. and Rawat S. (2021). New and future developments in microbial biotechnology and bioengineering, Elsevier 69-93 |
| [29] | Oluwakemi Abike Thonda, Fatimah Adenike Ajadi, Olanrewaju Oludotun Daramola, Aderiike Adewumi Grace, Oludare Temitope Osuntokun, Daniel Ayandiran Aina, Temitope Elizabeth Oyewole, Rukevwe Collins Etareri (2025). Preparation and Characterization of Newbouldia laevis (P.Beauv.) Seem. mediated Gold and Alloy Nanoparticles and Evaluation of Its Bactericidal Effect on Clinical Pathogens, Jordan Journal of Biological Science, 18(2), Pp 281 - 290. |
| [30] | Rai M., Zimowska B., Kövics G. J. (2022) The Genus Phoma: What We Know and What We Need to Know? In book: Rai M., Zimowska B., Kövics G. J. (eds) Phoma: Diversity, Taxonomy, Bioactivities, and Nanotechnology. (pp. 3-11) Publisher: Springer, Cham: Springer International Publishing. |
| [31] | Nair Abhinav and Sarma Saurabh Jyoti (2021) The impact of carbon and nitrogen catabolite repression in microorganisms, Review Microbiol Res 2021 Oct: 251: 126831. |
| [32] | Sharma D, Denmat SH, Matzke NJ, Hannan K, Hannan RD, O'Sullivan JM, Ganley ARD (2022). A new method for determining ribosomal DNA copy number shows differences between Saccharomyces cerevisiae populations. Genomics 114(4):110430, |
| [33] | Li J-J, Zhao S-P, Zhao D, Lu G-P, Peng D-Q, Liu J, Chen Z-Y, Guo Y-L, Wu N-Q, Yan S-K, Wang Z-W and Gao R-L (2023) 2023 Chinese guideline for lipid management. Front. Pharmacol. 14:1190934. |
| [34] | Saroj, P., P, M. & Narasimhulu, K. (2022). Biochemical Characterization of Thermostable Carboxymethyl Cellulase and β-Glucosidase from Aspergillus fumigatus JCM 10253. Appl Biochem Biotechnol 194, 2503-2527 (2022). |
| [35] | Singh G, Sharma K., Sharma L. K., Kumar A. and Parihar K.(2024). FLD (Front Line Demonstration) on the Area Specific Mineral Mixture on the Milk Production of Murrah Buffaloes under Climatic Conditions of Tonk, The Journal of Rural and Agricultural Research Volume 24 No. 2, 51-57. |
| [36] | Sarwan, J., Sahani, S., Nair, M. V., Bhargav, S., Kumar, S., Singh, R. and Bose, K. J. C. (2024). Multiple factors influencing Theobroma cacao and their impact on the chocolate market worldwide. In Sustainable Cacao Cultivation in Latin America. 256-269, Routledge. |
APA Style
Temitope, O. O., Ademola, Y. M., Bisola, F. J. (2026). Sustainable Water Management in Aquaculture: Comparing Eco-Friendly and Conventional Treatment Strategies (Fish Farm). Journal of Diseases and Medicinal Plants, 12(2), 70-87. https://doi.org/10.11648/j.jdmp.20261202.11
ACS Style
Temitope, O. O.; Ademola, Y. M.; Bisola, F. J. Sustainable Water Management in Aquaculture: Comparing Eco-Friendly and Conventional Treatment Strategies (Fish Farm). J. Dis. Med. Plants 2026, 12(2), 70-87. doi: 10.11648/j.jdmp.20261202.11
@article{10.11648/j.jdmp.20261202.11,
  author = {Osuntokun Oludare Temitope and Yusuf-Babatunde Moruf Ademola and Fapohunda Juliet Bisola},
  title = {Sustainable Water Management in Aquaculture: Comparing Eco-Friendly and Conventional Treatment Strategies (Fish Farm)},
  journal = {Journal of Diseases and Medicinal Plants},
  volume = {12},
  number = {2},
  pages = {70-87},
  doi = {10.11648/j.jdmp.20261202.11},
  url = {https://doi.org/10.11648/j.jdmp.20261202.11},
  eprint = {https://article.sciencepublishinggroup.com/pdf/10.11648.j.jdmp.20261202.11},
  abstract = {This study investigated the comparative effects of natural and chemical treatments on pond water samples obtained from the AAUA Fishery, with emphasis on microbial load reduction, diversity, antibiotic susceptibility, fungal occurrence, and molecular resistance gene detection. Treatments applied included Moringa oleifera leaf powder (0.5 g and 1 g), chlorine (0.5 g and 1 g), and direct sunlight exposure, while untreated samples served as controls. Microbiological analyses were performed using serial dilution, spread plating, colony morphology, Gram staining, and biochemical characterization, with bacterial identification supported by Bergey’s Manual of Determinative Bacteriology. Fungal isolates were identified based on cultural and microscopic features, and antibiotic susceptibility was assessed using the Kirby–Bauer disk diffusion method. PCR amplification was used to detect selected antibiotic resistance genes. Results showed that 0.5 g of Moringa moderately reduced bacterial counts from 3.5 × 10⁴ to 7.0 × 10³ CFU/mL (10-3 dilution) and from 2.0 × 10⁷ to 6.0 × 10⁶ CFU/mL (10-6 dilution) over 6 h, while 1 g produced weaker inhibition. Sunlight treatment was more effective, lowering bacterial load from 6.0 × 10⁴ to 7.0 × 10³ CFU/mL and from 3.5 × 10⁷ to 4.0 × 10⁶ CFU/mL across dilutions. Chlorine was the most potent treatment, achieving complete elimination of bacterial growth within 4–6 h at both concentrations. Control samples only showed a natural decline in bacterial counts. Biochemical and colony analyses revealed diverse bacterial species, including Staphylococcus aureus, Micrococcus luteus, Bacillus spp., Aeromonas hydrophila, Enterococcus faecalis, Corynebacterium sp., Vibrio cholerae, and Listeria monocytogenes. Antibiotic susceptibility tests indicated that both Gram-positive and Gram-negative isolates exhibited multidrug resistance, with inhibition zones ranging between 10 mm and 16 mm. Fungal isolates included Aspergillus fumigatus, Aspergillus terreus, Aspergillus sydowii, Eurotium sp., and Aspergillus flavus. Molecular assays detected the presence of blaOXA and qnrA resistance genes, while blaNDM, blaTEM, blaSHV, tetA, tetB, and cmlA were not detected. These findings highlight the superior bactericidal effect of chlorine relative to Moringa oleifera and sunlight, Moringa oleifera become an alternative source to chlorine and its effects on multidrug resistant microorganisms in pond water, but also reveal the persistence of multidrug-resistant bacteria and fungi in treated pond water. The study underscores the need for integrated water treatment approaches and continuous monitoring to safeguard aquaculture productivity and public health.},
 year = {2026}
}
TY  - JOUR
T1  - Sustainable Water Management in Aquaculture: Comparing Eco-Friendly and Conventional Treatment Strategies (Fish Farm)
AU  - Osuntokun Oludare Temitope
AU  - Yusuf-Babatunde Moruf Ademola
AU  - Fapohunda Juliet Bisola
Y1  - 2026/04/13
PY  - 2026
N1  - https://doi.org/10.11648/j.jdmp.20261202.11
DO  - 10.11648/j.jdmp.20261202.11
T2  - Journal of Diseases and Medicinal Plants
JF  - Journal of Diseases and Medicinal Plants
JO  - Journal of Diseases and Medicinal Plants
SP  - 70
EP  - 87
PB  - Science Publishing Group
SN  - 2469-8210
UR  - https://doi.org/10.11648/j.jdmp.20261202.11
AB  - This study investigated the comparative effects of natural and chemical treatments on pond water samples obtained from the AAUA Fishery, with emphasis on microbial load reduction, diversity, antibiotic susceptibility, fungal occurrence, and molecular resistance gene detection. Treatments applied included Moringa oleifera leaf powder (0.5 g and 1 g), chlorine (0.5 g and 1 g), and direct sunlight exposure, while untreated samples served as controls. Microbiological analyses were performed using serial dilution, spread plating, colony morphology, Gram staining, and biochemical characterization, with bacterial identification supported by Bergey’s Manual of Determinative Bacteriology. Fungal isolates were identified based on cultural and microscopic features, and antibiotic susceptibility was assessed using the Kirby–Bauer disk diffusion method. PCR amplification was used to detect selected antibiotic resistance genes. Results showed that 0.5 g of Moringa moderately reduced bacterial counts from 3.5 × 10⁴ to 7.0 × 10³ CFU/mL (10-3 dilution) and from 2.0 × 10⁷ to 6.0 × 10⁶ CFU/mL (10-6 dilution) over 6 h, while 1 g produced weaker inhibition. Sunlight treatment was more effective, lowering bacterial load from 6.0 × 10⁴ to 7.0 × 10³ CFU/mL and from 3.5 × 10⁷ to 4.0 × 10⁶ CFU/mL across dilutions. Chlorine was the most potent treatment, achieving complete elimination of bacterial growth within 4–6 h at both concentrations. Control samples only showed a natural decline in bacterial counts. Biochemical and colony analyses revealed diverse bacterial species, including Staphylococcus aureus, Micrococcus luteus, Bacillus spp., Aeromonas hydrophila, Enterococcus faecalis, Corynebacterium sp., Vibrio cholerae, and Listeria monocytogenes. Antibiotic susceptibility tests indicated that both Gram-positive and Gram-negative isolates exhibited multidrug resistance, with inhibition zones ranging between 10 mm and 16 mm. Fungal isolates included Aspergillus fumigatus, Aspergillus terreus, Aspergillus sydowii, Eurotium sp., and Aspergillus flavus. Molecular assays detected the presence of blaOXA and qnrA resistance genes, while blaNDM, blaTEM, blaSHV, tetA, tetB, and cmlA were not detected. These findings highlight the superior bactericidal effect of chlorine relative to Moringa oleifera and sunlight, Moringa oleifera become an alternative source to chlorine and its effects on multidrug resistant microorganisms in pond water, but also reveal the persistence of multidrug-resistant bacteria and fungi in treated pond water. The study underscores the need for integrated water treatment approaches and continuous monitoring to safeguard aquaculture productivity and public health.
VL  - 12
IS  - 2
ER  -
Department of Microbiology, Adekunle Ajasin University, Akungba-Akoko, Nigeria
Department of Pharmacy Technician, Ogun State Polytechnic of Health and Allied Sciences, Ilese-Ijebu, Nigeria
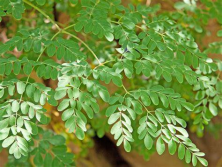
Figure 1. Image of Moringa olifera [14].
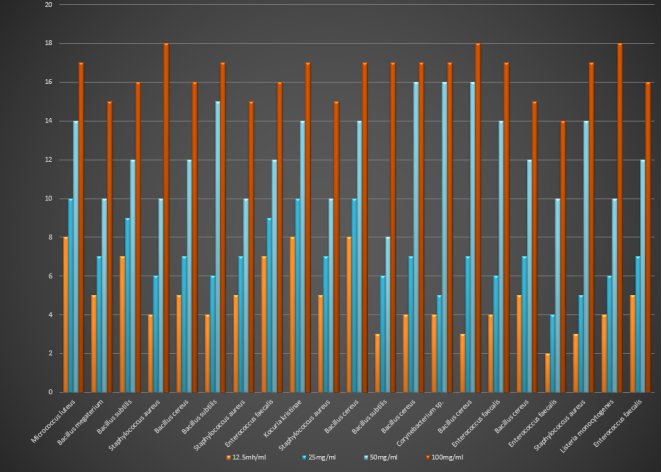
Figure 2. Antibiotic susceptibility profile of Gram positive bacteria isolated against Moriga Olefera Water samples from AAUA Fishery Pond.
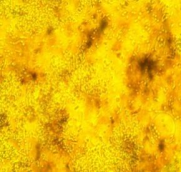
Figure 3. Micrograph of Aspergillus fumigatus.
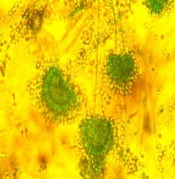
Figure 4. Micrograph of Aspergillus terries (Thom).
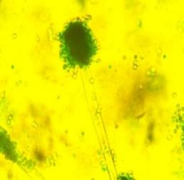
Figure 5. Micrograph of Aspergillus sydowi.
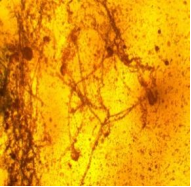
Figure 6. Micrograph of Aspergillus devatus.
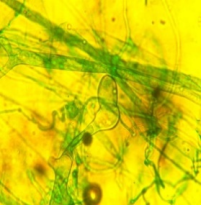
Figure 7. Micrograph of Aspergillus flavus.
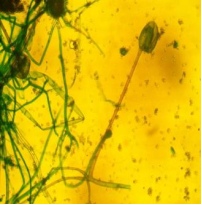
Figure 8. Micrograph of Eurotum spp.
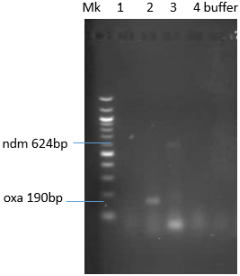
Figure 9. Shows the gel electrophoresis.
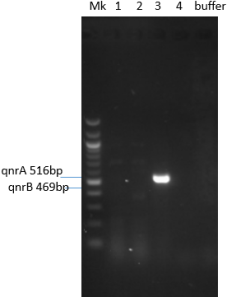
Figure 10. Agarose gel electrophoresis of the PCR products of qnrA and qnrB genes amplified from selected bacteria isolates. (Band size approximately 516bp and 469bp indicating qnrA and qnrB respectively).
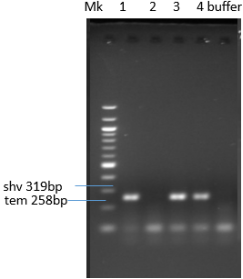
Figure 11. Agarose gel electrophoresis of the PCR products of ESBL TEM and SHV gene amplified from selected bacteria isolates. (Band size approximately 258bp and 318bp indicating TEM and SHV respectively).
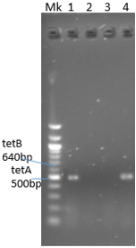
Figure 12. Agarose gel electrophoresis of the PCR products of tetA and tetB gene amplified from selected bacteria isolates. (Band size approximately 500bp and 640bp indicating tetA and tetB respectively).
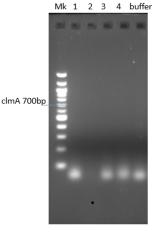
Figure 13. Agarose gel electrophoresis of the PCR products of clmA genes amplified from selected bacteria isolates. (Band size approximately 700bp).
Information

