1. Introduction
Energy, particularly thermal and electrical, is essential for sustaining human life. It has become indispensable as it fulfills fundamental daily needs such as cooking, lighting, and heating. Additionally, energy plays a vital role in driving technological progress, making life more convenient. Everyday life is nearly impossible without thermal or electrical power. Numerous technological advancements have aimed to address challenges related to energy sources. Solar energy, harnessed from sunlight, is a natural and abundant renewable resource, alongside wind, hydro, biomass, and geothermal energy, providing energy to all living organisms through photosynthesis, essential for growth. Among renewable energy sources, solar energy stands out for its ease of use, limitless supply, quiet operation, and adaptability to various applications
| [1] | Norasikin A. Ludin, A. M Al-Alwani Mahmoud, Abu BakarMohamad, Abd. Amir H. Kadhum, KamaruzzamanSopian, Nor Shazlinah Abdul Karim (2013): Review on the development of natural dye photosensitizer for dye-sensitized Solar Cells. Eslevier: Renewable and Sustainable Energy Reviews. |
[1]
. Solar cells come in various types, including p-n junction semiconductor cells, organic solar cells, polymer cells, hybrid solar cells, and dye-sensitized solar cells (DSSCs). DSSCs differ from other types primarily through the use of organic natural dyes as light absorbers and an electrolyte solution forming an electrochemical system
| [2] | Polo A. S, and Iha N. Y. M (2006): Blue sensitizers for solar cells: natural dyes from Calafate and Jaboticaba. Solar Energy Materials Solar Cells, 90: 1936–1944. |
[2]
. Natural dyes are derived from various plant parts like leaves, bark, flowers, roots, and seeds, each with distinct phytochemical compositions. Over time, several photovoltaic technologies—including organic, inorganic, and hybrid solar cells—have been developed in succession
.
Dyes play a critical role in dye-sensitized solar cells (DSSCs) by absorbing light and facilitating electron transfer with the semiconductor’s conduction band to achieve an optimal quantum yield. In DSSCs, the dye solution functions as a photosensitizer, initiating and sustaining cell operation and performance. The efficiency of natural dye-sensitized solar cells is affected by various factors, including the type of dye sensitizer, extraction solvents, extraction methods, electrolytes, semiconductor materials, transparent conductive oxide (TCO) substrates, and electrodes
| [4] | Mahmoud A. M. Al-Alwani, Abu BakarMohamad, Abd Amir H Kadhum, Norasikin A Ludin, Safie N. E, Razali M. Z, Ismail M., KamaruzzamanSopian (2016): Natural dye extracted from PandanmusAmaryllifolius leaves as Sensitizer in fabrication of dye-sensitized solar cells. International Journal of Electrochemical Science, vol. 12, pg 747-761. https://doi.org/10.20964/2017.01.56 |
| [5] | Pratiwi D. D, Nurosyid F, Kusumandari, Supriyanto A, and Suryana R (2017): Performance improvement of dye –sensitized solar cells (DSSC) by using dyes mixture from chlorophyll and anthocyanin. International Conference on Science and Applied Science, IOP Conference series: Journal of Physics Conference series 909 (2017) 012025. https://doi.org/10.1088/1742-6596/909/1/012025 |
[4, 5]
.
Extensive research has been conducted on the effectiveness of single dyes versus dye mixtures, using distilled water and ethanol separately to extract key pigments like anthocyanins and chlorophyll from diverse plant species. Characterization techniques such as UV-Vis spectrophotometry, FTIR, SEM, and EDS have demonstrated the superior performance of ethanol as an extraction solvent over water, as well as the advantages of dye mixtures over single dyes
| [5] | Pratiwi D. D, Nurosyid F, Kusumandari, Supriyanto A, and Suryana R (2017): Performance improvement of dye –sensitized solar cells (DSSC) by using dyes mixture from chlorophyll and anthocyanin. International Conference on Science and Applied Science, IOP Conference series: Journal of Physics Conference series 909 (2017) 012025. https://doi.org/10.1088/1742-6596/909/1/012025 |
| [6] | Wongcharee K, Meeyoo V, Chavadej S (2006): Dye-sensitized solar cell using natural dyes extracted from rosella and blue pea flowers. Solar Energy Materials and Solar Cells, vol. 91,566–571. ELSEVIER, ScienceDirect. https://doi.org/10.1016/j.solmat.2006.11.005 |
| [7] | Dayang S., Irwanto M., Gomesh N., and Ismail B. (2017): Natural Dye from Roselle Flower as a Sensitizer in Dye-Sensitized Solar Cell (DSSC). Indonesian Journal of Electrical Engineering and Computer Science, vol. 9, No. 1, January 2018, pp 191-197. ISSN:2502-4752, https://doi.org/10.11591/ijeecs.v9.il.pp191-197 |
[5-7]
. The UV-Vis absorption spectra of dye-loaded photoanodes are notably influenced by the extraction method. Studies comparing mechanical, ultrasonic-assisted, and acidic solvent extraction (ASE) methods indicate that ASE significantly improves power conversion efficiency when using the same sensitizer
.
For instance, ethanol mixed with distilled water at a 70:30 ratio for anthocyanin extraction yielded a fill factor of 0.55 and an efficiency of 0.21%
| [9] | Teoli F et al., 2016: Role of pH and Pigment Concentration for Natural DSSC Treated with AnthocyaninExtracts of Common Fruits. Journal of Photochemistry, Photobiology, A316, 24-30. |
[9]
. In this study, we focus on using roselle flowers and neem leaves—sources of anthocyanins and chlorophyll, respectively—as photosensitizers. Distilled water and ethanol, along with various combinations of these solvents, were tested to assess their potential for future DSSCs fabrication.
2. Materials and Methodology
Two of the natural plants of interest to this study have been selected mainly because of their abundant supply, low cost and effectiveness in DSSCs fabrication. They are; Neem leaves (Azadirachtaindica) and Roselle flower (Hibiscussadrifera). The dye extracts from these plants are chlorophyll and anthocyanin pigments respectively. Other materials are, distilled water and ethanol.
2.1. Neem Tree (Azadirachtaindica)
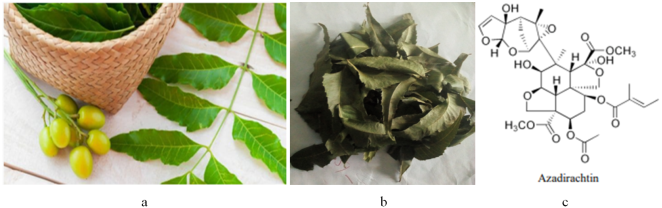
Neem tree is an omnipotent tree and a sacred gift of nature. Neem is mainly cultivated in the Indian subcontinent, and it belongs to the mahogany family called Meliaceae. Neem tree is an incredible plant that has been declared the ‘Tree of the 21st Century” by the United Nations (www.unep.org/web/tree-a-day/neem.asp) as it is useful for its multi-various traditional medicine purposes. Neem leaf is very rich in chlorophyll pigment and exists as chlorophyll a, its main pigment and chlorophyll b, an accessory pigment.
Chlorophyll pigment extract from neem leaves is very stable and does not degrade for a long time. It absorbs light in the visible range spectrum, (peaks at 400 – 490nm and 630 – 700nm) and reflects green color. It is soluble in both organic and inorganic solvents, thus making it a very good source of photo-sensitizer for DSSCs device
| [5] | Pratiwi D. D, Nurosyid F, Kusumandari, Supriyanto A, and Suryana R (2017): Performance improvement of dye –sensitized solar cells (DSSC) by using dyes mixture from chlorophyll and anthocyanin. International Conference on Science and Applied Science, IOP Conference series: Journal of Physics Conference series 909 (2017) 012025. https://doi.org/10.1088/1742-6596/909/1/012025 |
| [10] | Santosh K. S,BabitaAgrawal, Akhilesh Kumar and ArchanaPandey (2020): Phytochemicals of AzadirachtaIndica Source of Active Medicinal Constituent Used for Cure of various Diseases: A Review. Journal of Scientific Research, volume 64, issue 1. http://dx.doi.org/10.37398/JSR.2020.640153 |
[5, 10]
. The neem fresh leaves with seeds, dry leaves and phytochemical structure are displayed in
Figure1a, 1b, and 1c respectively below.
Figure 1. a: Fresh Neem leaves and seeds.1b: Dried Neemleaves.1c: Phytochemical structure of chlorophyll from Neem leaf.
2.2. Roselle Flower (Hibiscus Sabdariffa)
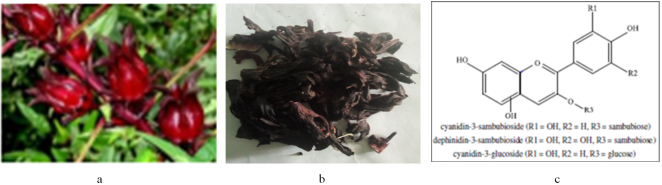
Hibiscus is a genius of flowering plants in the mallow family of Malvaceae. The genius is quite large comprising several hundred species that are native to warm temperate subtropical and tropical regions throughout the world. Members are renowned for their large showy flowers and those species are commonly known as ‘hibiscus’ or less widely known as rose mallow. Other names include hardy hibiscus, rose of Sharon, and tropical hibiscus (https://en.m.wikipedia.org). Hibiscus
Sabdariffa L commonly called roselleflower,a specie of flowering plant in the genius hibiscus that is native to Africa, most likely West Africa. All true roselle plants, which might be known locally as rosella, red sorrel, Florida cramberry, or Jamaica sorrel, are hibiscus plants, but not all hibiscus plants are roselle. Hibiscus plant is rich in antioxidants such as beta-carotene, vitamin C, and anthocyanin. Antioxidants destroy harmful molecules known as free radicals within the body system (https://health.clevelaudclinic.org). Phytochemical composition contained in roselle dye is anthocyanin pigment, whose colors range from red to purple. Fresh roselle flower, dry roselle flower, and phytochemical structure are displayed in
Figure 2a – 2c.
Figure 2. a: Fresh natural roselleflower.b: Dried roselle flower. c: Phytochemical structure of anthocyanin from roselle flower.
2.3. Experimental Procedure
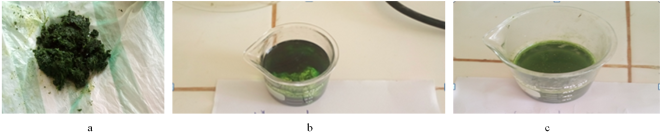
To prepare chlorophyll extract from neem leaves, 10g of fresh neem leaves were thoroughly washed with distilled water and then air-dried at room temperature. The dried leaves were crushed using a mortar and pestle to form a paste, soaked in 50ml of warm distilled water at 50°C for 12 hours. The solution was filtered multiple times with Whatman No. 42 filter paper to obtain a pure chlorophyll extract labeled as Nw (Neem in water). Similarly, a paste of 10g of neem leaves was prepared with 50ml of ethanol as the extracting solvent at room temperature, denoted as Ne(Neem in ethanol). The pH levels of both solutions were adjusted to 2.2 using 0.2M ofHCl and NaOH, to form a mild pH chosen to optimize DSSCs performance.
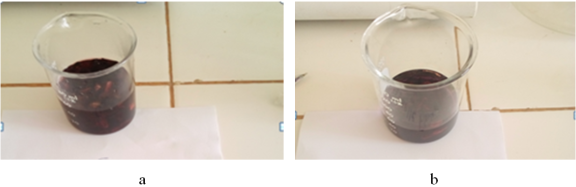
For thisstudy, dried roselle flower (commonly called‘zobo’) was purchased locally. Each 10g batch was rinsed with distilled water to remove dust, macerated in 50ml of warm distilled water at 50°C and 50ml of ethanol as extracting solvents in separate containers at room temperature for 12 hours. This temperature range (20°C to 60°C) is optimal for anthocyanin extraction, as higher temperatures may lead to thermal degradation, and lower temperatures reduce solubility, producing a lighter-colored extract that decreases DSSCs efficiency
| [6] | Wongcharee K, Meeyoo V, Chavadej S (2006): Dye-sensitized solar cell using natural dyes extracted from rosella and blue pea flowers. Solar Energy Materials and Solar Cells, vol. 91,566–571. ELSEVIER, ScienceDirect. https://doi.org/10.1016/j.solmat.2006.11.005 |
| [11] | IbadiAlaa Abbas, 2015: Extraction of Anthocyanin Pigments from Different Plants and Study the Effect of Solvents, Temperatures and pH Variation on it. Journal of Missan Research, vol.11, No: 21, pg 37-44. |
[6, 11]
. The solutions were then filtered with Whatman No. 42 paper to isolate pure filtrates. While anthocyanin performs best at pH 1.0, the pH was maintained at 2.2 to avoid potential substrate damage from higher acidity
| [11] | IbadiAlaa Abbas, 2015: Extraction of Anthocyanin Pigments from Different Plants and Study the Effect of Solvents, Temperatures and pH Variation on it. Journal of Missan Research, vol.11, No: 21, pg 37-44. |
[11]
. The distilled water and ethanol extracts were denoted as H
w (Hibiscus in water) and H
e (Hibiscus in ethanol), respectively.
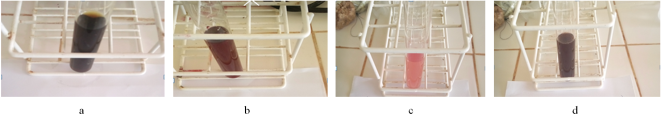
Figure 3. a:Freshneem leaves paste; b:Chlorophyll extract from ethanol(Ne); c:Chlorophyll extract in water (Nw).
Figure 4. a: Anthocyanin extract from distilled water (Hw);b: Anthocyanin extract from ethanol (He).
Figure 5. a: Mixed dye both in ethanol (Ne+He), b: Mixed dye both in distilled water (Nw+Hw), c:Mixed dye in water and ethanol (Nw+He), d:Mixed dye in ethanol and water (Ne+Hw).
Each original extract—N
w, N
e, H
w, and H
e—was used fresh, with all solutions cooled to room temperature before further use. Additionally, eight dye samples were prepared, including four mixed extracts (1:1 ratio) of the four primary dyes, creating the following samples: N
w, N
e, H
w, H
e, (N
w + H
w), (N
e + H
e), (N
w + H
e), and (N
e+ H
w). Each sample underwent UV-Vis absorbance characterization, with results shown in
Figure 6a and 6b, to identify the optimized dye composition that could improve photovoltaic efficiency.
Figure 5a, 5b, 5c, and 5d display the various mixtures of chlorophyll and anthocyanin extracts prepared with distilled water and ethanol.
3. Results and Discussion
The following results of various characterizations such as UV-Visible absorbance photospectroscopy, Fourier Transform Infrared (FTIR), and X-ray Diffraction (XRD) were carried out for analysis and discussion.
3.1. Ultraviolet-Visible (UV) Spectroscopy Absorbance Characterization
UV-visible absorbance measurement was carried out using BIOBASE UV-VIS (B-UV1800PC) Spectrophotometer.
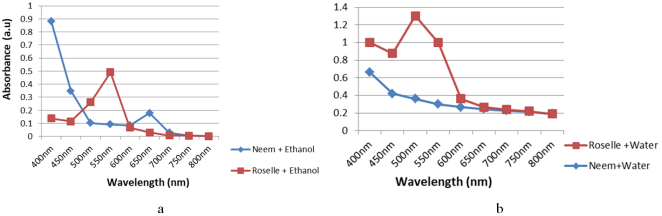
Figure 6a and 6b show absorbance characteristics of chlorophyll and anthocyanin when extracted in ethanol and distilled water respectively before they are mixed. Each graph shows the absorbance responses and the corresponding peaks of each pigment to light illumination for different extracting solvents. Ethanol seems to be good extracting solvent for both pigments, though better in neem than roselle. The neem displayed two notable peaks in ethanol with the first peak at 440nm which could be attributed to chlorophyll
a pigment while the second peak occurred at 670nm and attributed to chlorophyll
bbeingaccessory pigment. The two peaks are typical absorbance wavelength range of chlorophyll pigment. Roselle however has one absorbance peak at 560nm.
Figure 6. a: Absorbance characteristics of chlorophyll and anthocyanin extracted using ethanol solvent; b: Absorbance characteristics of chlorophyll and anthocyanin extract using distilled water.
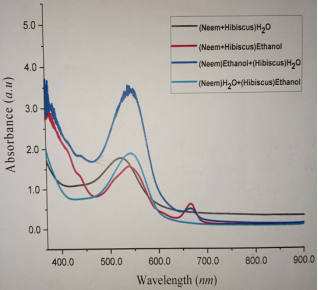
Figure 7. Absorbance Characteristics of Dye Mixtures in different Solvent combinations.
Roselle displayed notable performance over neem in distilled water extraction with an absorbance peak at 530nm while neem peaks at 420nm. It could be inferred that distilled water seemed not to be too good as extraction solvent of chlorophyll pigment from neem leaves, while ethanol served as better extracting solvent for both chlorophyll and anthocyanin pigments. Again, the absorbance values of neem extract with ethanol dropped from 0.88 a.u to 0.68 a.u, in distilled water. Reverse was the case in roselle extract where the absorbance values increased from 0.5 a.u in ethanol to 1.3 a.u in distilled water. The results indicate that anthocyanin extracted with distilled water absorbs more photons which is a requirement for a good sensitizer in DSSCs operation. Similarly, chlorophyll extracted with ethanol also absorbed more light photons than anthocyanin in the same solvent. It is expected that the mixture of these dyes that give maximum photon absorbance would be ideal for DSSCs fabrication as this is clearly revealed in the figure containing dye mixtures below.
Figure 7 compares dye mixture of chlorophyll and anthocyanin extracts from neem leaves and roselle flower in different solvents respectively. All the samples exhibited the first absorption peak almost within the same spectrum range of 530nm and 560nm but having different absorbance values. The second peaks were observed for only dye mixture from neem in ethanol (N
e) and hibiscus in water (H
w), and from neem and hibiscus in ethanol at 660nm wavelength. These peaks are characteristics of typical chlorophyll and anthocyanin especially when extracted in ethanol solvent
| [6] | Wongcharee K, Meeyoo V, Chavadej S (2006): Dye-sensitized solar cell using natural dyes extracted from rosella and blue pea flowers. Solar Energy Materials and Solar Cells, vol. 91,566–571. ELSEVIER, ScienceDirect. https://doi.org/10.1016/j.solmat.2006.11.005 |
| [12] | Swarnkar A. K, Sanjay S, Nikhil C, Rajesh K. G, Bhoraskar S. V, and Tejashree M. B (2014): Nanocrystalline titanium dioxide sensitized with natural dyes for eco-friendly solar cell application. Journal of Experimental Nanoscience, Taylor & Francis. http://dx.doi.org/10.1080/17458080.2014.951410 |
| [13] | Dahlang T, Wilda S, Gareso P. L and AbdullahB (2018): Dye sensitized solar cell (DSSC) with natural dyes extracted from Jatropha leaves and purple Chrysanthemum flowers as sensitizer. The 2nd International Conference on Science (ICOS). Journal of Physics: conference series 979 (2018) 012056, page 1-7. https://doi.org/10.1088/1742-6596/979/1/012056 |
[6, 12, 13]
. Apart from having the highest peak, N
e+H
w also have the broadest band spectrum within the range 470nm and 630nm. This can be attributed to the presence and effect of chlorophyll
bin addition to chlorophyll
awhen ethanol is used to extract neem leaves. Again, the colors of the dye mixture as in
figure 5a, b, c, d could also be responsible for the wider band in the absorbance spectrum
| [12] | Swarnkar A. K, Sanjay S, Nikhil C, Rajesh K. G, Bhoraskar S. V, and Tejashree M. B (2014): Nanocrystalline titanium dioxide sensitized with natural dyes for eco-friendly solar cell application. Journal of Experimental Nanoscience, Taylor & Francis. http://dx.doi.org/10.1080/17458080.2014.951410 |
| [14] | Zainal A, Sudjito S, Denny W, and Suyitno S (2016): Performance Enhancement of Dye-Sensitized Solar Cells Using a Natural Sensitizer. Hindawi International Journal of Photoenergy, vol 2017, Article ID 2704864, page 1-5. https://doi.org/10.1155/2017/2704864 |
[12, 14]
. Altogether, the absorbance values of each mixture increased compared with the one obtained in a separate solvent.
Dye mixture of N
e+H
w is a novel one and makes use of the fact that chlorophyll dye extract from neem leaves is more stable in ethanol while roselle flower extract is better in water for long term stability
| [4] | Mahmoud A. M. Al-Alwani, Abu BakarMohamad, Abd Amir H Kadhum, Norasikin A Ludin, Safie N. E, Razali M. Z, Ismail M., KamaruzzamanSopian (2016): Natural dye extracted from PandanmusAmaryllifolius leaves as Sensitizer in fabrication of dye-sensitized solar cells. International Journal of Electrochemical Science, vol. 12, pg 747-761. https://doi.org/10.20964/2017.01.56 |
| [6] | Wongcharee K, Meeyoo V, Chavadej S (2006): Dye-sensitized solar cell using natural dyes extracted from rosella and blue pea flowers. Solar Energy Materials and Solar Cells, vol. 91,566–571. ELSEVIER, ScienceDirect. https://doi.org/10.1016/j.solmat.2006.11.005 |
[4, 6]
. Generally, dye mixtures aim to widen the wavelength range of light absorption, which can enhance the incident photo-conversion efficiency
| [5] | Pratiwi D. D, Nurosyid F, Kusumandari, Supriyanto A, and Suryana R (2017): Performance improvement of dye –sensitized solar cells (DSSC) by using dyes mixture from chlorophyll and anthocyanin. International Conference on Science and Applied Science, IOP Conference series: Journal of Physics Conference series 909 (2017) 012025. https://doi.org/10.1088/1742-6596/909/1/012025 |
[5]
.
Figure 7 displays combined effect of absorption peaks of chlorophyll and anthocyanin in various mixtures of ethanol and distilled water solvents. Before mixture, the absorption peaks of chlorophyll in ethanol were found at wavelengths 430nm and 670nm,while anthocyanin in water peaks at 570nm as shown in
Figure 6a and 6b. The combined effect from the broad band spectrum of the mixture dye which incorporates the two peaks in the wider band from 480nm to 630nm with maximum peak at 550nm was shown in
Figure 6b. This can be attributed to different solvents used where each of the solvents was affected by the level of polarity of each solvent. The result is to cause a shift in the absorption peak and level of absorbance, which may either, be a longer wavelength (red shift) or shorter wavelength (blue shift)
| [5] | Pratiwi D. D, Nurosyid F, Kusumandari, Supriyanto A, and Suryana R (2017): Performance improvement of dye –sensitized solar cells (DSSC) by using dyes mixture from chlorophyll and anthocyanin. International Conference on Science and Applied Science, IOP Conference series: Journal of Physics Conference series 909 (2017) 012025. https://doi.org/10.1088/1742-6596/909/1/012025 |
[5]
.
Although, anthocyanin is more soluble in ethanol and showed a broad absorption band in the visible spectrum region, however, its efficiency dropped drastically when exposed to light illumination. This is due to the photocatalytic decomposition of anthocyanin molecules when in contact with semiconductor oxide (Titanium IV oxide - TiO
2) in the presence of ethanol which makes the color of the photo-anode to become pale within a short time of light illumination. As a result, ethanol is less suitable as an anthocyanin extracting solvent for long term DSSCs operation
| [6] | Wongcharee K, Meeyoo V, Chavadej S (2006): Dye-sensitized solar cell using natural dyes extracted from rosella and blue pea flowers. Solar Energy Materials and Solar Cells, vol. 91,566–571. ELSEVIER, ScienceDirect. https://doi.org/10.1016/j.solmat.2006.11.005 |
[6]
. In the same vein, though water is not as good as ethanol in the absorption spectrum, however, in this novel mixture, water seems to serve as antidote to ethanol volatility for long time stability of DSSCs operation. This can be seen from the result of UV-Vis absorbance spectroscopy in
Figure 7, where this mixture gives the highest absorbance value among the rest of the mixtures. This choice of dye mixture (N
e+H
w) could be used as the optimized dye for DSSCs fabrication for better performance.
3.2. Fourier Transform Infrared (FTIR) Analysis
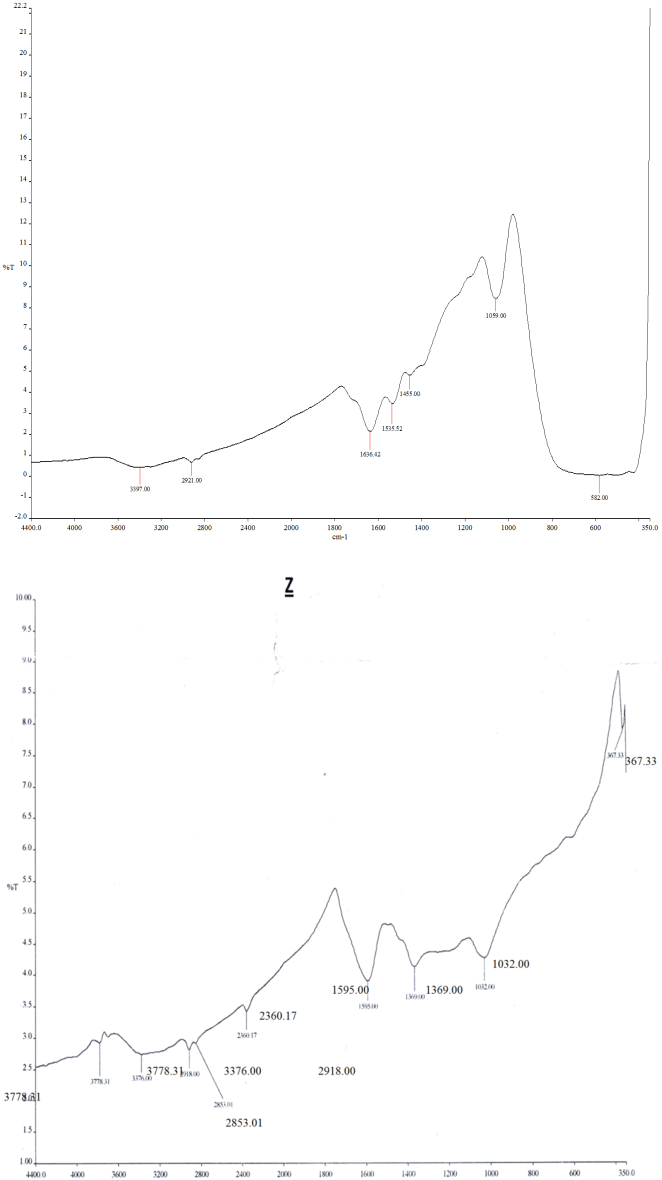
FTIR analysis helps assess a dye's capability to bond effectively with semiconductor nanoparticles, enhancing light-harvesting efficiency. The FTIR spectrum for pure TiO
2(shown in
Figure 8a) reveals several key absorption peaks. A broad band at 3397.00 cm
-1 indicates the presence of an O-H group, while a peak at 2921.00 cm
-1 corresponds to a C-H stretch typical of alkanes. These groups promote strong anchoring of the dye onto TiO
2 | [14] | Zainal A, Sudjito S, Denny W, and Suyitno S (2016): Performance Enhancement of Dye-Sensitized Solar Cells Using a Natural Sensitizer. Hindawi International Journal of Photoenergy, vol 2017, Article ID 2704864, page 1-5. https://doi.org/10.1155/2017/2704864 |
[14]
. Additionally, a peak at 1636.42 cm
-1 suggests the presence of a carbon double bond within a carboxyl group, and a C-C aromatic ring bond appears at 1535.52 cm
-1. A minor peak at 1455.00 cm
-1 represents a phenolic C-H bond, while peaks at 1059.00 cm
-1 and 582.00 cm
-1 indicate the presence of a C-O aromatic ring and an alkyl halide (C-Br bond), respectively
| [12] | Swarnkar A. K, Sanjay S, Nikhil C, Rajesh K. G, Bhoraskar S. V, and Tejashree M. B (2014): Nanocrystalline titanium dioxide sensitized with natural dyes for eco-friendly solar cell application. Journal of Experimental Nanoscience, Taylor & Francis. http://dx.doi.org/10.1080/17458080.2014.951410 |
| [14] | Zainal A, Sudjito S, Denny W, and Suyitno S (2016): Performance Enhancement of Dye-Sensitized Solar Cells Using a Natural Sensitizer. Hindawi International Journal of Photoenergy, vol 2017, Article ID 2704864, page 1-5. https://doi.org/10.1155/2017/2704864 |
| [15] | Ahliha A. H, Nurosyid F, Supriyanto A, and Kusumaningsih T (2017): The Chemical bonds effect of anthocyanin and chlorophyll dyes on TiO2 for dye-sensitized solar cell (DSSC). International Conference on Science and Applied Science. IOP Conference Series: Journal of Physics: Conference Series909 012013. https://doi.org/10.1088/17542-6596/909/1/012013 |
[12, 14, 15]
.
In our optimized dye mixture (N
e+H
w), FTIR analysis (
Figure 8b) reveals various functional groups and bond formations at specific wavenumbers. A broad band, likely due to residual distilled water in the dye mixture, appears around 3376.00 cm
-1 and represents an O-H stretch. This peak’s relative weakness could result from the ethanol and water mixture, which might lower absorbance strength. A peak at 2918.00 cm
-1 indicates an anthocyanin-associated C-H aromatic ring, with another weak C-H peak at 2853.01 cm
-1, likely derived from the chlorophyll in neem leaves
| [12] | Swarnkar A. K, Sanjay S, Nikhil C, Rajesh K. G, Bhoraskar S. V, and Tejashree M. B (2014): Nanocrystalline titanium dioxide sensitized with natural dyes for eco-friendly solar cell application. Journal of Experimental Nanoscience, Taylor & Francis. http://dx.doi.org/10.1080/17458080.2014.951410 |
| [14] | Zainal A, Sudjito S, Denny W, and Suyitno S (2016): Performance Enhancement of Dye-Sensitized Solar Cells Using a Natural Sensitizer. Hindawi International Journal of Photoenergy, vol 2017, Article ID 2704864, page 1-5. https://doi.org/10.1155/2017/2704864 |
[12, 14]
. These fall within the alkane bonding category. A peak at 2360.17 cm
-1 suggests the presence of triple bonds, either C≡C or C≡N, corresponding to alkyne or nitrile groups. Chlorophyll
a appears in the carboxyl group as an aromatic C-C bond at 1595.01 cm
-1, possibly contributing to the dye’s stability
| [15] | Ahliha A. H, Nurosyid F, Supriyanto A, and Kusumaningsih T (2017): The Chemical bonds effect of anthocyanin and chlorophyll dyes on TiO2 for dye-sensitized solar cell (DSSC). International Conference on Science and Applied Science. IOP Conference Series: Journal of Physics: Conference Series909 012013. https://doi.org/10.1088/17542-6596/909/1/012013 |
[15]
.
The C=C aromatic ring bond appears at 1369.00 cm
-1 , while anthocyanin shows up as a C-O stretch at 1032.00 cm
-1 | [12] | Swarnkar A. K, Sanjay S, Nikhil C, Rajesh K. G, Bhoraskar S. V, and Tejashree M. B (2014): Nanocrystalline titanium dioxide sensitized with natural dyes for eco-friendly solar cell application. Journal of Experimental Nanoscience, Taylor & Francis. http://dx.doi.org/10.1080/17458080.2014.951410 |
[12]
. A peak at 367.33 cm
-1 signals an alkyl halide (C-Br bond), indicating the presence of both chlorophyll and anthocyanin in the dye mixture
| [17] | Nair S. Sutheertha, 2017: UV-Visible and FTIR Spectroscopic studies of fine powders of Azadirachtaindica leaves. International Journal of Advance Research in Science and Engineering (IJARSE), volume No. 06, Special Issue No.03, AFM-2017. http://www.ijarse.com |
[17]
. Comparison of the spectra shows a shift in the O-H group peaks from 3397.00 cm
-1 in titanium (iv) oxide (TiO
2) to 3376.00 cm
-1 in the optimized dye, suggesting the dye mixture can capture higher-energy photons when adsorbed onto the TiO
2 surface, thereby enhancing photo-conversion efficiency. Notably, the presence of a rare triple bond (C≡C) around 2360.17 cm
-1 offers additional photon-harvesting capacity, as the higher energy of triple bonds enables better electron transport onto the TiO
2 surface, supporting improved photo-conversion efficiency.
Figure 8. a: FTIR characteristics of pure TiO2 nanoparticles,b: FTIR characterization of optimized dye mixture of Ne+ Hw solution.
3.3. X-Ray Diffraction (XRD) Analysis
X-ray diffraction (XRD) analysis revealed the physical properties of the semiconductor nanoparticles, (TiO2) and dye sample. XRD measurement was used to determine the crystal structure and phase of TiO2 nanostructure. The XRD pattern was generated using the Rigaku D/Max-111C X-ray Diffractometer developed by Int. Corp Tokyo, Japan. The equipment was set to produce diffractions at scanning rate of 2°per minute in the range 2° to 50° at room temperature with a CuKa radiation set at 40kV and 20mA. The crystal size was calculated using Scherrer’s formula;
where D is the crystalline grain size of TiO
2, k is a dimensionless constant value (0.94), λ is the wavelength of the incident X-ray radiation, β is the full width at half maximum height {rad(FWHM)}, and θ is the angle of diffraction
| [13] | Dahlang T, Wilda S, Gareso P. L and AbdullahB (2018): Dye sensitized solar cell (DSSC) with natural dyes extracted from Jatropha leaves and purple Chrysanthemum flowers as sensitizer. The 2nd International Conference on Science (ICOS). Journal of Physics: conference series 979 (2018) 012056, page 1-7. https://doi.org/10.1088/1742-6596/979/1/012056 |
[13]
.
The average calculated value of the crystalline grain size of TiO
2 was found to be 183.32 nm. This value agrees with the standard size in literature, which is within the range 10nm-300nm with spherical particle having 250nm while cubic particles range between 150 nm and 300 nm in diameter
| [18] | Liao D. L and Liao B. Q (2007): Shape, size and photocatalytic activity control of TiO2 nanoparticles with surfactants. Journal of Photochemistry and Photobiolog A: Chemistry vol. 187, issues 2-3, pages 363-369. https://doi.org/10.1016/j.jphotochem.2016.11.003 |
[18]
.
Figure 9. XRD pattern for pure TiO2 nanoparticles on FTO substrate.
The highest intensity peaks, observed at an angle of 28.58°, strongly indicate the anatase phase of TiO
2 nanoparticles. Other notable peaks with strong intensity appear at angles 40.28°, 46.30°, 59.29°, and 60.185°, all of which align with anatase phases and match the standard spectrum (JCPDS no. 84-1286)
| [13] | Dahlang T, Wilda S, Gareso P. L and AbdullahB (2018): Dye sensitized solar cell (DSSC) with natural dyes extracted from Jatropha leaves and purple Chrysanthemum flowers as sensitizer. The 2nd International Conference on Science (ICOS). Journal of Physics: conference series 979 (2018) 012056, page 1-7. https://doi.org/10.1088/1742-6596/979/1/012056 |
| [19] | ThamaphatKheamrutai, LimsuwanPichet, andNgotawornchaiBoonlaer (2008): Base Characterization of TiO2 Powder by XRD and TEM. Kasetsart Journal (Natural Science) volume 42; pg 357-361. |
[13, 19]
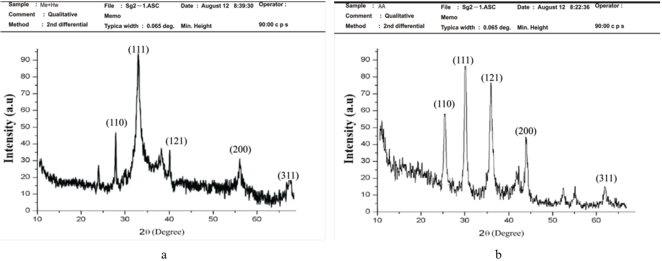
. The XRD of the optimized dye solution, as shown in
Figure 10a, was compared with the XRD pattern after dye adsorption on the TiO
2 substrate (
Figure 10b). A slight decrease in the peak intensity upon adsorption could indicate a chemical change due to intermolecular interactions between the dye and TiO
2 molecules
| [20] | Mashasriyah I, Norasikin A. L, Norul H. H, Mohammed A. I, and Kamaruzzaman S (2018): The Effect of Chenodeoxycholic Acid (CDCA) in Mangosteen (Garciniamangostana) Pericarps Sensitizer for Dye-Sensitized Solar Cell (DSSC). The International Conference of Solid State and Technology, IOP Conference Series: Journal of Physics Conference Series 1083 (2018) 012018. https://doi.org/10.1088/1742-6596/1083/1/012018 |
[20]
. However, the substrate dye displays sharper peaks and narrower band gaps with a slight increase in other peak intensities compared to the optimized dye alone, as seen in
Figures 10a and 10b, respectively. This suggests improved crystallinity and a reduction in particle grain size
| [21] | Bagheri Samira, ShameliKamyar, and Abd Hamid Bee Sharifah (2013): Synthesis and Characterization of AnataseTitaniumDioxide Nanoparticles Using Egg White Solution via Sol-Gel Method. Journal of Chemistry, volume 2013, Article ID 848205, pg 1-5. Hindawi Publishing Corporation. http://dx.doi.org/10.1155/2013/848205 |
[21]
.
Figure 10. a: XRD spectra of optimized dye solution;b:XRD spectra of Optimized dye on TiO2 substrate.
The spectrum also exhibits strong diffraction peaks at various angles, including 25.37°, 30.42°, 35.66°, and 44.25°, with the most intense peak at 30.42°. A shift in the highest peak from 35.24° in pure TiO
2 to 30.42° in the TiO
2 adsorbed optimized dye pattern was observed, maintaining the same intensity. The shift is likely result from intermolecular bonding between the TiO
2 and the dye molecules
| [12] | Swarnkar A. K, Sanjay S, Nikhil C, Rajesh K. G, Bhoraskar S. V, and Tejashree M. B (2014): Nanocrystalline titanium dioxide sensitized with natural dyes for eco-friendly solar cell application. Journal of Experimental Nanoscience, Taylor & Francis. http://dx.doi.org/10.1080/17458080.2014.951410 |
[12]
. The average crystalline grain size of the substrate containing TiO
2 and the adsorbed optimized dye was approximately 126.89 nm, compared to 183.82 nm for pure TiO
2. This reduction in grain size could be attributed to the interaction between the dye and TiO
2 molecules during adsorption. Smaller particle sizes imply a larger band gap, allowing absorption at higher energies, leading to a shift towards shorter wavelengths, known as a blue shift.