The main objective of this study is to compare thirty-five (35) solar radiation models available in the open literature in order to predict monthly solar radiation in two main cities of Cameroon. This estimation and comparison are based on selected statistical comparison parameters named, root mean square error (RMSE), mean bias error (MBE), mean percentage error (MPE) and determination coefficient (R2). These different models are implemented using regression analysis tools named Exel and MATLAB. Estimated values were compared with measured values according to normalized values of statistical parameters, using measured meteorological data of more than 19 years, from 1984 to 2015. All the models have been classified with their associated ranking according to their statistical parameter accuracy. From this study it appears that the models of Ertekin and Yaldiz (MOD20), Togrul and Onat (MOD28), are more accurate than other models. Indeed, for the city of Maroua (MBE%=-2.82E-14; RMSE%=0.862; MPE=-0.00845; R2=0.985), while for Garoua (MBE%=-9.21E-15; RMSE%=0.806; MPE=-0.00631; R2=0.959). according to their accuracy these models can be therefore be used to predict monthly solar radiation for soudano-sahelian regions of Cameroon. Correlation equations found in this paper will help solar energy researcher to estimate data with trust because of its fine agreement with the observed one. hence the models presented in this study could be used to evaluate accurately the solar radiation at any locations with similar climate.
| Published in | International Journal of Sustainable and Green Energy (Volume 13, Issue 2) |
| DOI | 10.11648/j.ijrse.20241302.12 |
| Page(s) | 28-42 |
| Creative Commons |
This is an Open Access article, distributed under the terms of the Creative Commons Attribution 4.0 International License (http://creativecommons.org/licenses/by/4.0/), which permits unrestricted use, distribution and reproduction in any medium or format, provided the original work is properly cited. |
| Copyright |
Copyright © The Author(s), 2024. Published by Science Publishing Group |
Meteorological Data, Global Solar Radiation, Empirical Models, Performance, Statistical Parameters, Cameroon
location | Climate Zone | Latitude(°N) | Longitude (°E) | Elevation (m) |
|---|---|---|---|---|
Maroua | Warm semi-arid (BSh) | 10°28’N | 14°16’E | 423 |
Garoua | Warm semi-arid (BSh) | 9°20’N | 13°23’E | 241 |
Meteorological data denomination | period | Record time (years) |
|---|---|---|
Daily temperature (maximum) | 1980 to 2013 | 21 |
Daily temperature (minimum) | 1980 to 2013 | 21 |
Daily temperature (mean) | 1980 to 2013 | 21 |
Soil Temperature (mean) | 1980 to 2013 | 21 |
relative humidity (mean) | 1980 to 2013 | 21 |
precipitation (mean) | 1980 to 2013 | 21 |
Effective day length (mean) | 1961 to 2015 | 33 |
Monthly Solar radiation (mean) | 1984 to 2015 | 4 |
Type of measurement | Advantages | Limitations |
|---|---|---|
Ground measurements | 1) High accuracy at the point of measurement 2) Good measurements frequency 3) High-quality data (in the rigorously controlled and managed conditions) 4) Redundant measurements enable more stringent quality control | 1) Limited measurement time 2) Number of measurement sites limited 3) Unknown accuracy (in historical data) 4) Different periods of measurement 5) Maintenance Operation of a ground station ( 6) Regular maintenance and calibration) 7) Management of data from many different providers 8) Representation is limited by geography and the level of data aggregation. 9) High costs for acquisition and operation |
Satellite-derived data | 1) Available everywhere (continuous global coverage) 2) Spatial resolution from 3 km 3) Frequency of measurements from 15 minutes 4) Spatial and temporal consistency 5) High calibration stability | 1) Poor instantaneous accuracy for the point estimate (in comparison to high quality ground measurements) 2) Time step 15 and 30min 3) Representation of the area (typically a grid cell 3 to 6 km) |
Mathematical Models | 1) Available according to the model and data involve in the model 2) Models can be extended to other similar sites 3) No direct measurements needed | 1) Low accuracy 2) Accuracy depending on the type of model and local climate |
N° | Mathematical equation | equation type | Authors and reference |
|---|---|---|---|
MOD01 |
| Linear equation | Page 1961 [27] |
MOD02 |
| Linear equation | Glower and McCulloch 1958 [12] |
MOD03 |
| Cubic equation | Samuel 1991 [15] |
MOD04 |
| Logarithmic equation | Ampratwum and Dorvlo 1999 [16] |
MOD05 |
| Linear equation | Dognimaux and Lemoine 1983 [13] |
MOD06 |
| Logarithmic equation | Newland 1989 [28] |
MOD07 |
| Exponential equation | Elagib and Mansell 2000 [29] |
MOD08 |
| Hybrid equation | Elagib and Mansell 2000 [29] |
MOD09 |
| Hybrid equation | Elagib and Mansell 2000 [29] |
MOD10 |
| Hybrid equation | Elagib and Mansell 2000 [29] |
MOD11 |
| Linear equation | Raja and Twidell 1990 [14] |
MOD12 |
| Power equation | Allen 1997 [30] |
MOD13 |
| Hybrid equation | Hargreaves 1985 [31] |
MOD14 |
| Hybrid equation | Bristow and Campbell 1984 [32] |
MOD15 |
| Logarithmic equation | Chen et al. 2004 [33] |
MOD16 |
| Linear equation | Chen et al. 2004 [33] |
MOD17 |
| Linear equation | Chen et al. 2004 [33] |
MOD18 |
| Linear equation | Chen et al. 2004 [33] |
MOD19 |
| Linear equation | Chen et al. 2004 [33] |
MOD20 |
| Linear equation | Ertekin and Yaldiz 1999 [34] |
MOD21 |
| Linear equation | Ododo et al.1995 [35] |
MOD22 |
| Linear equation | El-Metwally 2004 [36] |
MOD23 |
| Linear equation | Togrul and Onat 1999 [37] |
MOD24 |
| Linear equation | Togrul and Onat 1999 [37] |
MOD25 |
| Linear equation | Togrul and Onat 1999 [37] |
MOD26 |
| Linear equation | Togrul and Onat 1999 [37] |
MOD27 |
| Linear equation | Togrul and Onat 1999 [37] |
MOD28 |
| Linear equation | Togrul and Onat 1999 [37] |
MOD29 |
| Power equation | Swartzman and Ogunlade 1967 [38] |
MOD30 |
| Linear equation | Swartzman and Ogunlade 1967 [38] |
MOD31 |
| Hybrid equation | Garg and garg 1982 [39] |
MOD32 |
| Hybrid equation | Garg and garg 1982 [39] |
MOD33 |
| Power equation | De Jong and Stewart 1993 [40] |
MOD34 |
| Hybrid equation | Hunt et al. 1998 [41] |
MOD35 |
| Linear equation | Coulibaly and Ouedraogo 2016 [42] |
parameters | equations |
|---|---|
Root mean squared error (RMSE) |
|
Normalised Root mean squared error RMSE (%) |
|
Mean bias error (MBE) |
|
Normalised Mean absolute bias error MBE (%) |
|
Mean percentage error MPE (%) |
|
Determination coefficient () |
|
Models | MBE (%) | Ranking | RMSE (%) | Ranking | R2 | Ranking | MPE (%) | Ranking | Statute | Number of Variables |
|---|---|---|---|---|---|---|---|---|---|---|
MOD01 | 1.62E-02 | 18 | 5.39206 | 29 | 0.42207 | 29 | -0.30831 | 29 | + | 3 |
MOD02 | 1.62E-02 | 20 | 5.39206 | 31 | 0.42207 | 31 | -0.30831 | 31 | + | 4 |
MOD03 | 3.30E-02 | 25 | 3.79059 | 17 | 0.71438 | 17 | -0.14033 | 16 | + | 5 |
MOD04 | 2.28E-02 | 23 | 5.28211 | 25 | 0.44540 | 25 | -0.29549 | 26 | + | 3 |
MOD05 | 2.23E-02 | 22 | 5.39208 | 32 | 0.42206 | 32 | -0.31439 | 32 | + | 6 |
MOD06 | 5.47E-02 | 32 | 4.06724 | 19 | 0.67117 | 19 | -0.16673 | 18 | + | 4 |
MOD07 | 8.30E-03 | 15 | 5.39716 | 34 | 0.42098 | 34 | -0.30176 | 27 | + | 3 |
MOD08 | 1.62E-01 | 34 | 5.28700 | 26 | 0.44437 | 26 | -0.43614 | 35 | + | 3 |
MOD09 | 1.62E-02 | 19 | 5.39206 | 30 | 0.42207 | 30 | -0.30831 | 30 | + | 5 |
MOD10 | -3.88E-02 | 26 | 5.39204 | 28 | 0.42207 | 28 | -0.25306 | 24 | - | 4 |
MOD11 | 2.59E-02 | 24 | 5.39212 | 33 | 0.42206 | 33 | -0.31805 | 33 | + | 4 |
MOD12 | -2.69E-01 | 35 | 6.54365 | 35 | 0.14885 | 35 | 0.39683 | 34 | - | 3 |
MOD13 | 5.35E-02 | 30 | 4.47961 | 22 | 0.60111 | 22 | -0.21607 | 22 | + | 3 |
MOD14 | 6.03E-02 | 33 | 3.97852 | 18 | 0.68536 | 18 | -0.17544 | 19 | + | 3 |
MOD15 | 5.44E-02 | 31 | 4.42747 | 21 | 0.61035 | 21 | -0.21081 | 21 | + | 3 |
MOD16 | -1.75E-14 | 5 | 1.94234 | 12 | 0.92501 | 12 | -0.03617 | 10 | - | 4 |
MOD17 | -3.09E-14 | 11 | 1.45003 | 5 | 0.95821 | 5 | -0.02259 | 4 | - | 6 |
MOD18 | -2.42E-14 | 7 | 1.69333 | 9 | 0.94300 | 9 | -0.03134 | 9 | - | 6 |
MOD19 | -3.23E-14 | 13 | 1.45003 | 4 | 0.95821 | 4 | -0.02259 | 6 | - | 7 |
MOD20 | -2.82E-14 | 8 | 0.86221 | 1 | 0.98522 | 1 | -0.00845 | 1 | - | 8 |
MOD21 | 4.80E-02 | 29 | 2.46654 | 15 | 0.87907 | 15 | -0.06946 | 15 | + | 6 |
MOD22 | -3.90E-14 | 14 | 1.92510 | 10 | 0.92633 | 10 | -0.04064 | 13 | - | 5 |
MOD23 | -1.48E-14 | 4 | 1.97613 | 14 | 0.92238 | 14 | -0.03671 | 12 | - | 4 |
MOD24 | -1.88E-14 | 6 | 1.30978 | 3 | 0.96590 | 3 | -0.01845 | 3 | - | 6 |
MOD25 | -3.09E-14 | 12 | 1.93499 | 11 | 0.92557 | 11 | -0.03639 | 11 | - | 5 |
MOD26 | -1.34E-14 | 3 | 1.96217 | 13 | 0.92347 | 13 | -0.04378 | 14 | - | 5 |
MOD27 | 1.34E-15 | 1 | 1.61230 | 7 | 0.94833 | 7 | -0.02827 | 8 | + | 6 |
MOD28 | 1.34E-15 | 2 | 1.23958 | 2 | 0.96946 | 2 | -0.01581 | 2 | + | 7 |
MOD29 | 1.25E-02 | 17 | 5.08758 | 24 | 0.48550 | 24 | -0.28579 | 25 | + | 3 |
MOD30 | 3.91E-02 | 27 | 4.34836 | 20 | 0.62415 | 20 | -0.20995 | 20 | + | 4 |
MOD31 | 1.86E-02 | 21 | 5.36998 | 27 | 0.42679 | 27 | -0.30772 | 28 | + | 4 |
MOD32 | -1.14E-02 | 16 | 4.60543 | 23 | 0.57839 | 23 | -0.23276 | 23 | - | 4 |
MOD33 | 4.69E-02 | 28 | 3.54179 | 16 | 0.75065 | 16 | -0.14315 | 17 | + | 4 |
MOD34 | -2.82E-14 | 9 | 1.61718 | 8 | 0.94801 | 8 | -0.02477 | 7 | - | 5 |
MOD35 | -2.82E-14 | 10 | 1.45003 | 6 | 0.95821 | 6 | -0.02259 | 5 | - | 6 |
Models | MBE (%) | Ranking | RMSE (%) | Ranking | R2 | Ranking | MPE (%) | Ranking | Statute | Number of variables |
|---|---|---|---|---|---|---|---|---|---|---|
MOD01 | 6.80E-02 | 25 | 4.10866 | 27 | -0.05574 | 25 | -0.17394 | 28 | + | 3 |
MOD02 | 6.80E-02 | 24 | 4.10866 | 26 | -0.05574 | 27 | -0.17394 | 27 | + | 4 |
MOD03 | 7.70E-02 | 31 | 3.63587 | 18 | 0.17326 | 18 | -0.13255 | 19 | + | 5 |
MOD04 | 7.08E-02 | 28 | 4.12084 | 32 | -0.06200 | 22 | -0.17526 | 31 | + | 3 |
MOD05 | -5.32E-01 | 33 | 4.13393 | 33 | -0.06876 | 21 | 0.42599 | 33 | - | 6 |
MOD06 | 8.02E-02 | 32 | 3.63834 | 19 | 0.17213 | 19 | -0.13331 | 20 | + | 4 |
MOD07 | 7.46E-02 | 29 | 4.10903 | 29 | 0.01440 | 33 | -0.18054 | 32 | + | 3 |
MOD08 | 5.71E-01 | 34 | 4.16641 | 34 | 0.00520 | 34 | -0.67415 | 34 | + | 3 |
MOD09 | 6.80E-02 | 26 | 4.10866 | 28 | -0.05574 | 26 | -0.17394 | 29 | + | 5 |
MOD10 | 6.26E-02 | 21 | 4.10849 | 25 | -0.05565 | 28 | -0.16855 | 24 | + | 4 |
MOD11 | 6.10E-02 | 19 | 4.10844 | 24 | -0.05563 | 29 | -0.16696 | 23 | + | 4 |
MOD12 | -1.41E+00 | 35 | 13.63798 | 35 | NaN | / | 1.45545 | 35 | - | 3 |
MOD13 | 6.72E-02 | 23 | 4.10462 | 23 | -0.05366 | 30 | -0.17324 | 25 | + | 3 |
MOD14 | 4.12E-02 | 18 | 3.90222 | 22 | 0.04769 | 32 | -0.11025 | 16 | + | 3 |
MOD15 | 6.87E-02 | 27 | 4.11402 | 31 | -0.05850 | 23 | -0.17425 | 30 | + | 3 |
MOD16 | -1.84E-14 | 8 | 1.53924 | 9 | 0.85183 | 9 | -0.02377 | 9 | - | 4 |
MOD17 | -2.50E-14 | 12 | 0.99261 | 4 | 0.93838 | 4 | -0.00954 | 5 | - | 6 |
MOD18 | -1.32E-14 | 6 | 2.39040 | 13 | 0.64265 | 12 | -0.05881 | 13 | - | 6 |
MOD19 | -6.58E-15 | 2 | 0.97779 | 3 | 0.94021 | 3 | -0.00933 | 3 | - | 7 |
MOD20 | -2.10E-14 | 10 | 1.51477 | 8 | 0.85650 | 8 | -0.02351 | 8 | - | 8 |
MOD21 | 7.63E-02 | 30 | 3.45200 | 16 | 0.25476 | 16 | -0.12084 | 17 | + | 6 |
MOD22 | -6.58E-15 | 3 | 2.27739 | 12 | 0.67564 | 12 | -0.05371 | 12 | - | 5 |
MOD23 | 1.32E-15 | 1 | 1.23965 | 7 | 0.90389 | 7 | -0.01547 | 7 | + | 4 |
MOD24 | 1.18E-14 | 5 | 0.80925 | 2 | 0.95904 | 2 | -0.00637 | 2 | + | 6 |
MOD25 | -1.97E-14 | 9 | 1.07212 | 6 | 0.92811 | 6 | -0.01127 | 6 | - | 5 |
MOD26 | -2.24E-14 | 11 | 2.41242 | 14 | 0.63603 | 14 | -0.06002 | 14 | - | 5 |
MOD27 | 2.76E-14 | 13 | 2.08012 | 11 | 0.72940 | 11 | -0.04461 | 11 | + | 6 |
MOD28 | -9.21E-15 | 4 | 0.80631 | 1 | 0.95934 | 1 | -0.00631 | 1 | - | 7 |
MOD29 | -3.99E-03 | 15 | 3.69038 | 20 | 0.14828 | 20 | -0.13383 | 21 | - | 3 |
MOD30 | 6.69E-02 | 22 | 4.10971 | 30 | -0.05628 | 24 | -0.17380 | 26 | + | 4 |
MOD31 | 6.15E-02 | 20 | 3.89063 | 21 | 0.05334 | 31 | -0.15382 | 22 | + | 4 |
MOD32 | 2.65E-02 | 16 | 3.46197 | 17 | 0.25045 | 17 | -0.12182 | 12 | + | 4 |
MOD33 | 3.79E-02 | 17 | 2.58807 | 15 | 0.58110 | 15 | -0.06547 | 15 | + | 4 |
MOD34 | -1.32E-14 | 7 | 1.98244 | 10 | 0.75421 | 10 | -0.03996 | 10 | - | 5 |
MOD35 | -3.29E-14 | 14 | 0.99261 | 5 | 0.93838 | 5 | -0.00954 | 4 | - | 6 |
City | Ranking | MBE criterion Best model | Authors | RMSE and R2 criterion Best model | Authors |
|---|---|---|---|---|---|
Maroua | 1 | MOD27 | Togrul and Onat 1999 [28] | MOD20 | Ertekin and Yaldiz 1999 [43] |
2 | MOD28 | Togrul and Onat 1999 [28] | MOD28 | Togrul and Onat 1999 [28] | |
Garoua | 1 | MOD23 | Togrul and Onat 1999 [28] | MOD28 | Togrul and Onat 1999 [28] |
2 | MOD19 | Chen et al. 2004 [42] | MOD24 | Togrul and Onat 1999 [28] |
Regression coefficients | ||||||||
|---|---|---|---|---|---|---|---|---|
Models | m | n | o | p | q | r | s | t |
MOD01 | 0,50195 | 0,08354 | - | - | - | - | - | - |
MOD02 | -0,99476 | 0,08354 | - | - | - | - | - | - |
MOD03 | -2,45841 | 12,86417 | -17,94068 | 8,21964 | - | - | - | - |
MOD04 | 0,58445 | 0,14654 | - | - | - | - | - | - |
MOD05 | 0,63980 | -0,07334 | -0,01317 | 0,85120 | - | - | - | - |
MOD06 | 2,40452 | -1,92038 | 3,07752 | - | - | - | - | - |
MOD07 | -0,49590 | 0,07812 | - | - | - | - | - | - |
MOD08 | -4,24200 | 4,82700 | 0,01311 | - | - | - | - | - |
MOD09 | 0,50195 | 0,00000 | 0,00000 | 0,08354 | - | - | - | - |
MOD10 | -3,61500 | 9,73200 | 0,08354 | - | - | - | - | - |
MOD11 | 0,81550 | 0,62130 | 0,08354 | - | - | - | - | - |
MOD12 | 0,16281 | - | - | - | - | - | - | - |
MOD13 | 0,32766 | 0,06764 | - | - | - | - | - | - |
MOD14 | 0,57190 | 0,00313 | 3,07600 | - | - | - | - | - |
MOD15 | 0,28045 | 0,26159 | - | - | - | - | - | - |
MOD16 | 0,92146 | 1,30876 | -0,07061 | 0,10798 | - | - | - | - |
MOD17 | -0,46146 | 0,23174 | 0,77475 | -0,09324 | 0,09453 | -0,00161 | - | - |
MOD18 | -0,03309 | 0,26264 | 0,64479 | -0,00746 | -0,06859 | 0,14336 | - | - |
MOD19 | -0,46494 | 0,23126 | 0,77677 | -0,09332 | -0,00156 | 0,00056 | 0,09417 | - |
MOD20 | -2,83785 | 0,51644 | 0,02808 | 0,00732 | 2,42812 | -0,05528 | 0,10088 | -0,00256 |
MOD21 | -0,28335 | 0,82476 | 0,02429 | -0,00007 | -0,02346 | - | - | - |
MOD22 | -0,36681 | 0,20886 | 0,16381 | -0,07969 | - | - | - | - |
MOD23 | 0,67449 | 2,02037 | -0,08645 | 0,12187 | - | - | - | - |
MOD24 | -0,85031 | 0,25937 | 1,31109 | -0,10799 | 0,10580 | -0,00193 | - | - |
MOD25 | 1,27373 | 1,62879 | -0,08461 | 0,11458 | -0,00264 | - | - | - |
MOD26 | -1,21914 | 0,06755 | 1,39162 | 0,15549 | 0,01040 | - | - | - |
MOD27 | -0,23736 | 0,38164 | 1,42327 | -0,01496 | -0,14584 | 0,21356 | - | - |
MOD28 | -0,39010 | 0,38106 | 1,28143 | -0,10351 | 0,18635 | -0,11602 | -0,01198 | - |
MOD29 | 8,33400 | -0,02159 | -0,11270 | - | - | - | - | - |
MOD30 | 0,73035 | -0,13818 | -0,00162 | - | - | - | - | - |
MOD31 | 0,52984 | 0,05641 | -0,00312 | - | - | - | - | - |
MOD32 | 0,64045 | 0,00175 | -0,02710 | - | - | - | - | - |
MOD33 | 1,21900 | -0,29230 | -0,00060 | 0,00000 | - | - | - | - |
MOD34 | 0,29359 | 0,07710 | 0,07405 | 0,00311 | -0,00001 | - | - | - |
MOD35 | -0,46146 | 0,23174 | 0,77475 | -0,00161 | 0,09453 | -0,09324 | - | - |
Regression coefficients | ||||||||
|---|---|---|---|---|---|---|---|---|
Models | m | n | o | p | q | r | s | t |
MOD01 | 0,58530 | -0,02287 | - | - | - | - | - | - |
MOD02 | -0,58776 | -0,02287 | - | - | - | - | - | - |
MOD03 | -0,38856 | 4,00975 | -5,34915 | 2,28116 | - | - | - | - |
MOD04 | 0,56572 | -0,02265 | - | - | - | - | - | - |
MOD05 | -14,50000 | 2,61600 | 1,61600 | -24,44000 | - | - | - | - |
MOD06 | 1,58615 | -1,08172 | 1,59972 | - | - | - | - | - |
MOD07 | -0,41470 | -0,02300 | - | - | - | - | - | - |
MOD08 | -13,08000 | 13,65000 | -0,00045 | - | - | - | - | - |
MOD09 | 0,58530 | 0,00000 | 0,00000 | -0,02287 | - | - | - | - |
MOD10 | 0,39370 | 0,79490 | -0,02287 | - | - | - | - | - |
MOD11 | 0,59190 | 0,00667 | -0,02287 | - | - | - | - | - |
MOD12 | 0,16277 | - | - | - | - | - | - | - |
MOD13 | 0,59559 | -0,00755 | - | - | - | - | - | - |
MOD14 | 0,57230 | 0,00000 | 8,15800 | - | - | - | - | - |
MOD15 | 0,59543 | -0,02423 | - | - | - | - | - | - |
MOD16 | 3,97413 | -0,41133 | -0,19924 | 0,05552 | - | - | - | - |
MOD17 | 1,92743 | 0,14616 | -0,10226 | -0,21833 | 0,05933 | 0,00451 | - | - |
MOD18 | 1,98090 | 0,05794 | 0,05706 | 0,00547 | 0,04372 | 0,04263 | - | - |
MOD19 | 1,72338 | 0,12160 | -0,10084 | -0,21818 | 0,00629 | 0,03927 | 0,03737 | - |
MOD20 | -0,74307 | 0,78370 | 0,04067 | 0,00256 | 1,63266 | -0,08328 | 0,00530 | -0,00474 |
MOD21 | -0,21992 | 0,95016 | 0,02375 | 0,00030 | -0,02934 | - | - | - |
MOD22 | 2,65880 | 0,08881 | 0,04149 | 0,02815 | - | - | - | - |
MOD23 | 3,75063 | 0,11129 | -0,18481 | 0,06256 | - | - | - | - |
MOD24 | 2,12299 | 0,13217 | 0,32632 | -0,20191 | 0,06221 | 0,00323 | - | - |
MOD25 | 3,21838 | 0,44816 | -0,18992 | 0,06750 | 0,00280 | - | - | - |
MOD26 | 1,63268 | 0,01509 | 0,06074 | 0,11705 | 0,00867 | - | - | - |
MOD27 | 3,11028 | 0,12989 | 0,93031 | -0,00377 | -0,10492 | 0,13117 | - | - |
MOD28 | 2,22119 | 0,13934 | 0,37764 | -0,20013 | 0,06971 | -0,01330 | 0,00245 | - |
MOD29 | 6,09100 | 0,05135 | -0,01490 | - | - | - | - | - |
MOD30 | 0,57573 | -0,01439 | 0,00007 | - | - | - | - | - |
MOD31 | 0,50463 | 0,04478 | 0,00938 | - | - | - | - | - |
MOD32 | 0,58757 | 0,00110 | -0,00495 | - | - | - | - | - |
MOD33 | 0,46820 | 0,06392 | 0,00190 | -0,00001 | - | - | - | - |
MOD34 | 2,06496 | 0,04671 | 0,04757 | 0,00895 | -0,00003 | - | - | - |
MOD35 | 1,92743 | 0,14616 | -0,10226 | 0,00451 | 0,05933 | -0,21833 | - | - |
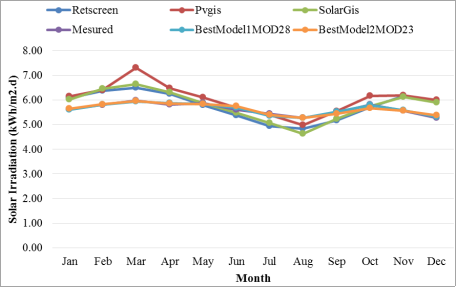
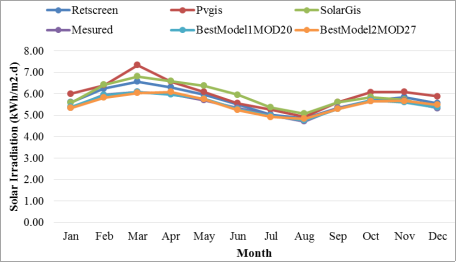
Maroua city | Garoua city | |||||
|---|---|---|---|---|---|---|
Month | Retscreen | pvgis | Solargis | Retscreen | pvgis | Solargis |
January | over-estimation | over-estimation | over-estimation | over-estimation | over-estimation | over-estimation |
February | over-estimation | over-estimation | over-estimation | over-estimation | over-estimation | over-estimation |
March | over-estimation | over-estimation | over-estimation | over-estimation | over-estimation | over-estimation |
April | over-estimation | over-estimation | over-estimation | over-estimation | over-estimation | over-estimation |
May | over-estimation | over-estimation | over-estimation | under-estimation | over-estimation | over-estimation |
June | over-estimation | over-estimation | over-estimation | under-estimation | over-estimation | under-estimation |
July | over-estimation | over-estimation | over-estimation | under-estimation | under-estimation | under-estimation |
August | over-estimation | over-estimation | over-estimation | under-estimation | under-estimation | under-estimation |
September | over-estimation | over-estimation | over-estimation | under-estimation | under-estimation | under-estimation |
October | over-estimation | over-estimation | over-estimation | under-estimation | over-estimation | under-estimation |
November | over-estimation | over-estimation | over-estimation | over-estimation | over-estimation | over-estimation |
December | over-estimation | under-estimation | over-estimation | over-estimation | over-estimation | over-estimation |
| Semi-Arid Climate Zone |
| Solar Constant (W/m2) |
| Extraterrestrial Solar Radiation (kWh/m2) |
| Measured Solar Radiation (kWh/m2) |
| Mean Bias Error (kWh/m2) |
| Mean Percentage Error (kWh/m2) |
| Precipitation in (mm) |
PV | Photovoltaic |
| Relative Humidity in Percentage |
| Root Mean Square Error (kWh/m2) |
| Determination Coefficient |
| Effective Sunshine Duration (h) |
| Day Length (h) |
| Mean Soil Temperature (°C) |
| Monthly Mean Temperature (°C) |
| Monthly Daily Mean Air Temperature (K.) |
| Mean Maximum Temperature (°C) |
| Mean Minimum Temperature (°C) |
| Precipitable Water Vapor from the Atmosphere (cm). |
| Mean Annual Solar Radiation (kWh/m2) |
| Calculated Solar Radiation (kWh/m2) |
| Measured Solar Radiation (kWh/m2) |
| Altitude (Km) |
| [1] | Ayodele, T. R., Ogunjuyigbe, A. S. O. Performance assessment of empirical models for prediction of daily and monthly average global solar radiation: the case study of Ibadan, Nigeria. International Journal of Ambient Energy. 2016; |
| [2] | Badescu, V. Modeling Solar Radiation at the Earth’s Surface, Springer-Verlag Berlin Heidelberg. 2008 ISBN: 978-3-540-77454-9. |
| [3] | Katiyar, A. K., Pandey, C. K. Simple correlation for estimating the global solar radiation on horizontal surfaces in India. Energy. 35 (2010), pp. 5043–5048. |
| [4] | Liu, D. L., Scott, B. J. Estimation of solar radiation in Australia from rainfall and temperature observations, Agriculture and Forest Meteorology.; 106(2001) 41–59. |
| [5] | Trnka M., Zalud, Z., Eitzinger, J., Dubrovsky, M. Global solar radiation in Central European lowlands estimated by various empirical formulae, Agriculture and Forest Meteorology. 131(2005), pp. 54–76. |
| [6] | Menges, H. O., Ertekin, C., Sonmete, M. H. Evaluation of global solar radiation models for Konya Turkey, Energy Conversion and Management. 47 (2006), pp. 3149–3173. |
| [7] | Ertekin, C., Evrendilek, F. Spatio-temporal modeling of global solar radiation dynamics as a function of sunshine duration for Turkey, Agriculture and Forest Meteorology. 145 (2007), 36–47. |
| [8] | Evrendilek, F., Ertekin, C. Assessing solar radiation models using multiple variables over Turkey, Climate Dynamics, 31(2008) 131–149. |
| [9] | Sonmete, M. H., Ertekin, C., Menges, H. O., Hacıseferogullari, H., Evrendilek, F. Assessing monthly average solar radiation models: a comparative case study in Turkey, Environ Monit Assess; 175(2011) 251–277. |
| [10] | Angstrom, A. Solar and terrestrial radiation, Quarterly Journal of Royal Meteorological Society, 50(1924) 121–125. |
| [11] | Prescott, J. A. Evaporation from water surface in relation to solar radiation, Transactions of the Royal Society of Australia. 46 (1940) 114–118. |
| [12] | Glower, J., McGulloch, J. S. G. The empirical relation between solar radiation and hours of sunshine, Quart J R Met Soc. 84(1958) 172-175. |
| [13] | Dogniaux, R., Lemoine, M. Classification of radiation sites in terms of different indices of atmospheric transparency, Solar energy research and development in the European Community Series F. 2(1983). Dordrecht: Reidel. |
| [14] | Raja, I. A., Twidell, J. W. Distribution of global insolation over Pakistan. Solar Energy. 44(1990) 63–71. |
| [15] | Samuel, T. D. M. A. Estimation of global radiation for Srilanka, Solar Energy. 47(5) (1991) 333-337. |
| [16] | Ampratwum, D. B., Dorvio, A. S. S. Estimation of solar radiation from the number of sunshine hours, Applied Energy. 63(1999) 161–167. |
| [17] | Ayangma, F., Nkeng, G. E., Bonoma, D. B., Nganhou, J. Evaluation du potentiel solaire au Cameroun: cas du Nord Cameroun, African Journal of Science and Technology. 9 (2) (2008) 32-40. |
| [18] | Okundamiya, M. S., Emagbetere, J. O., Ogujor, E. A. Evaluation of various global solar radiation models for Nigeria, International Journal of Green Energy; 13(5) (2016) 505-512. |
| [19] | Ertekin, C., Yaldiz, O. Comparison of some existing models for estimating global solar radiation for Antalya (Turkey), Energy Conversion & Management. 41(2000) 311-330. |
| [20] | Mboumboue, E., Njomo, D., Ndiaye, M. L., N'diaye, P. A., Ndiaye, M. F. Tossa, A. K On the applicability of several conventional regression models for the estimation of solar global radiation component in Cameroon and Senegal sub-Saharan tropical regions, Journal of Renewable and Sustainable Energy. 8(2016), 025906; |
| [21] | Afungchui, D. J., Ebobenow, N. R., Ngwa, N. A. Global Solar Radiation of some Regions of Cameroon using the Linear Angstrom Model and Non-linear Polynomial Relations: Part 2, Sun-path Diagrams, Energy Potential Predictions and Statistical Validation. International Journal of Renewable Energy Research. 8(1) (2018). |
| [22] | Wild, M. Global dimming and brightening: A review, Journal of Geophysical Research., 114(2009) D00D16. |
| [23] | Cebecauer, T., Suri, M. Typical Meteorological Year data: SolarGIS approach, Energy Procedia. 69 (2015) 1958 – 1969. |
| [24] | Ineichen, P., Barroso, C. S., Geiger, B., Hollmann, R. A. Marsouin, R. Müller, Satellite Application Facilities irradiance products: hourly time step comparison and validation over Europe, International Journal of Remote Sensing.; 30 (2009) 5549-5571. |
| [25] | Müller, R., Matsoukas, C., Gratzki, A., Behr, H. D., Hollmann, R. The CM-SAF operational scheme for the satellite based retrieval of solar surface irradiance - A LUT based eigenvector hybrid approach. Remote Sensing of Environment.; 113 (2009) 1012-1024. |
| [26] | Leckner, B. The spectral distribution of solar radiation at the earth’s surface-elements of a model. Solar Energy. 20 (1978) 143–150. |
| [27] | Page, J. K. The estimation of monthly mean values of daily total short wave radiation on vertical and inclined surfaces from sunshine records for latitudes 40°N–40°S. In Proceedings of UN conference on new sources of energy. (1961) 378–390. |
| [28] | Newland, F. J. A study of solar radiation models for the coastal region of South China, Solar Energy. 31(1988) 227–235. |
| [29] | Elagib, N., Mansell, M. G. New approaches for estimating global solar radiation across Sudan, Energy Conversion and Management.; 41(2000) 419–434. |
| [30] | Allen, R. Self calibrating method for estimating solar radiation from air temperature. Journal of Hydrologic Engineering. 2(1997) 56–67. |
| [31] | Hargreaves, G. L., Hargreaves, G. H. Riley, P. Irrigation water requirement for the Senegal River Basin. Journal of Irrigation and Drainage Engineering ASCE. 111(1985) 265–275. |
| [32] | Bristow, K. L., Campbell, G. S. On the relationship between incoming solar Radiation and daily maximum and minimum temperature. Agricultural and Forest Meteorology. 31 (1984) 159-166. |
| [33] | Chen, R., Ersi, K., Yang, J., Lu, S., Zhao, W. Validation of five global radiation models with measured daily data in China, Energy Conversion and Management. 45(2004) 1759–1769. |
| [34] | Ertekin, C., Yaldiz, O. Estimation of monthly average daily global radiation on horizontal surface for Antalya, Turkey, Renewable Energy. 17(1) (1999) 95-102. |
| [35] | Ododo, J. C., Sulaiman, A. T., Aidan, J., Yuguda, M. M., Ogbu, F. A. The importance of maximum air temperature in the parameterisation of solar radiation in Nigeria, Renewable Energy. 6 (1995) 751–763. |
| [36] | El-Metwally. M. Simple new methods to estimate global solar radiation based on meteorological data in Egypt, Atmospheric Research. 69(2004) 217–239. (Article) |
| [37] | Togrul, I. T., Onat, E. A study for estimating solar radiation in Elazig using geographical and meteorological data, Energy Conversion and Management; 40(1999) 1577–1584. |
| [38] | Swartman, R. K., Ogunlade, O. Solar radiation estimates from common parameters. Solar Energy; 11(1967) 170–172. |
| [39] | Garg, H. P., Garg, S. T. Prediction of global solar radiation from bright sunshine hours and other meteorological Data, Energy conversion management.; 23(2) (1982) 113-118. |
| [40] | DeJong, R., Stewart, D. W. Estimating global solar radiation from common meteorological observations in western Canada, Canadian Journal of Plant Science. 73(1993) 509-518. |
| [41] | Hunt, L. A., Kuchar, L., Swanton, C. J. Estimation of solar radiation for use in crop modelling, Agricultural And Forest Meteorology. 91(1998) 293-300. |
| [42] | Coulibaly, O., Ouedraogo. A. Correlation of Global Solar Radiation of Eight Synoptic Stations in Burkina Faso Based on Linear and Multiple Linear Regression Methods Hindawi Publishing Corporation Journal of Solar Energy. (2016). ID 7870907, 9 pages |
| [43] | Ahmad, M. J., Tiwari, G. N. Evaluation and comparison of hourly solar radiation models, Int. J. Energy Res.; 33(2009) 538–552. |
| [44] | Akinoglu, B. G. Recent Advances in the Relations between Bright Sunshine Hours and Solar. In: Badescu V, editor. Modeling solar radiation at the earth surface. Berlin: Springer. (2008) chapter 5: 115–143. |
APA Style
Deli, K., Houdji, E. T., Ayang, A., Kaoga, D. K., Djongyang, N. (2024). Performance Comparison of Empirical Models for Estimating Global Solar Irradiation in the Soudano-Sahelian Zone of Cameroon: The Case of the City of Maroua and Garoua. International Journal of Sustainable and Green Energy, 13(2), 28-42. https://doi.org/10.11648/j.ijrse.20241302.12
ACS Style
Deli, K.; Houdji, E. T.; Ayang, A.; Kaoga, D. K.; Djongyang, N. Performance Comparison of Empirical Models for Estimating Global Solar Irradiation in the Soudano-Sahelian Zone of Cameroon: The Case of the City of Maroua and Garoua. Int. J. Sustain. Green Energy 2024, 13(2), 28-42. doi: 10.11648/j.ijrse.20241302.12
AMA Style
Deli K, Houdji ET, Ayang A, Kaoga DK, Djongyang N. Performance Comparison of Empirical Models for Estimating Global Solar Irradiation in the Soudano-Sahelian Zone of Cameroon: The Case of the City of Maroua and Garoua. Int J Sustain Green Energy. 2024;13(2):28-42. doi: 10.11648/j.ijrse.20241302.12
@article{10.11648/j.ijrse.20241302.12,
  author = {Kodji Deli and Etienne Tchoffo Houdji and Albert Ayang and Dieudonne Kidmo Kaoga and Noel Djongyang},
  title = {Performance Comparison of Empirical Models for Estimating Global Solar Irradiation in the Soudano-Sahelian Zone of Cameroon: The Case of the City of Maroua and Garoua
},
  journal = {International Journal of Sustainable and Green Energy},
  volume = {13},
  number = {2},
  pages = {28-42},
  doi = {10.11648/j.ijrse.20241302.12},
  url = {https://doi.org/10.11648/j.ijrse.20241302.12},
  eprint = {https://article.sciencepublishinggroup.com/pdf/10.11648.j.ijrse.20241302.12},
  abstract = {The main objective of this study is to compare thirty-five (35) solar radiation models available in the open literature in order to predict monthly solar radiation in two main cities of Cameroon. This estimation and comparison are based on selected statistical comparison parameters named, root mean square error (RMSE), mean bias error (MBE), mean percentage error (MPE) and determination coefficient (R2). These different models are implemented using regression analysis tools named Exel and MATLAB. Estimated values were compared with measured values according to normalized values of statistical parameters, using measured meteorological data of more than 19 years, from 1984 to 2015. All the models have been classified with their associated ranking according to their statistical parameter accuracy. From this study it appears that the models of Ertekin and Yaldiz  (MOD20), Togrul and Onat (MOD28), are more accurate than other models. Indeed, for the city of Maroua (MBE%=-2.82E-14; RMSE%=0.862; MPE=-0.00845; R2=0.985), while for Garoua (MBE%=-9.21E-15; RMSE%=0.806; MPE=-0.00631; R2=0.959). according to their accuracy these models can be therefore be used to predict monthly solar radiation for soudano-sahelian regions of Cameroon. Correlation equations found in this paper will help solar energy researcher to estimate data with trust because of its fine agreement with the observed one. hence the models presented in this study could be used to evaluate accurately the solar radiation at any locations with similar climate.
},
 year = {2024}
}
TY  - JOUR
T1  - Performance Comparison of Empirical Models for Estimating Global Solar Irradiation in the Soudano-Sahelian Zone of Cameroon: The Case of the City of Maroua and Garoua

AU  - Kodji Deli
AU  - Etienne Tchoffo Houdji
AU  - Albert Ayang
AU  - Dieudonne Kidmo Kaoga
AU  - Noel Djongyang
Y1  - 2024/07/15
PY  - 2024
N1  - https://doi.org/10.11648/j.ijrse.20241302.12
DO  - 10.11648/j.ijrse.20241302.12
T2  - International Journal of Sustainable and Green Energy
JF  - International Journal of Sustainable and Green Energy
JO  - International Journal of Sustainable and Green Energy
SP  - 28
EP  - 42
PB  - Science Publishing Group
SN  - 2575-1549
UR  - https://doi.org/10.11648/j.ijrse.20241302.12
AB  - The main objective of this study is to compare thirty-five (35) solar radiation models available in the open literature in order to predict monthly solar radiation in two main cities of Cameroon. This estimation and comparison are based on selected statistical comparison parameters named, root mean square error (RMSE), mean bias error (MBE), mean percentage error (MPE) and determination coefficient (R2). These different models are implemented using regression analysis tools named Exel and MATLAB. Estimated values were compared with measured values according to normalized values of statistical parameters, using measured meteorological data of more than 19 years, from 1984 to 2015. All the models have been classified with their associated ranking according to their statistical parameter accuracy. From this study it appears that the models of Ertekin and Yaldiz  (MOD20), Togrul and Onat (MOD28), are more accurate than other models. Indeed, for the city of Maroua (MBE%=-2.82E-14; RMSE%=0.862; MPE=-0.00845; R2=0.985), while for Garoua (MBE%=-9.21E-15; RMSE%=0.806; MPE=-0.00631; R2=0.959). according to their accuracy these models can be therefore be used to predict monthly solar radiation for soudano-sahelian regions of Cameroon. Correlation equations found in this paper will help solar energy researcher to estimate data with trust because of its fine agreement with the observed one. hence the models presented in this study could be used to evaluate accurately the solar radiation at any locations with similar climate.

VL  - 13
IS  - 2
ER  -
Department of Renewable Energy, National Advanced School of Engineering, University of Maroua, Maroua, Cameroon
Department of Renewable Energy, National Advanced School of Engineering, University of Maroua, Maroua, Cameroon; Department of Renewable Energy, Advanced School of Mines Processing and Energy Resources, University of Bertoua, Cameroun
Department of Renewable Energy, National Advanced School of Engineering, University of Maroua, Maroua, Cameroon; Department of Applied Sciences, University of Québec in Chicoutimi, 555 Boulevard de l’Université, Chicoutimi, Canada
Department of Renewable Energy, National Advanced School of Engineering, University of Maroua, Maroua, Cameroon
Department of Renewable Energy, National Advanced School of Engineering, University of Maroua, Maroua, Cameroon
Information