Research Article | | Peer-Reviewed

Racial and Socioeconomic Differences Correlate with Healthcare Disparities in Patients with Diabetic Retinopathy

Received: 30 May 2024    Accepted: 20 June 2024    Published: 2 July 2024
Views:       Downloads:
Abstract

Diabetic retinopathy (DR), an ocular complication of diabetes mellitus, is the leading cause of permanent blindness in the United States for young adults. Due to biological and environmental factors, diabetes mellitus is well known to disproportionally affect people of color and those of lower socioeconomic status; however, the racial and socioeconomic disparities of DR are less researched. The purpose of this research is to elucidate any differences in DR presentation that arise across racial and socioeconomic lines and to determine if diabetic control can be a predicting factor for DR severity. For this study, a retrospective patient chart analysis was performed on 511 consecutive newly referred patients with diabetes at New England Retina Associates, a vitreo-retinal ophthalmology practice with four locations throughout Connecticut. Our analysis shows that, when compared to their White and Asian counterparts, Black/African American and Hispanic patients present with DR at younger ages, had the higher HbA1c, were uninsured at higher rates, and presented with severe forms of DR in higher rates when compared to their counterparts. Many of these patterns are mirrored in patients that are uninsured or on Medicaid, indicators of lower socioeconomic status. Additionally, regardless of race or socioeconomic status, patients with higher HbA1c tended to present with more severe forms of DR. These findings indicate that DR disproportionately affects racial minority populations and those in socioeconomically disadvantageous positions, but effective glycemic control and routine eye exam screening can improve the outcomes of these patients. It is important for medical providers to recognize the disparities in these vulnerable populations in order to facilitate the timely referrals and the proper care for their long-term ocular health.

Published in International Journal of Ophthalmology & Visual Science (Volume 9, Issue 3)
DOI 10.11648/j.ijovs.20240903.11
Page(s) 30-39
Creative Commons

This is an Open Access article, distributed under the terms of the Creative Commons Attribution 4.0 International License (http://creativecommons.org/licenses/by/4.0/), which permits unrestricted use, distribution and reproduction in any medium or format, provided the original work is properly cited.

Copyright

Copyright © The Author(s), 2024. Published by Science Publishing Group

Keywords

Diabetic Retinopathy, Socioeconomic Differences, Healthcare Disparities, Social Determinants Of Health, Diabetes Mellitus

1. Introduction
Diabetes mellitus, colloquially just diabetes, is a collection of conditions which result in the body being unable to properly process sugar, leading to elevated glucose levels in the bloodstream. Diabetes patients are classified as having one of two types: type I diabetes or type II diabetes. Type I diabetes is characterized by a deficiency of insulin caused by the destruction of insulin secretary pancreatic beta-cells, usually caused by an autoimmune process. Type I diabetes typically manifests during adolescence and can even affect children. Type II diabetes is characterized by insulin resistance and a defect of the aforementioned beta-cells. As of 2019, an estimated 37.3 million Americans, 11.3% of the population, had diabetes, with almost 1.9 million having the type 1 variant.
In the United States, diabetes (both diagnosed and undiagnosed), is most prevalent in Black people (17.4%), followed by Asian people (16.7), Hispanic people (15.5%), and lastly White people (13.6%). This pattern is the result of the complex interactions between a number of both biological and environmental factors, such as differences in level of education, socioeconomic status, diet, and other behavioral factors. Additionally, from 2001 to 2020, the prevalence of diabetes mellitus in US adults increased from 10.3% to 13.2%, indicating the disease and its associated diabetes complications increasing burden on society.
Diabetic retinopathy (DR) is a serious complication of diabetes, as well as a leading cause of blindness in working-age populations worldwide. Approximately 4.1 million American adults are estimated to have diabetic retinopathy, representing 1.2% of the country’s population. A microvascular disease, DR is primarily caused by hyperglycemia’s effect on retinal blood vessels. Pericytes, structural cells that provide support to the capillaries in the retina, will undergo apoptosis due to diabetic damage. This loss of pericytes leads to vascular damage and the development of microaneurysm in capillary walls. Furthermore, loss of endothelial cells and thickening of the basement membrane in blood vessels are observed. These events result in retinal ischemia, hypoxia, and increased production of vascular endothelial growth factor (VEGF). Importantly, this excess of VEGF will lead to formation of new pathologic blood vessels and vascular leakage in the damaged blood vessels. In addition to neovascularization, inflammation & damage to retinal neuron play significant roles in the pathogenesis of and clinical manifestation of DR.
DR can be categorized into two major forms: nonproliferative and proliferative. Non-proliferative Diabetic Retinopathy (NPDR) can be identified by nerve-fiber layer infarcts, hemorrhages within the retina, hard exudates (leaking of fluid), and microvascular abnormalities. Macular edema is the predominant cause of visual loss in NPDR. NPDR is then further classified into mild, moderate, severe, and very severe. Proliferative Diabetic Retinopathy (PDR) is recognized by the development of new blood vessels (neovascularization) within the retina. Consequences of neovascularization include hemorrhage and fibrosis, ultimately leading to tractional retinal detachment, which are additional characteristics of PDR. The severity of PDR can be represented as early, high risk, and severe.
Generally, patients with DR experience no symptoms until more advanced stages. When symptoms do occur, they include blurred vision, floaters, fluctuating vision, dark or empty areas of vision, and ultimately vision loss. The rapid rate of progression necessitates regular screening of diabetic patients.
The objective of this study is to analyze the effects of ethnicity and socioeconomic status on severity of DR upon initial presentation and referral for treatment by retina specialist. The secondary goal of our study is to determine whether additional factors such as poor diabetic control, presence of additional systemic diseases, and quantity of medications play a role in the patterns observed.
2. Methods
The study group consisted of 511 patients consecutively referred to New England Retina Associates (NERA), each with diabetes mellitus. NERA’s patient intake form was used to determine patient ethnicity, with five options being offered for self-identification: White, Black American, Hispanic, Asian, or Other. If a patient did not list an ethnicity, this was also recorded. A similar process was used to record patient insurance information, with participants being divided into 4 groups: Medicare, Medicaid, Commercial, or None.
For this study, our primary research outcome was the severity of diabetic retinopathy in each eye upon initial presentation, as diagnosed by an ophthalmologist as either None, Mild, Moderate, Severe Nonproliferative or Proliferative. In our analysis, we define both Severe NPDR and PDR to be extreme forms of DR. Our secondary research outcomes were comprised of visual acuity (VA), home zip code, HbA1c level upon presentation, total number of chronic medications and number of diabetic medications. If a patient did not know or could not remember any of the above, this was also recorded. Median household income data was obtained from Connecticut Demographics by Cubit.
3. Results
3.1. Study Demographics
511 newly referred patients were identified as having diabetes mellitus. No patients were excluded. Table 1 presents the study population broken down by ethnicity and also presents the average age, gender breakdown, and the insurance distribution for each ethnicity.
Table 1 shows the demographic characteristics of the 511 patients included in the study, sorted by ethnic group. Insurance plan was recorded in 100% of patients.
Table 1. Baseline characteristic of the study population.

Whole Population

White

Black/African American

Asian

Hispanic

Other

Did Not List

n=511 (100)

n=224 (43.8)

n=81 (15.9)

n=22 (4.3)

n=93 (18.2)

n=12 (2.3)

n=79 (15.5)

Avg. Age

63.5

66.0

59.3

62.8

59.6

65.0

65.27

Sex

Male

235 (45.99)

108 (48.21)

34 (41.98)

12 (54.55)

45 (48.39)

2 (16.67)

34 (43.04)

Female

276 (54.01)

116 (51.79)

47 (58.02)

10 (45.45

48 (51.61)

10 (83.33)

45 (56.96)

Insurance

Medicare

222 (43.4)

109 (48.7)

31 (38.3)

11 (50.0)

27 (29.0)

4 (33.3)

40 (50.0)

Medicaid

62 (12.13)

13 (5.8)

12 (14.8)

2 (9.1)

21 (22.6)

1 (8.3)

13 (16.25)

Commercial

199 (38.9)

97 (43.3)

34 (42.0)

9 (40.9)

33 (35.5)

6 (50.0)

20 (25.0)

None

28 (5.5)

5 (2.2)

4 (4.9)

0 (0)

12 (12.9)

1 (8.3)

6 (7.5)

3.2. Clinical Characteristics
Table 2 presents the clinical characteristics of the study population sorted by ethnicity. The number of patients for each group that did not know (DNK) their HbA1c value is also indicated. Full medication list was obtained in 99.02% of patients, VA was obtained in 98.73% of eyes, and DR severity was diagnosed in 100% of eyes. Patients with missing information were excluded from the analyses of those measurements.
Table 2. Clinical characteristic of the study population.

Whole Population

White

Black/African American

Asian

Hispanic

Other

Did Not List

n=511 (100)

n=224 (43.8)

n=81 (15.9)

n=22 (4.3)

n=93 (18.2)

n=12 (2.3)

n=79 (15.5)

Avg. HbA1c

7.68

7.39

8.00

6.59

8.11

7.78

8.11

# DNK

177 (34.64)

61 (27.23)

27 (33.75)

11 (50)

42 (45.16)

1 (8.33)

33 (41.25)

# of Meds

6.05

6.29

6.07

4.27

6.00

8.08

5.57

# of DM Meds

1.83

1.81

1.69

1.76

2.07

2.42

1.71

DR Severity

None

235 (23.0%)

122 (27.2%)

24 (14.8%)

12 (27.3%)

47 (25.3%)

6 (25.0%)

24 (15.2%)

Mild

236 (23.1%)

114 (25.4%)

21 (13.0%)

16 (36.4%)

34 (18.3%)

5 (20.8%)

46 (29.1%)

Moderate

277 (27.1%)

138 (30.8%)

41 (25.3%)

11 (25.0%)

46 (24.7%)

8 (33.3%)

33 (20.9%)

Severe NP

95 (9.3%)

25 (5.6%)

22 (13.6%)

2 (4.6%)

14 (7.5%)

4 (16.7%)

28 (17.7%)

Proliferative

179 (17.5%)

49 (10.9%)

54 (33.3%)

3 (6.8%)

45 (24.2%)

1 (4.2%)

27 (17.1%)

Avg. VA (logMar)

0.35

0.31

0.45

0.36

0.37

0.44

0.35

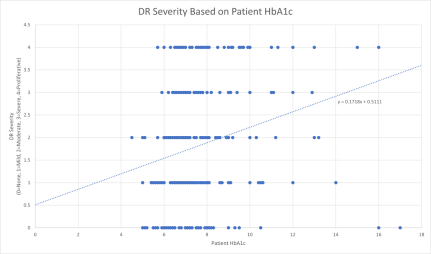
Figure 1. Plot of DR Severity for each eye by the patient’s HbA1c. 0 represents no retinopathy, 1 represents mild, 2 represents moderate, 3 represents severe, and 4 represents proliferative.
Figure 1 shows the severity of DR upon presentation for each patient graphed against their HbA1c upon presentation. The linear regression is also shown.
3.3. Zip Code Median Household Income and Insurance Analysis
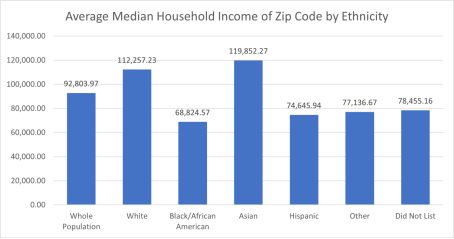
Figure 2. Average Median Household Income of Zip Code of Each Ethnic Group.
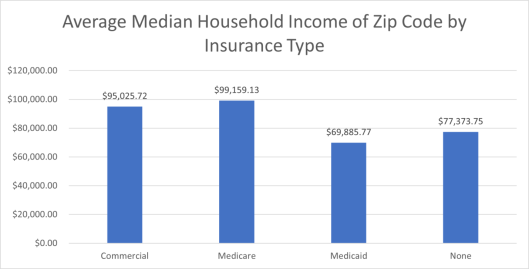
Figure 3. Average Median Household Income of Zip Code of Each Insurance Type.
Figure 2 and Figure 3 present the average median household incomes of the zip codes of patients sorted by ethnic group and insurance type respectively. Zip code was obtained in 100% of patients. Median household incomes were obtained from Connecticut Demographics by Cubit.
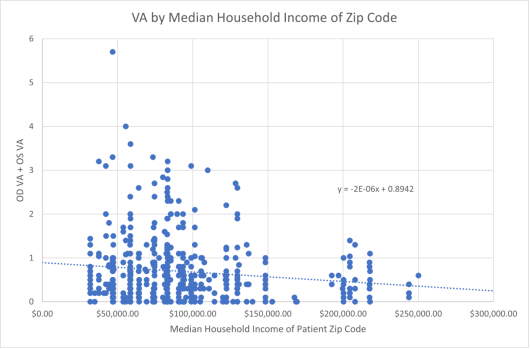
Figure 4. Plot of VA for each eye by the median household income of the patient’s zip code.
Figure 4 shows the VA of each patient’s eyes added together and plotted against the median household income of that patient’s zip code. A linear regression line is also shown. It can be seen that as median household income increases, VA upon presentation tends to improve, indicating that patients in wealthier towns present with better vision.
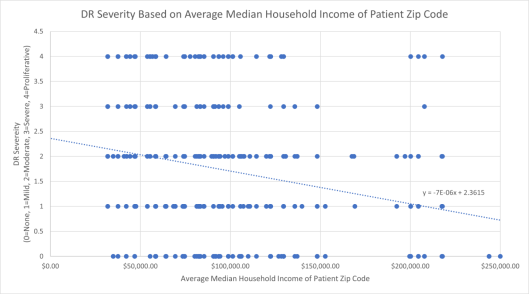
Figure 5. Plot of DR Severity for each eye by the median household income of the patient’s zip code. 0 represents no retinopathy, 1 represents mild, 2 represents moderate, 3 represents severe, and 4 represents proliferative.
Figure 5 shows the severity of diabetic retinopathy upon presentation plotted against the median household income of that patient’s zip code. A linear regression line is also shown. As median household income increases, severity of DR upon presentation also tends to improve
Table 3 shows the patients in the study sorted by insurance type, and Table 4 shows the grading of DR of the patient population’s eyes, sorted by sex and insurance type.
Table 3. Characteristics of patient population by insurance type.

Whole Population

Commercial

Medicaid

Medicare

None

n=511 (100)

n=199 (38.9)

n=62 (12.13)

n=222 (43.4)

n=28 (5.5)

Avg. Age

63.5

57.85

55.98

71.5

56.82

Sex

Male

235

107

24

90

14

Female

276

92

38

132

14

Avg. HbA1C

7.68

7.95

7.64

7.30

8.48

# DNK

177 (34.64)

57 (28.64)

28 (45.16)

82 (36.94)

11 (39.29)

Avg. VA (logMar)

0.35

0.29

0.35

0.41

0.42

DR Severity

None

235 (22.0)

83 (20.85)

23 (18.55)

120 (27.03)

9 (16.07)

Mild

236 (23.1)

84 (21.11)

23 (18.55)

126 (28.38)

3 (5.36)

Moderate

277 (28.2)

116 (29.15)

31 (25.00)

108 (24.32)

22 (39.29)

Severe NPDR

95 (9.3)

35 (8.79)

18 (14.52)

40 (9.01)

2 (3.57)

PDR

179 (17.4)

80 (20.10)

29 (23.39)

50 (11.04)

20 (35.71)

# of Meds

# of DM Meds

6.05

5.18

5.63

7.12

4.82

Table 4. DR grading of patient eyes upon presentation by sex and insurance type.

Male + Comm.

Female + Comm.

Male + Medicaid

Female + Medicaid

Male + Medicare

Female + Medicare

Male + None

Female+ None

DR Severity

None

37(17.29%)

46(25.00%)

7(14.58%)

16(21.05%)

52(28.89%)

68(25.76%)

7(25.00%)

2(7.14%)

Mild

52(24.30%)

32(17.395)

6(12.50%)

17(22.37%)

56(31.11%)

70(26.52%)

1(3.57%)

2(7.14%)

Moderate

57(26.64%)

59(32.07%)

14(29.17%)

17(22.37%)

41(22.78%)

67(25.38%)

8(28.57%)

14(50.00%)

Severe

24(11.21%)

11(5.98%)

7(14.58%)

11(14.47%)

10(5.56%)

30(11.36%)

2(7.14%)

0(0.00%)

Proliferative

44(20.56%)

36(19.57%)

14(29.17%)

15(19.74%)

21(11.67%)

29(10.98%)

10(35.71%)

10(35.71%)

Total

214(100%)

184(100%)

48(100%)

76(100%)

180(100%)

264(100%)

28(100%)

28(100%)

4. Discussion
Already the leading cause of blindness in working age adults, with an increasing prevalence of diabetes, DR and its social and economic burden on society is expected to increase significantly in the future. Diabetes mellitus, the condition that causes it, is known to affect communities of color greater than it does white communities due to differences in education, level of understanding of the disease, socioeconomic status, access to fresh healthy food options and access to healthcare. In this study we analyzed the ethnic differences of diabetic retinopathy upon initial presentation to evaluate whether the differences between ethnicities translated into differences in the severity of diabetic retinopathy. Other metrics that were measured and compared were type of insurance, VA, HbA1c, and patient demographics.
Table 1 presents the demographics of the study population, sorted by ethnicity. It should be noted that Black and Hispanic patients had lower average ages upon initial presentation (59.3 and 59.6 respectively) when compared to White patients (66.0) and Asian patients (62.8), indicating an earlier onset and more rapid progression of disease. This corresponds with Black and Hispanic patients tending to develop diabetes at younger ages than White and Asian patients. Table 1 also shows that Hispanic and Black/African American patients relied upon Medicaid at higher rates when compared to their Asian and White counterparts, and Hispanic patients had substantially higher uninsured rates than the rest of the study population. These findings indicate key differences in access to proper insurance across race lines, and thus, access to proper healthcare.
Table 2 presents the clinical data of the study population sorted by ethnicity. Hispanic and Black/African American patients had noticeably higher average HbA1c levels (8.11 and 8.00 respectively) than their White (7.39) and Asian (6.59) counterparts, indicating worse glycemic control. This is compounded by the fact that on average, Hispanic patients used more than two diabetes medications, the only ethnic group to do so. This may also reflect that Hispanic patients have more recalcitrant disease in additional poor compliance or disease awareness. Asian patients, however, had the highest rates of not knowing their HbA1c, and White patients had the second highest average use of diabetes medications. Table 2 also demonstrates that Black/African American patients and Hispanic patients present at much higher rates with extreme forms of DR with severe NPDR and PDR (46.9% and 31.7% respectively) when compared to their White and Asian counterparts (16.5% and 11.4% respectively). In addition to this, Black/African American patients presented with no DR at the lowest rate (14.8%), substantially lower when compared to the other ethnic groups (27.2%, 27.3%, and 25.8%). This is further reflected in the finding that Black/African American patients tended to present with the worst visual acuity compared with the other ethnic groups, indicated by having the highest average logMar value (0.45). Hispanic patients and Asian patients had similar average VAs (0.37 and 0.36, respectively), while White patients had the lowest logMar value (0.31). Across the metrics of HbA1c level, number of medications, severity of DR and VA, it can be seen that a noticeable healthcare disparity arises, with Hispanic and Black/African American patients suffering the most.
Figure 1 graphs the severity of DR in each eye against the HbA1c of that patient. The linear regression shows that there tends to be a correlation between an increase of a patient's HbA1c and that patient developing worse forms of DR, regardless of race. This corresponds with the findings of Table 2 in which groups with higher HbA1c tend to develop more severe cases of DR.
Figures 2 and 3 present the average median household incomes of the zip codes of patients sorted by ethnic group and insurance type respectively. These figures show that there are substantial differences in socioeconomic status that arise when the patients are sorted by ethnicity and zip code. Hispanic and Black/African American patients tend to live in communities with lower median household incomes when compared to their White and Asian counterparts. Additionally, patients with a commercial insurance plan or on Medicare tend to come from wealthier communities than those on Medicaid or with no insurance plan. These findings indicate severe differences in ability to afford a healthy diet, exercise and access to healthcare.
Figure 4 graphs patient’s VA against the median household income of their zip code. The linear regression shows that as median household income increases, the VA upon presentation also tends to improve, highlighting how the differences outlined in Figure 2 and Figure 3 can manifest in real clinical disparities. This is further reinforced by Figure 5, which shows each eye’s DR upon presentation graphed against the patient’s median household income. It can be seen that as the median household income increases, the severity of DR decreases, indicating that patients in wealthier towns on initial presentation have milder forms of the disease or are referred to an ophthalmologist at an earlier stage of the disease.
Table 3 presents the clinical and demographic information of the study population sorted by insurance type. Of the insurance groups, it can be seen that eyes of patients without medical insurance present with an extreme form of DR at the highest rate (39.28%), followed by those using Medicaid (37.91%), those on a Commercial insurance plan (28.89%) and Medicare patient eyes (20.05%). Additionally, the eyes of Medicare and Commercial insurance patients presented with no DR at higher rates (27.03% and 20.85% respectively) when compared to eyes of Medicaid patients and patients with no insurance plan (18.55% and 16.07% respectively). Along with Figure 3, these findings suggest the patients of lowest socioeconomic status also present with the most severe DR. This claim is supported by Figure 5, which displays that as median household income increases the initial presentation of DR tends to become less severe. While recorded patients on Medicaid did tend to have slightly lower HbA1c values than their counterparts on a Commercial plan (7.64 vs 7.95), a much higher percentage of Medicaid patients did not know their HbA1c levels when compared to patients on a Commercial plan (45.16% vs 28.64%), indicating worse glycemic control. Additionally, patients that lacked an insurance plan had the highest HbA1c values and greater-than-average rates of not knowing their HbA1c, suggesting poor glycemic control amongst that patient group.
Table 3 also suggests that populations of lower socioeconomic class tend to present in worse overall ocular health; patients with Medicare and patients with no insurance presented with the worst VA, as indicated with their high values on the logMar scale (0.41 and 0.42, respectively). The Medicare population’s level of visual acuity can be attributed to additional factors such as cataracts, glaucoma and macular degeneration. Their Commercial and Medicaid counterparts, on the other hand, presented with markedly better VA (logMar = 0.29 and logMar = 0.35, respectively).
Table 4 presents the grading of DR in patient’s eyes upon presentation sorted by both sex and insurance type. The data shows that for patients who are most vulnerable, i.e. Medicaid patients and patients with no insurance, male patients present with an extreme form of DR at a higher rate than their female counterparts. In Medicaid patients, male patients present with severe nonproliferative DR or proliferative DR 43.75% of the time compared to the 34.21% found in female patients. Similarly, male patients with no insurance present with extreme forms of DR 42.85%, noticeably greater than female patients with no insurance, who present with those forms 35.71% of the time. Males on commercial plans also perform worse than females on commercial plans (31.77% vs. 25.55%), but females on Medicare do present with severe forms of DR more frequently than males on Medicare (22.34% vs. 17.23%). These numbers indicate that male patients tend to present with worse forms of DR than their female counterpart, a fact exacerbated if the patients are less financially well off, except for the population of patients on Medicare, likely due to females having a higher life expectancy than males.
The findings above indicate that there are substantial health disparities that arise across both racial and socioeconomic lines. Black/African American and Hispanic patients tend to present with worse glycemic control, which contribute to them also presenting with more severe forms of DR in higher rates. Our findings align with modern data suggesting that Black/African American and Hispanic patients tend to come from poorer communities, shown by our analysis of zip code median household income and by their high rates of using Medicaid plans and being uninsured. Analyzing patients independent of race, patients without an insurance plan and patients utilizing a Medicaid plan tend to present with more severe cases of DR compared to their counterparts with Commercial insurance plans.
5. Conclusion
Diabetes mellitus is a collection of diseases, all of which result in an inability to process glucose. It has numerous adverse effects on health, including the risk of developing a number of secondary complications, one of them being diabetic retinopathy. DR is a microvascular disease that manifests as retinal hemorrhages and edema and is one of the primary causes of permanent vision loss. This study demonstrates that patients of certain marginalized groups, such as poorer patients, Black patients, and Hispanic patients, tend to develop more severe forms of DR, and develop them at a younger age, resulting in worse visual outcomes. These disparities are due in part to worse control of their diabetes, which we observed as greater HbA1C and blood sugar values. These patients comprise the most vulnerable communities of our population, being unable to afford medications, proper and healthy diet, and access to healthcare. Compounding this fact, there are less clinical trials for diabetes medications that involve Black and Hispanic participants, which could result in variations in efficacy leading to disease states in different ethnic population.
The solution to this complex problem will require a multi-disciplinary approach. For healthcare providers, increased collaboration between primary care providers and endocrinologists with optometrists and ophthalmologists is necessary to ensure members of these high-risk populations are regularly screened. These patients are at the highest risk for lacking available access to healthcare and having more aggressive diseases due to poor glucose control. The disease can be managed more effectively with timely diagnosis of DR at the earliest stages with routine health checkups and screenings. Additionally, patient education regarding diabetes and its potential impact on the body is crucial to any long-term care of the patient. The educational component should incorporate nutrition with focus on various ethnic communities and potential healthy alternatives. In these communities where obesity is also a growing issue that further compounds diabetes and DR, the nutritional education can help patient also develop better food choices as well as portion control. Finally, work should be done to make healthcare services more easily accessible to these vulnerable populations. Addressing language barriers, cultural barriers regarding the healthcare system, and access to transportation can all impact patients being compliant with medications or medical appointment, and even routine DR screening.
Overall, this research shows that there are significant healthcare gaps and disparities in patients with diabetes on their initial presentation to a retina specialist for treatment for DR. The impact of these disparities can lead to significant long-term morbidities in the at-risk population necessitating greater medical treatment, overall healthcare cost to the individual and society as a whole. Many of these individuals are of working age, and DR will lead to lost productivity and increase risk of visual disability, a further burden on the family and society. This loss of vision will also likely affect livelihood, worsening mental health issues in populations that are already disproportionally affected by mental illness. Recognizing these differences will be crucial for the medical communities, society and patients themselves develop the system to alleviate these disparities, improve patient outcome and quality of life.
Abbreviations

DNK

Did Not Know

DR

Diabetic Retinopathy

HbA1c

Hemoglobin A1c

NPDR

Nonproliferative Diabetic Retinopathy

PDR

Proliferative Diabetic Retinopathy

VA

Visual Acuity

VEGF

Vascular Endothelial Growth Factor

Author Contributions
Deven Huang: Conceptualization, Data Curation, Formal Analysis, Methodology, Visualization, Writing – original draft, Writing – review & editing
Sara Channamsetty: Conceptualization, Data Curation, Writing – original draft
Erol Verter: Conceptualization, Investigation, Writing – review & editing
John Huang: Conceptualization, Funding acquisition, Investigation, Methodology, Writing – review & editing
Financial Support
Regeneron Pharmaceuticals.
Conflicts of Interest
The authors declare no conflicts of interest.
References
[1] Banday MZ, Sameer AS, Nissar S. Pathophysiology of diabetes: An overview. Avicenna J Med. 2020; 10(4): 174-188. Published 2020 Oct 13.
[2] Bancks MP, Kershaw K, Carson AP, Gordon-Larsen P, Schreiner PJ, Carnethon MR. Association of Modifiable Risk Factors in Young Adulthood With Racial Disparity in Incident Type 2 Diabetes During Middle Adulthood. JAMA. 2017; 318(24): 2457-2465.
[3] Centers for Disease Control and Prevention. National Diabetes Statistics Report website.
[4] Wang W, Lo ACY. Diabetic Retinopathy: Pathophysiology and Treatments. Int J Mol Sci. 2018; 19(6): 1816. Published 2018 Jun 20.
[5] Williams R, Airey M, Baxter H, Forrester J, Kennedy-Martin T, Girach A. Epidemiology of diabetic retinopathy and macular oedema: a systematic review. Eye (Lond). 2004; 18(10): 963-983.
[6] Nsiah-Kumi P, Ortmeier SR, Brown AE. Disparities in diabetic retinopathy screening and disease for racial and ethnic minority populations--a literature review. J Natl Med Assoc. 2009; 101(5): 430-437. Published 2009 May.
[7] Thomas CG, Channa R, Prichett L, Liu TYA, Abramoff MD, Wolf RM. Racial/Ethnic Disparities and Barriers to Diabetic Retinopathy Screening in Youths. JAMA Ophthalmol. 2021; 139(7): 791-795.
[8] Huang BB, Radha Saseendrakumar B, Delavar A, Baxter SL. Racial Disparities in Barriers to Care for Patients With Diabetic Retinopathy in a Nationwide Cohort. Transl Vis Sci Technol. 2023; 12(3): 14. Published 2023 March.
[9] Rodríguez JE, Campbell KM. Racial and Ethnic Disparities in Prevalence and Care of Patients With Type 2 Diabetes. Clin Diabetes. 2017; 35(1): 66-70. Published 2017 Jan 1.
[10] Coney JM, Scott AW. Racial disparities in the screening and treatment of diabetic retinopathy. J Natl Med Assoc. 2022; 114(2): 171-181. Published 2022 Jan 31.
[11] Kulkarni, Karmeen. Food, Culture, and Diabetes in the United States. Clin Diabetes. 22(4): 190–192. Published 2004 Oct 1.
[12] Al Shamsi H, Almutairi AG, Al Mashrafi S, Al Kalbani T. Implications of Language Barriers for Healthcare: A Systematic Review. Oman Med J. 2020; 35(2): e122. Published 2020 Apr 30.
[13] Handtke O, Schilgen B, Mösko M. Culturally competent healthcare - A scoping review of strategies implemented in healthcare organizations and a model of culturally competent healthcare provision. PLoS One. 2019; 14(7): e0219971. Published 2019 Jul 30.
[14] Kempen JH, O'Colmain BJ, Leske MC, et al. The prevalence of diabetic retinopathy among adults in the United States. Arch Ophthalmol. 2004; 122(4): 552-563.
[15] Fenwick E, Rees G, Pesudovs K, et al. Social and emotional impact of diabetic retinopathy: a review. Clin Exp Ophthalmol. 2012; 40(1): 27-38. Published 2011 May 17.
Cite This Article
  • APA Style

    Huang, D., Channamsetty, S., Verter, E., Huang, J. (2024). Racial and Socioeconomic Differences Correlate with Healthcare Disparities in Patients with Diabetic Retinopathy. International Journal of Ophthalmology & Visual Science, 9(3), 30-39. https://doi.org/10.11648/j.ijovs.20240903.11

    Copy | Download

    ACS Style

    Huang, D.; Channamsetty, S.; Verter, E.; Huang, J. Racial and Socioeconomic Differences Correlate with Healthcare Disparities in Patients with Diabetic Retinopathy. Int. J. Ophthalmol. Vis. Sci. 2024, 9(3), 30-39. doi: 10.11648/j.ijovs.20240903.11

    Copy | Download

    AMA Style

    Huang D, Channamsetty S, Verter E, Huang J. Racial and Socioeconomic Differences Correlate with Healthcare Disparities in Patients with Diabetic Retinopathy. Int J Ophthalmol Vis Sci. 2024;9(3):30-39. doi: 10.11648/j.ijovs.20240903.11

    Copy | Download

  • @article{10.11648/j.ijovs.20240903.11,
      author = {Deven Huang and Sara Channamsetty and Erol Verter and John Huang},
      title = {Racial and Socioeconomic Differences Correlate with Healthcare Disparities in Patients with Diabetic Retinopathy
    },
      journal = {International Journal of Ophthalmology & Visual Science},
      volume = {9},
      number = {3},
      pages = {30-39},
      doi = {10.11648/j.ijovs.20240903.11},
      url = {https://doi.org/10.11648/j.ijovs.20240903.11},
      eprint = {https://article.sciencepublishinggroup.com/pdf/10.11648.j.ijovs.20240903.11},
      abstract = {Diabetic retinopathy (DR), an ocular complication of diabetes mellitus, is the leading cause of permanent blindness in the United States for young adults. Due to biological and environmental factors, diabetes mellitus is well known to disproportionally affect people of color and those of lower socioeconomic status; however, the racial and socioeconomic disparities of DR are less researched. The purpose of this research is to elucidate any differences in DR presentation that arise across racial and socioeconomic lines and to determine if diabetic control can be a predicting factor for DR severity. For this study, a retrospective patient chart analysis was performed on 511 consecutive newly referred patients with diabetes at New England Retina Associates, a vitreo-retinal ophthalmology practice with four locations throughout Connecticut. Our analysis shows that, when compared to their White and Asian counterparts, Black/African American and Hispanic patients present with DR at younger ages, had the higher HbA1c, were uninsured at higher rates, and presented with severe forms of DR in higher rates when compared to their counterparts. Many of these patterns are mirrored in patients that are uninsured or on Medicaid, indicators of lower socioeconomic status. Additionally, regardless of race or socioeconomic status, patients with higher HbA1c tended to present with more severe forms of DR. These findings indicate that DR disproportionately affects racial minority populations and those in socioeconomically disadvantageous positions, but effective glycemic control and routine eye exam screening can improve the outcomes of these patients. It is important for medical providers to recognize the disparities in these vulnerable populations in order to facilitate the timely referrals and the proper care for their long-term ocular health.
    },
     year = {2024}
    }
    

    Copy | Download

  • TY  - JOUR
    T1  - Racial and Socioeconomic Differences Correlate with Healthcare Disparities in Patients with Diabetic Retinopathy
    
    AU  - Deven Huang
    AU  - Sara Channamsetty
    AU  - Erol Verter
    AU  - John Huang
    Y1  - 2024/07/02
    PY  - 2024
    N1  - https://doi.org/10.11648/j.ijovs.20240903.11
    DO  - 10.11648/j.ijovs.20240903.11
    T2  - International Journal of Ophthalmology & Visual Science
    JF  - International Journal of Ophthalmology & Visual Science
    JO  - International Journal of Ophthalmology & Visual Science
    SP  - 30
    EP  - 39
    PB  - Science Publishing Group
    SN  - 2637-3858
    UR  - https://doi.org/10.11648/j.ijovs.20240903.11
    AB  - Diabetic retinopathy (DR), an ocular complication of diabetes mellitus, is the leading cause of permanent blindness in the United States for young adults. Due to biological and environmental factors, diabetes mellitus is well known to disproportionally affect people of color and those of lower socioeconomic status; however, the racial and socioeconomic disparities of DR are less researched. The purpose of this research is to elucidate any differences in DR presentation that arise across racial and socioeconomic lines and to determine if diabetic control can be a predicting factor for DR severity. For this study, a retrospective patient chart analysis was performed on 511 consecutive newly referred patients with diabetes at New England Retina Associates, a vitreo-retinal ophthalmology practice with four locations throughout Connecticut. Our analysis shows that, when compared to their White and Asian counterparts, Black/African American and Hispanic patients present with DR at younger ages, had the higher HbA1c, were uninsured at higher rates, and presented with severe forms of DR in higher rates when compared to their counterparts. Many of these patterns are mirrored in patients that are uninsured or on Medicaid, indicators of lower socioeconomic status. Additionally, regardless of race or socioeconomic status, patients with higher HbA1c tended to present with more severe forms of DR. These findings indicate that DR disproportionately affects racial minority populations and those in socioeconomically disadvantageous positions, but effective glycemic control and routine eye exam screening can improve the outcomes of these patients. It is important for medical providers to recognize the disparities in these vulnerable populations in order to facilitate the timely referrals and the proper care for their long-term ocular health.
    
    VL  - 9
    IS  - 3
    ER  - 

    Copy | Download

Author Information
  • College of Arts and Science, New York University, New York City, United States; New England Retina Associates, ReFocus Eye Health, Hamden, United States

  • Student Body, Greenwich Academy, Greenwich, United States

  • New England Retina Associates, ReFocus Eye Health, Hamden, United States; Ophthalmology, Yale New Haven Hospital, New Haven, United States; Ophthalmology, Greenwich Hospital, Greenwich, United States; Ophthalmology, Bridgeport Hospital, Bridgeport, United States; Ophthalmology, Stamford Hospital, Stamford, United States; Ophthalmology, Saint Vincent’s Hospital, Bridgeport, United States

  • New England Retina Associates, ReFocus Eye Health, Hamden, United States; Ophthalmology, Yale New Haven Hospital, New Haven, United States; Ophthalmology, Greenwich Hospital, Greenwich, United States; Ophthalmology, Bridgeport Hospital, Bridgeport, United States;Ophthalmology, Saint Vincent’s Hospital, Bridgeport, United States; School of Medicine, Yale University, New Haven, United States; Administration, Connecticut Uveitis Foundation, West Hartford, United States