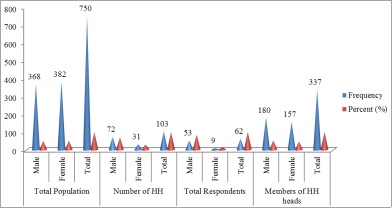
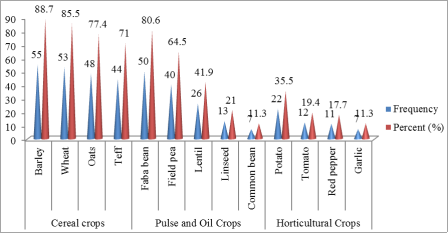
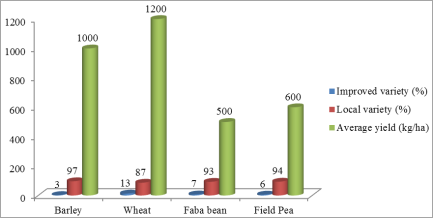
Baseline characterization builds necessary foundation for the plan and obtains proper information for elective planning, implementation and monitoring of the research and development endeavors. The objective of the study was to document baseline information on socio-economic for planning and impact monitoring and to identify and document major socio-economic constraints and potential in the watershed. A total of 62 sample households were selected randomly from all farmers engaged in farming activities in the watershed. The average inorganic fertilizer (NPS and Urea) used in the watershed were 75 kg/ha and 75 kg/ha respectively. The response of the respondents showed that the average yield obtained in the watershed was about 10 qt/ha for barley, 12 qt/ha for wheat, 5 qt/ha for faba bean and field pea 6 qt/ha. The major livestock feed type in the watershed were crop residue (93.5%) followed by hay making (91.9%), grazing in the field (80.6%), local beverage by-products (72.6%), concentrates of different type (67.7%), green feed (50%), stubble grazing (41.9%) and improved forage (14.5%). The result of survey shows that the major income sources of the farmers living in the watershed were livestock production (77.4%) followed by crop production (45.2%) and off-farm activities (25.8%). About 71% of the households have encountered high cost and shortage of agricultural inputs followed by low crop productivity (19.4%), crop disease (8.1%) and existence storage pests (1.6%) were the common in the watershed. In the watershed, high cost of agricultural inputs, low crop productivity, crop disease, shortage of animal feed and fodder, inflation, lack of employment opportunity and other income source were addressed as the highest priority issues by the community that are contributing to the crop productivity reductions and low level of their livelihood in the watershed. By considering the addressed problem related to crop production, livestock production and socio-economic, the interventions on introduction and demonstration of improved and high yielding crop varieties that are resistant or tolerant to the already existing and emerging pests to increase production and productivity of crops should be done. In general, immediate short-term actions should be taken particularly participatory integrated watershed management were recommended.
| Published in | International Journal of Natural Resource Ecology and Management (Volume 9, Issue 3) |
| DOI | 10.11648/j.ijnrem.20240903.11 |
| Page(s) | 65-81 |
| Creative Commons |
This is an Open Access article, distributed under the terms of the Creative Commons Attribution 4.0 International License (http://creativecommons.org/licenses/by/4.0/), which permits unrestricted use, distribution and reproduction in any medium or format, provided the original work is properly cited. |
| Copyright |
Copyright © The Author(s), 2024. Published by Science Publishing Group |
Watershed, Characterization, Identification, Prioritization
Characters | Minimum | Maximum | Mean | Frequency | Percent |
|---|---|---|---|---|---|
Age of HH head | 22 | 87 | 47 | ||
HH head Age category | |||||
22-60 | 49 | 79 | |||
>60 | 12 | 21 | |||
Education level of HH head | |||||
Un educated | 33 | 53.2 | |||
Elementary school | 25 | 40.3 | |||
Secondary school | 4 | 6.5 | |||
Age of HH family | 0.33 | 87 | 24.3 | ||
HH family Age category | |||||
<16 Male | 67 | 19.9 | |||
<16 Female | 60 | 17.8 | |||
16-60 Male | 101 | 30.0 | |||
16-60 Female | 89 | 26.4 | |||
>60 Male | 12 | 3.6 | |||
>60 Female | 8 | 2.4 | |||
Household Family Size | 2 | 11 | 5.5 | ||
Education level of HH family | |||||
Un educated | 145 | 43.0 | |||
Elementary school | 165 | 49.0 | |||
Secondary school | 26 | 7.7 | |||
College | 1 | 0.3 | |||
Land use patterns (ha) | Frequency | Percent | Max | Min | Mean |
|---|---|---|---|---|---|
Rain fed annual crops | 53 | 85.5 | 4.25 | 0.25 | 1.41 |
Irrigated annual crops | 1 | 1.6 | 0.5 | 0.50 | 0.50 |
Perennial crops | 1 | 1.6 | 0.5 | 0.50 | 0.50 |
Grazing land | 46 | 74.2 | 4 | 0.13 | 0.86 |
Shared in | 31 | 50.0 | 6.75 | 0.25 | 1.82 |
Plantation | 26 | 41.9 | 2 | 0.06 | 0.27 |
Fallow land | 12 | 19.4 | 1 | 0.25 | 0.48 |
Shared out | 10 | 16.1 | 3.5 | 0.38 | 1.41 |
Natural forest | 3 | 4.8 | 0.75 | 0.25 | 0.42 |
Wetland | 1 | 1.6 | 0.25 | 0.25 | 0.25 |
Land (ha) | Farm land ownership | Total land ownership | ||
|---|---|---|---|---|
Frequency | Percent | Frequency | Percent | |
Landless | 9 | 14.5 | 3 | 4.8 |
<1 | 14 | 22.6 | 10 | 16.1 |
1-2 | 21 | 33.9 | 16 | 25.8 |
2-3 | 16 | 25.8 | 9 | 14.5 |
3-4 | 1 | 1.6 | 15 | 24.2 |
>4 | 1 | 1.6 | 9 | 14.5 |
Total | 62 | 100.0 | 62 | 100.0 |
Farm and nonfarm tools | Frequency | Percent | Min | Max | Mean |
|---|---|---|---|---|---|
Corrugated house | 61 | 98.4 | 1 | 5 | 1.7 |
Hat house | 39 | 62.9 | 1 | 2 | 1.1 |
Spade | 47 | 75.8 | 1 | 2 | 1.1 |
Hoe | 30 | 48.4 | 1 | 2 | 1.2 |
Axe | 55 | 88.7 | 1 | 4 | 1.4 |
TV | 16 | 25.8 | 1 | 1 | 1.0 |
Radio | 35 | 56.5 | 1 | 2 | 1.0 |
Mobile phone | 40 | 64.5 | 1 | 3 | 1.4 |
Solar power | 11 | 17.7 | 1 | 1 | 1.0 |
Knapsacks spray | 11 | 17.7 | 1 | 2 | 1.1 |
Input Used | Frequency | Percent | Amount of used in kg/ha or lit/ha | ||
|---|---|---|---|---|---|
Min | Max | Mean | |||
NPS | 2 | 3.2 | 50 | 100 | 75 |
UREA | 5 | 8.1 | 30 | 100 | 75 |
Both NPS & Urea | 11 | 17.7 | 50 | 250 | 150 |
Conventional compost | 5 | 8.1 | 500 | 1200 | 250 |
FYM | 10 | 16.1 | 1000 | 10000 | 400 |
Herbicide | 30 | 48.4 | 0.16 | 0.75 | 0.35 |
Insecticide | 3 | 4.8 | 0.16 | 0.5 | 0.23 |
Fungicide | 2 | 3.2 | 0.2 | 1 | 0.45 |
Owned livestock/product (number and liter/year) | Frequency | Percent | Min | Max | Average |
|---|---|---|---|---|---|
Local cow | 40 | 64.5 | 1 | 5 | 2.2 |
Cross breed cow | 36 | 58.1 | 1 | 20 | 2.6 |
Milk | 45 | 72.6 | 60 | 1500 | 462.3 |
Ox | 38 | 61.3 | 1 | 6 | 2.4 |
Local bulls | 13 | 21.0 | 1 | 3 | 1.7 |
Cross breed bulls | 15 | 24.2 | 1 | 2 | 1.4 |
Local heifers | 16 | 25.8 | 1 | 2 | 1.6 |
Cross breed heifers | 27 | 43.5 | 1 | 2 | 1.3 |
Calves | 41 | 66.1 | 1 | 5 | 2.0 |
Sheep | 38 | 61.3 | 1 | 21 | 5.3 |
Horse | 11 | 17.7 | 1 | 2 | 1.2 |
Donkey | 47 | 75.8 | 1 | 4 | 1.8 |
Local chicken | 23 | 37.1 | 1 | 14 | 3.5 |
Exotic chicken | 20 | 32.3 | 1 | 90 | 9.1 |
Used feed type | Used respondents | Source of feed | ||
|---|---|---|---|---|
Frequency | Percent | Own | Purchased | |
Crop residues | 58 | 93.5 | 41 | 10 |
Hay making | 57 | 91.9 | 28 | 25 |
Grazing in the field | 50 | 80.6 | 35 | 14 |
Local beverage by-products | 45 | 72.6 | - | 45 |
Concentrates of different types | 42 | 67.7 | - | 42 |
Green feed (cut & carry) | 31 | 50.0 | 21 | 10 |
Stubble grazing | 26 | 41.9 | 23 | - |
Improved forages/fodder | 9 | 14.5 | 1 | 8 |
Income Source | Owned farmers | Obtained income in ETB | |||
|---|---|---|---|---|---|
Frequency | Percent | Min | Max | Average | |
Crop production | 28 | 45.2 | 1000 | 72000 | 20930.56 |
Livestock production | 48 | 77.4 | 4320 | 286000 | 102863.1 |
Off farm activities | 16 | 25.8 | 1000 | 54000 | 15790 |
Socio-economic related constraints | Frequency | Percent |
|---|---|---|
Inflation | 28 | 45.2 |
Lack of employment opportunity | 25 | 40.3 |
High population density | 5 | 8.1 |
Lack of other income source | 2 | 3.2 |
Human disease | 1 | 1.6 |
Lack of energy source | 1 | 1.6 |
Total | 62 | 100.0 |
Production related constraints | Frequency | Percent |
|---|---|---|
Shortage of agricultural input | 44 | 71.0 |
Decline of crop productivity | 12 | 19.4 |
Crop disease | 5 | 8.1 |
Storage pests | 1 | 1.6 |
Total | 62 | 100.0 |
Livestock related constraints | Frequency | Percent |
|---|---|---|
Shortage of animal feed and fodder | 53 | 85.5 |
Animal disease | 6 | 9.7 |
Absence of good grazing system | 3 | 4.8 |
Total | 62 | 100.0 |
Institutional and infrastructure related constraints | Frequency | Percent |
|---|---|---|
Lack of drinking water | 32 | 51.6 |
Lack of electricity | 25 | 40.3 |
Lack of credit access | 2 | 3.2 |
Lack of market access | 2 | 3.2 |
Lack of animal clinic | 1 | 1.6 |
Total | 62 | 100.0 |
Potentials | Frequency | Percent |
|---|---|---|
A. Socio-economic potentials | ||
Availability of labor force | 49 | 79.0 |
All weather road | 11 | 17.7 |
Market access | 2 | 3.2 |
Total | 62 | 100.0 |
B. Institutions potentials | ||
Informal institutions | 40 | 64.5 |
Schools | 22 | 35.5 |
Total | 62 | 100.0 |
°C | Degree Centigrade |
DA’s | Developmental Agent’s |
FYM | Farmyard Manure |
GDP | Gross Domestic Product |
GPS | Global Positioning System |
ha | Hectare |
Kg | Kilograms |
Km | Kilometers |
km2 | Square Kilometers |
mm | Millimeters |
qt | Quintals |
SPSS | Statistical Package for Social Sciences |
| [1] | FAO, (2003). Trade Reforms and Food security: Conceptualizing the linkages. World Health Organization- on line |
| [2] | MOA (Ministry of Agriculture) (2010). “Animal and Plant Health Regulatory Directorate.” crop variety register 13. |
| [3] | Danyo, et al., (2017). Realizing Ethiopia’s Green Transformation: country environmental analysis, environment and natural resources global practice. Washington, DC: World Bank. |
| [4] | IFAD, (2016). Federal Democratic Republic of Ethiopia. Country strategic opportunities programme. Executive Board 119th Session. EB 2016/119/R.15, Rome. |
| [5] | Rhoades R. E and Elliot T. S (2000). Participatory watershed research and management: where the shadow falls”. Gatekeeper series no. 81, London: International institute for Economic Development (IIED). |
| [6] | Abbaspour, K. C., Yang, J., Reichert, P., Vejdani, M., Haghighat, S. &Srinivasan, R. (2008). SWAT Calibration and Uncertainty Programs - A User Manual. |
| [7] | Brooks, K. N., F folliott, P. F., Gregerson, H. M., and DeBano, L. F. (2003). Hydrology and the Management of Watersheds. Third edition, Iowa State Press, Black well Publishing Company. |
| [8] | Bonsa Fentale Jilo, Gemeda Terfassa Fida, Desta Negayo Komicho. (2020) Socio-economic and Biophysical Resources Characterization of ‘Warja’ Watershed in Adami Tulu Jido Kombolcha District, East Shewa Zone, Oromia, Ethiopia. |
| [9] | Chomba, G. (2004). Factors affecting small holder farmers, adoption of soil and water conservation practices in Zambia. Department of Agricultural Economics. |
| [10] | Abera, B. (2003). Factors Influencing the Adoption of Soil and Water ConservationPractices In North Western Ethiopia. Discussion Paper No37, University ofGottingen, Gottingen. |
| [11] | Krishna, R., Bicol, K., Ingrid, I. and Giridhari, S. (2008). Determinants of farmers’ adoption of improved soil conservation technology in a middle mountain watershed of central nepal. Environmental Management, Springer, New York. |
| [12] | Fikru, A. (2009). Assessment of adoption behavior of soil and water conservation practices in the koga watershed, highlands of Ethiopia. Unpublished master thesis, cornell university, school of graduate studies, New York. (Country Not Stated). |
| [13] | Wagayehu, B. & Darke, L. (2003). Soil and Water Conservation Decision of Subsistence Farmers in the Eastern Highlands of Ethiopia: A Case Study of the Hunde-Lafto. |
| [14] | Wickama, J. M. and J. G. Mowo, (2001). Indigenous nutrient resources in Tanzania. Managing African Soils no. 21. |
| [15] | Meliyo, J. L., J. M. Wickama, K. F. G. Masuki, J. G. Mowo. (2000). Soil characterization of kwalei village, lushoto district. Research report, ARI – Mlingano. |
| [16] | FAO. (2019). The future of livestock in Ethiopia. Opportunities and challenges in the face of uncertainty. Rome. 48 pp. License: CC BY-NC-SA 3.0 IGO. |
| [17] | Bekele, W. and Drake, L. (2003). “Soil and water conservation decision behavior of subsistence farmers in the eastern highlands of Ethiopia: a case study of the Hunde Lafto Area. Journal of Ecological Economics, 46: 61-81. |
| [18] | Mpawenimana, J (2005). Analysis of socio-economic factors affecting the production of Bananas in Rwanda: A case study of Kanama district. University of Nairobi: Nairobi. |
APA Style
Bedada, E., Jifara, M., Mengistu, B., Muluna, M., Tolosa, M., et al. (2024). Socio-Economic Characterization, Identification and Prioritization of Major Constraints and Potentials in Gara Ebanu Community Watershed in Sululta District, Ethiopia. International Journal of Natural Resource Ecology and Management, 9(3), 65-81. https://doi.org/10.11648/j.ijnrem.20240903.11
ACS Style
Bedada, E.; Jifara, M.; Mengistu, B.; Muluna, M.; Tolosa, M., et al. Socio-Economic Characterization, Identification and Prioritization of Major Constraints and Potentials in Gara Ebanu Community Watershed in Sululta District, Ethiopia. Int. J. Nat. Resour. Ecol. Manag. 2024, 9(3), 65-81. doi: 10.11648/j.ijnrem.20240903.11
AMA Style
Bedada E, Jifara M, Mengistu B, Muluna M, Tolosa M, et al. Socio-Economic Characterization, Identification and Prioritization of Major Constraints and Potentials in Gara Ebanu Community Watershed in Sululta District, Ethiopia. Int J Nat Resour Ecol Manag. 2024;9(3):65-81. doi: 10.11648/j.ijnrem.20240903.11
@article{10.11648/j.ijnrem.20240903.11,
  author = {Endale Bedada and Mengistu Jifara and Bikila Mengistu and Meseret Muluna and Meron Tolosa and Alemayehu Biri and Firaol Legesse and Ajema Lemma and Bedo Hora and Lemma Teklu},
  title = {Socio-Economic Characterization, Identification and Prioritization of Major Constraints and Potentials in Gara Ebanu Community Watershed in Sululta District, Ethiopia
},
  journal = {International Journal of Natural Resource Ecology and Management},
  volume = {9},
  number = {3},
  pages = {65-81},
  doi = {10.11648/j.ijnrem.20240903.11},
  url = {https://doi.org/10.11648/j.ijnrem.20240903.11},
  eprint = {https://article.sciencepublishinggroup.com/pdf/10.11648.j.ijnrem.20240903.11},
  abstract = {Baseline characterization builds necessary foundation for the plan and obtains proper information for elective planning, implementation and monitoring of the research and development endeavors. The objective of the study was to document baseline information on socio-economic for planning and impact monitoring and to identify and document major socio-economic constraints and potential in the watershed. A total of 62 sample households were selected randomly from all farmers engaged in farming activities in the watershed. The average inorganic fertilizer (NPS and Urea) used in the watershed were 75 kg/ha and 75 kg/ha respectively. The response of the respondents showed that the average yield obtained in the watershed was about 10 qt/ha for barley, 12 qt/ha for wheat, 5 qt/ha for faba bean and field pea 6 qt/ha. The major livestock feed type in the watershed were crop residue (93.5%) followed by hay making (91.9%), grazing in the field (80.6%), local beverage by-products (72.6%), concentrates of different type (67.7%), green feed (50%), stubble grazing (41.9%) and improved forage (14.5%). The result of survey shows that the major income sources of the farmers living in the watershed were livestock production (77.4%) followed by crop production (45.2%) and off-farm activities (25.8%). About 71% of the households have encountered high cost and shortage of agricultural inputs followed by low crop productivity (19.4%), crop disease (8.1%) and existence storage pests (1.6%) were the common in the watershed. In the watershed, high cost of agricultural inputs, low crop productivity, crop disease, shortage of animal feed and fodder, inflation, lack of employment opportunity and other income source were addressed as the highest priority issues by the community that are contributing to the crop productivity reductions and low level of their livelihood in the watershed. By considering the addressed problem related to crop production, livestock production and socio-economic, the interventions on introduction and demonstration of improved and high yielding crop varieties that are resistant or tolerant to the already existing and emerging pests to increase production and productivity of crops should be done. In general, immediate short-term actions should be taken particularly participatory integrated watershed management were recommended.
},
 year = {2024}
}
TY  - JOUR
T1  - Socio-Economic Characterization, Identification and Prioritization of Major Constraints and Potentials in Gara Ebanu Community Watershed in Sululta District, Ethiopia

AU  - Endale Bedada
AU  - Mengistu Jifara
AU  - Bikila Mengistu
AU  - Meseret Muluna
AU  - Meron Tolosa
AU  - Alemayehu Biri
AU  - Firaol Legesse
AU  - Ajema Lemma
AU  - Bedo Hora
AU  - Lemma Teklu
Y1  - 2024/07/15
PY  - 2024
N1  - https://doi.org/10.11648/j.ijnrem.20240903.11
DO  - 10.11648/j.ijnrem.20240903.11
T2  - International Journal of Natural Resource Ecology and Management
JF  - International Journal of Natural Resource Ecology and Management
JO  - International Journal of Natural Resource Ecology and Management
SP  - 65
EP  - 81
PB  - Science Publishing Group
SN  - 2575-3061
UR  - https://doi.org/10.11648/j.ijnrem.20240903.11
AB  - Baseline characterization builds necessary foundation for the plan and obtains proper information for elective planning, implementation and monitoring of the research and development endeavors. The objective of the study was to document baseline information on socio-economic for planning and impact monitoring and to identify and document major socio-economic constraints and potential in the watershed. A total of 62 sample households were selected randomly from all farmers engaged in farming activities in the watershed. The average inorganic fertilizer (NPS and Urea) used in the watershed were 75 kg/ha and 75 kg/ha respectively. The response of the respondents showed that the average yield obtained in the watershed was about 10 qt/ha for barley, 12 qt/ha for wheat, 5 qt/ha for faba bean and field pea 6 qt/ha. The major livestock feed type in the watershed were crop residue (93.5%) followed by hay making (91.9%), grazing in the field (80.6%), local beverage by-products (72.6%), concentrates of different type (67.7%), green feed (50%), stubble grazing (41.9%) and improved forage (14.5%). The result of survey shows that the major income sources of the farmers living in the watershed were livestock production (77.4%) followed by crop production (45.2%) and off-farm activities (25.8%). About 71% of the households have encountered high cost and shortage of agricultural inputs followed by low crop productivity (19.4%), crop disease (8.1%) and existence storage pests (1.6%) were the common in the watershed. In the watershed, high cost of agricultural inputs, low crop productivity, crop disease, shortage of animal feed and fodder, inflation, lack of employment opportunity and other income source were addressed as the highest priority issues by the community that are contributing to the crop productivity reductions and low level of their livelihood in the watershed. By considering the addressed problem related to crop production, livestock production and socio-economic, the interventions on introduction and demonstration of improved and high yielding crop varieties that are resistant or tolerant to the already existing and emerging pests to increase production and productivity of crops should be done. In general, immediate short-term actions should be taken particularly participatory integrated watershed management were recommended.

VL  - 9
IS  - 3
ER  -
Oromia Agricultural Research Institute, Fitche Agricultural Research Center, Fitche, Ethiopia
Information