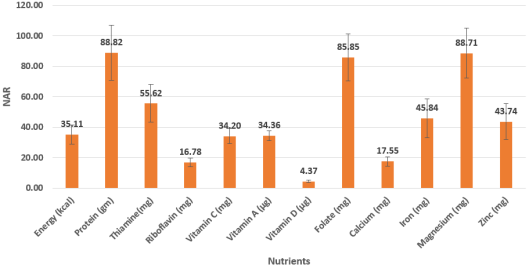
Nutritional deficiencies among tribal adolescent girls remain a significant public health concern in India. This study assessed the anthropometric status and dietary nutrient adequacy of 383 tribal adolescent girls aged 13–18 years, purposively selected from four Ashram Shalas in Nagpur District, Maharashtra. Demographic profile was recorded using a structured questionnaire. Anthropometric measurements (height and weight) were recorded using standard procedures, and BMI was computed. Dietary intake was assessed by the 24-hour recall method, and nutrient adequacy ratios (NAR) were calculated and compared with ICMR-NIN Estimated Average Requirements (EAR) 2024 references. Results showed that the majority belonged to the Upper Lower class (73.8%) and the overall mean BMI of 18.39 kg/m2 indicated borderline nutritional vulnerability. The mean NAR showed that energy adequacy was critically low (35.11%), with calcium (17.55%), riboflavin (16.78%), and Vitamin D (4.37%) being the most deficient. Vitamin C (34.20%), Vitamin A (34.36%), and iron (45.84%) also showed substantial inadequacy. Thiamine (55.62%) and zinc (43.74%) were moderately deficient. The adequacy of protein (88.82%), magnesium (88.71%), and folate (85.85%) were adequate. Energy intake was critically low in 97.91% of participants, while protein adequacy was relatively better (76.24%). All subjects had low intakes of Vitamins A, D, riboflavin, and calcium across all age groups. Linear regression revealed that age, socioeconomic status, and BMI were collectively poor predictors of nutrient adequacy (R2<0.01), suggesting unmeasured factors such as dietary diversity and food security are more influential determinants. These findings highlight an urgent need for targeted nutritional interventions for tribal adolescent girls in this region.
| Published in | International Journal of Nutrition and Food Sciences (Volume 15, Issue 3) |
| DOI | 10.11648/j.ijnfs.20261503.12 |
| Page(s) | 104-111 |
| Creative Commons |
This is an Open Access article, distributed under the terms of the Creative Commons Attribution 4.0 International License (http://creativecommons.org/licenses/by/4.0/), which permits unrestricted use, distribution and reproduction in any medium or format, provided the original work is properly cited. |
| Copyright |
Copyright © The Author(s), 2026. Published by Science Publishing Group |
Tribal Adolescent Girls, Nutrient Adequacy Ratio, BMI, Socioeconomic Status, Linear Regression
SN | Demographic and Anthropometric Characteristics | N (Percent) |
|---|---|---|
Age in Years | ||
1 | 13 | 71 (18.53) |
14 | 107 (28.93) | |
15 | 100 (26.10) | |
16 | 67 (17.49) | |
17 | 32 (8.35) | |
18 | 6 (1.56) | |
2 | Socioeconomic Status | |
Upper Lower | 283 (73.89) | |
Lower Middle | 96 (25.06) | |
Upper Middle | 4 (1.04) | |
3 | Anthropometric measurements | Mean + SD |
Height (cm) | 151.45 + 7.84 | |
Weight (kg) | 42.14 + 5.99 | |
BMI (kg/m2) | 18.39 + 2.41 |
Nutrients | Low intake (NAR<50%) | Moderate intake (NAR 50-75%) | Adequate intake (NAR>75%) | 2 * | P value |
|---|---|---|---|---|---|
Energy (kcal) | 375 (97.91) | 8 (2.08) | 0 (0.0) | 3.264 | 0.659 |
Protein (gm) | 3 (0.78) | 88 (22.97) | 292 (76.24) | 12.907 | 0.229 |
Thiamine (mg) | 115 (30.03) | 246 (64.23) | 0 (0.0) | 11.307 | 0.334 |
Riboflavin (mg) | 383 (100.0) | 0 (0.0) | 0 (0.0) | NA | NA |
Vitamin C (mg) | 374 (97.65) | 9 (2.34) | 0 (0.0) | 5.958 | 0.31 |
Vitamin A (µg) | 383 (100.0) | 0 (0.0) | 0 (0.0) | NA | NA |
Vitamin D (µg) | 383 (100.0) | 0 (0.0) | 0 (0.0) | NA | NA |
Folate (mg) | 2 (0.52) | 93 (24.28) | 288 (75.19) | 15.150 | 0.127 |
Calcium (mg) | 383 (100.0) | 0 (0.0) | 0 (0.0) | NA | NA |
Iron (mg) | 177 (46.21) | 204 (53.26) | 2 (0.52) | 7.361 | 0.691 |
Magnesium (mg) | 2 (0.52) | 78 (20.36) | 303 (79.11) | 13.212 | 0.212 |
Zinc (mg) | 233 (60.83) | 150 (39.16) | 0 (0.0) | 1.891 | 0.864 |
SN | Nutrients | R Square | Adjusted R Square | F | P Value | Intercept | P value | Age | SES | BMI (Kg/m2) | |||
|---|---|---|---|---|---|---|---|---|---|---|---|---|---|
β | P value | β | P Value | β | P Value | ||||||||
1 | Energy | 0.009 | 0.001 | 1.135 | 0.335 | 18.83 | 0.101 | -0.277 | 0.684 | -0.682 | 0.705 | 0.635 | 0.07 |
2 | Protein | 0.009 | 0.001 | 1.159 | 0.325 | 48.24 | 0.104 | -0.793 | 0.65 | -1.572 | 0.735 | 1.661 | 0.066 |
3 | Vitamin A | 0.01 | 0.002 | 1.231 | 0.298 | 21.22 | 0.048 | -0.406 | 0.521 | -1.089 | 0.518 | 0.594 | 0.069 |
4 | Vitamin D | 0.003 | -0.005 | 0.395 | 0.756 | 4.881 | 0.001 | 0.058 | 0.483 | 0.156 | 0.481 | -0.031 | 0.468 |
5 | Vitamin C | 0.008 | 0.000 | 1.032 | 0.379 | 31.08 | 0.000 | 0.021 | 0.918 | -0.273 | 0.617 | 0.171 | 0.106 |
6 | Thiamine | 0.032 | 0.001 | 0.130 | 0.942 | 55.36 | 0.000 | -0.109 | 0.838 | 0.739 | 0.520 | 0.043 | 0.876 |
7 | Riboflavin | 0.006 | -0.002 | 0.779 | 0.506 | 14.792 | 0.000 | 0.028 | 0.813 | 0.331 | 0.290 | 0.063 | 0.298 |
8 | Folic Acid | 0.01 | 0.002 | 1.247 | 0.293 | 51.608 | 0.066 | -1.006 | 0.543 | -1.736 | 0.693 | 1.616 | 0.059 |
9 | Calcium | 0.009 | 0.001 | 1.165 | 0.323 | 10.961 | 0.068 | -0.195 | 0.583 | -0.443 | 0.638 | 0.332 | 0.069 |
10 | Iron | 0.009 | 0.001 | 1.18 | 0.317 | 29.281 | 0.084 | -0.485 | 0.628 | -1.11 | 0.677 | 0.951 | 0.066 |
11 | Magnesium | 0.009 | 0.001 | 1.162 | 0.324 | 49.373 | 0.102 | -0.844 | 0.636 | -1.793 | 0.705 | 1.686 | 0.067 |
12 | Zinc | 0.009 | 0.001 | 1.180 | 0.317 | 25.972 | 0.102 | -0.382 | 0.683 | -0.841 | 0.736 | 0.899 | 0.063 |
BMI | Body Mass Index |
NAR | Nutrient Adequacy Ratio |
SES | Socioeconomic Status/Scale |
IFCT | Indian Food Composition Tables |
ICMR-NIN | Indian Council of Medical Research-National Institute of Nutrition |
| [1] | Ahirwar, A. K., Gautam, R. K. Nutritional status among school-going boys and girls (5–17 years) of Bharia Tribe (PVTG) of Patalkot, District Chhindwara (M. P.), India. Human Biology Review. 2017, 6(4), 346–358. |
| [2] | Kumar, D., Kumar, V., Tirkey, A. Assessment of health aspects of tribal adolescent girls in India's most populous tribal state: A two-decadal review. International Journal of Health Sciences and Research. 2023, 13, 150–158. |
| [3] | Rao, K. M., Balakrishna, N. N., Laxmaiah, A. A., Venkaiah, K. K., Brahmam, G. N. V. Diet and nutritional status of adolescent tribal population in nine states of India. Asia Pacific Journal of Clinical Nutrition. 2006, 15(1), 64–71. |
| [4] | Mandal, I., Hossain, S. R. Update of modified Kuppuswamy scale for the year 2024. International Journal of Community Medicine and Public Health. 2024, 11(7), 2945–2946. |
| [5] | Longvah, T., Ananthan, R., Bhaskarachary, K., Venkaiah, K. Indian Food Composition Tables. National Institute of Nutrition, Indian Council of Medical Research: Hyderabad, India, 2017. |
| [6] | National Institute of Nutrition, ICMR. Nutrient Requirements and Recommended Dietary Allowances for Indians. Report of Expert Group, Indian Council of Medical Research: Hyderabad, India, 2024, 1–334. |
| [7] | Vispute, S., Mandlik, R., Sanwalka, N., Gondhalekar, K., Khadilkar, A. Dietary diversity and food variety scores and their association with nutrition and health status of Indian children and adolescents: A multicenter study. Nutrition. 2023, 111, 112039. |
| [8] | Ravula, P., Pramanik, S., Kasala, K., Selvaraj, A. Nutritional Dynamics of Adolescent Girls in Selected Tribal Regions of Telangana, India. Research Report; International Crops Research Institute for the Semi-Arid Tropics (ICRISAT): Patancheru, India, n.d. |
| [9] | Kumar, V., Basu, D., Reddy, B. M. Genetic heterogeneity in northeastern India: Reflection of tribe–caste continuum in the genetic structure. American Journal of Human Biology. 2004, 16(3), 334–345. |
| [10] | Ghosh-Jerath, S., Singh, A., Bhattacharya, A., Ray, S., Yunus, S., Zodpey, S. Dimensions of nutritional vulnerability: Assessment of women and children in Sahariya tribal community of Madhya Pradesh in India. Indian Journal of Public Health. 2013, 57(4), 260–267. |
| [11] | Mitra, M., Kumar, P., Chakrabarty, S., Bharati, P. Nutritional status of Kamar tribal children in Chhattisgarh. The Indian Journal of Pediatrics. 2007, 74(4), 381–384. |
| [12] | Sanap, S., Jadhav, V. A study on the body mass index of adolescent girls of Gond Madia community of Gadchiroli district. International Journal of Home Science. 2017, 3(1), 164–166. |
| [13] | Narayanappa, D., Rajani, H. S., Kumar, K. N., Manjunath, V. G. Nutritional and health status of Jenukuruba tribal children in Mysore district. Pediatric Review: International Journal of Pediatric Research. 2015, 2(4), 113–119. |
| [14] | Agrawal, M., Nagar, P., Jain, D. Health and nutritional profile of adolescent girls from underprivileged communities residing in Kasturba Gandhi Balika Vidyalaya in Rajasthan. Asian Journal of Dairy and Food Research. 2018, 37(3), 237–241. |
| [15] | Neog, N., Baroova, B. Nutritional status of adolescent girls irrespective of socio-economic and ethnic background of Jorhat district, Assam. Food Science Research Journal. 2010, 1(2), 130–133. |
| [16] | Malhotra, A., Passi, S. J. Diet quality and nutritional status of rural adolescent girl beneficiaries of ICDS in North India. Asia Pacific Journal of Clinical Nutrition. 2007, 16(Suppl 1), 8. |
| [17] | Jani, R., Salian, N., Udipi, S., Ghugre, P., Lohia, N., Haas, J., Boy, E. Folate status and intake of tribal Indian adolescents aged 10 to 17 years. Food and Nutrition Bulletin. 2015, 36(1), 14–23. |
| [18] | Joshi, D., Raghav, P. K. Food intake of tribes in Rajasthan: A review. The Pharma Innovation Journal. 2019, 8(6), 753–756. |
| [19] | Kaur, T., Kaur, M. Anaemia: A health burden among rural adolescent girls in District Karnal—Prevalence and correlates. International Research Journal of Biological Sciences. 2015, 4(7), 34–41. |
| [20] | Cashman, K., Kehoe, L., Kearney, J., McNulty, B., Walton, J., Flynn, A. Adequacy of calcium and vitamin D nutritional status in a nationally representative sample of Irish teenagers aged 13–18 years. European Journal of Nutrition. 2022, 61, 3625–3636. |
| [21] | Jan, S. Impact of dietary intervention program on nutritional knowledge of adolescent girls in Srinagar city of Jammu and Kashmir. South India Journal of Social Sciences. 2024, 22(1), 105. |
APA Style
Surpande, M., Sharma, R. (2026). Age, Socioeconomic Status and BMI Are Poor Predictors of Nutrient Adequacy Among Tribal Adolescent Girls of Central India. International Journal of Nutrition and Food Sciences, 15(3), 104-111. https://doi.org/10.11648/j.ijnfs.20261503.12
ACS Style
Surpande, M.; Sharma, R. Age, Socioeconomic Status and BMI Are Poor Predictors of Nutrient Adequacy Among Tribal Adolescent Girls of Central India. Int. J. Nutr. Food Sci. 2026, 15(3), 104-111. doi: 10.11648/j.ijnfs.20261503.12
@article{10.11648/j.ijnfs.20261503.12,
  author = {Meenakshi Surpande and Rekha Sharma},
  title = {Age, Socioeconomic Status and BMI Are Poor Predictors of Nutrient Adequacy Among Tribal Adolescent Girls of Central India},
  journal = {International Journal of Nutrition and Food Sciences},
  volume = {15},
  number = {3},
  pages = {104-111},
  doi = {10.11648/j.ijnfs.20261503.12},
  url = {https://doi.org/10.11648/j.ijnfs.20261503.12},
  eprint = {https://article.sciencepublishinggroup.com/pdf/10.11648.j.ijnfs.20261503.12},
  abstract = {Nutritional deficiencies among tribal adolescent girls remain a significant public health concern in India. This study assessed the anthropometric status and dietary nutrient adequacy of 383 tribal adolescent girls aged 13–18 years, purposively selected from four Ashram Shalas in Nagpur District, Maharashtra. Demographic profile was recorded using a structured questionnaire. Anthropometric measurements (height and weight) were recorded using standard procedures, and BMI was computed. Dietary intake was assessed by the 24-hour recall method, and nutrient adequacy ratios (NAR) were calculated and compared with ICMR-NIN Estimated Average Requirements (EAR) 2024 references. Results showed that the majority belonged to the Upper Lower class (73.8%) and the overall mean BMI of 18.39 kg/m2 indicated borderline nutritional vulnerability. The mean NAR showed that energy adequacy was critically low (35.11%), with calcium (17.55%), riboflavin (16.78%), and Vitamin D (4.37%) being the most deficient. Vitamin C (34.20%), Vitamin A (34.36%), and iron (45.84%) also showed substantial inadequacy. Thiamine (55.62%) and zinc (43.74%) were moderately deficient. The adequacy of protein (88.82%), magnesium (88.71%), and folate (85.85%) were adequate. Energy intake was critically low in 97.91% of participants, while protein adequacy was relatively better (76.24%). All subjects had low intakes of Vitamins A, D, riboflavin, and calcium across all age groups. Linear regression revealed that age, socioeconomic status, and BMI were collectively poor predictors of nutrient adequacy (R2<0.01), suggesting unmeasured factors such as dietary diversity and food security are more influential determinants. These findings highlight an urgent need for targeted nutritional interventions for tribal adolescent girls in this region.},
 year = {2026}
}
TY  - JOUR
T1  - Age, Socioeconomic Status and BMI Are Poor Predictors of Nutrient Adequacy Among Tribal Adolescent Girls of Central India
AU  - Meenakshi Surpande
AU  - Rekha Sharma
Y1  - 2026/05/14
PY  - 2026
N1  - https://doi.org/10.11648/j.ijnfs.20261503.12
DO  - 10.11648/j.ijnfs.20261503.12
T2  - International Journal of Nutrition and Food Sciences
JF  - International Journal of Nutrition and Food Sciences
JO  - International Journal of Nutrition and Food Sciences
SP  - 104
EP  - 111
PB  - Science Publishing Group
SN  - 2327-2716
UR  - https://doi.org/10.11648/j.ijnfs.20261503.12
AB  - Nutritional deficiencies among tribal adolescent girls remain a significant public health concern in India. This study assessed the anthropometric status and dietary nutrient adequacy of 383 tribal adolescent girls aged 13–18 years, purposively selected from four Ashram Shalas in Nagpur District, Maharashtra. Demographic profile was recorded using a structured questionnaire. Anthropometric measurements (height and weight) were recorded using standard procedures, and BMI was computed. Dietary intake was assessed by the 24-hour recall method, and nutrient adequacy ratios (NAR) were calculated and compared with ICMR-NIN Estimated Average Requirements (EAR) 2024 references. Results showed that the majority belonged to the Upper Lower class (73.8%) and the overall mean BMI of 18.39 kg/m2 indicated borderline nutritional vulnerability. The mean NAR showed that energy adequacy was critically low (35.11%), with calcium (17.55%), riboflavin (16.78%), and Vitamin D (4.37%) being the most deficient. Vitamin C (34.20%), Vitamin A (34.36%), and iron (45.84%) also showed substantial inadequacy. Thiamine (55.62%) and zinc (43.74%) were moderately deficient. The adequacy of protein (88.82%), magnesium (88.71%), and folate (85.85%) were adequate. Energy intake was critically low in 97.91% of participants, while protein adequacy was relatively better (76.24%). All subjects had low intakes of Vitamins A, D, riboflavin, and calcium across all age groups. Linear regression revealed that age, socioeconomic status, and BMI were collectively poor predictors of nutrient adequacy (R2<0.01), suggesting unmeasured factors such as dietary diversity and food security are more influential determinants. These findings highlight an urgent need for targeted nutritional interventions for tribal adolescent girls in this region.
VL  - 15
IS  - 3
ER  -
Post Graduate Teaching Department of Home Science, Rashtrasant Tukadoji Maharaj Nagpur University, Nagpur, India
Biography: Meenakshi Surpande is Assistant Professor in Food Science and Nutrition in Department of Home Science Rashtrasant Tukadoji Maharaj Nagpur University, Nagpur Maharashtra. She has teaching experience of 13 years at Post Graduate level in Advanced Food Science in Food Science and Nutrition. She has experience of research in nutrition and product development. She has guided students for their dissertation and research projects. She has published and presented papers in National and International journals. She has attended and participated in many national and international conferences, seminars, webinars and workshops. She is life member of Nutrition society of India Nagpur Chapter.
Research Fields: Product development, Nutritional Status Studies.

UGC- Malviya Mission Teaching Centre, Rashtrasant Tukadoji Maharaj Nagpur University, Nagpur, India
Biography: Rekha Sharma is a Former Professor at the UGC-Malviya Mission Teacher Training Centre, Rashtrasant Tukadoji Maharaj Nagpur University, with a PhD in Foods and Nutrition. She has published 72 research papers in national and international journals, presented 16 papers at conferences (four of which received best research paper awards), and authored three acclaimed books on “Wheat Germ; Functional Foods and Nutraceuticals; and Millets-Sustainable Grain for a Healthy Future’. Nine of her students have earned PhDs, and she launched an online course on Functional Foods and Nutraceuticals through the SWAYAM portal of the Government of India, which was opted for by about 18000+ learners across the world.
Research Fields: Nutrition education, maternal and child nutrition, functional foods and nutraceuticals, geriatric nutrition, adolescent nutrition, traditional nutritional knowledge, product development.

Information