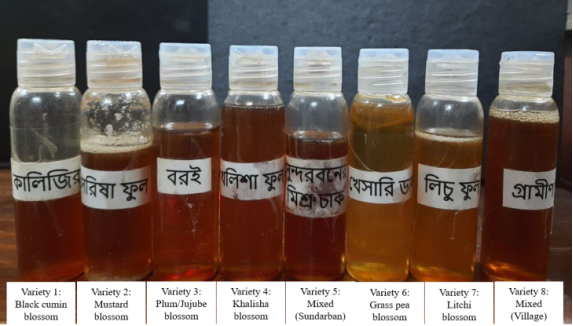
Honey, a natural product of honeybees, boasts a complex composition that varies greatly depending on its floral source. Its therapeutic and antimicrobial activity can be attributed to its rich nutritive composition, including sugars, amino acids, vitamins, minerals, and bioactive compounds like phenolics, flavonoids, and hydrogen peroxide. This study delves into the nutritional values of various types of honey, emphasizing the significance of understanding their unique compositions and potential therapeutic properties associated with diverse floral sources. The study encompassed eight different honey varieties, including monofloral and polyfloral types, and scrutinized their proximate composition, dietary elements, and nutritional factors. The results revealed that among the honeys, Khalisha blossom honey boasts the highest carbohydrate content at 78.18%, with protein levels ranging from 0.30% to 0.95% and no fat particles detected. Additionally, the energy content ranged from 293 to 316 kcal per 100 grams of honey. Overall, Khalisha blossom honey emerged as the honey variety with the highest nutritional value, exhibiting its potential as a robust and healthy food choice for the country people. Furthermore, the research highlights notable differences in nutritional composition when compared to honey from other regions, such as Africa, Asia, and Europe, particularly in terms of carbohydrate, moisture, and vitamin content. This analysis is pivotal for understanding the unique nutritional and therapeutic attributes of Bangladeshi honey varieties, promoting informed dietary choices, and advocating for standardized quality assurance practices.
| Published in | International Journal of Nutrition and Food Sciences (Volume 14, Issue 1) |
| DOI | 10.11648/j.ijnfs.20251401.15 |
| Page(s) | 42-50 |
| Creative Commons |
This is an Open Access article, distributed under the terms of the Creative Commons Attribution 4.0 International License (http://creativecommons.org/licenses/by/4.0/), which permits unrestricted use, distribution and reproduction in any medium or format, provided the original work is properly cited. |
| Copyright |
Copyright © The Author(s), 2025. Published by Science Publishing Group |
Floral Honey, Nutritional Factor, Proximate Composition, Minerals
Variety No | Moisture (%) | Ash (%) | Protein (%) | Carbohydrate (%) | Dietary Fiber (%) | Energy (kcal) |
|---|---|---|---|---|---|---|
1 | 14.180.02 | 0.860.21 | 0.600.12 | 73.780.05 | 0.150.01 | 297.52 |
2 | 15.670.01 | 0.910.09 | 0.480.02 | 74.800.03 | 0.280.05 | 301.12 |
3 | 14.580.12 | 0.730.12 | 0.250.21 | 75.270.12 | 0.170.04 | 302.08 |
4 | 12.560.09 | 1.80.13 | 0.950.14 | 78.180.10 | 0.210.02 | 316.52 |
5 | 13.340.13 | 0.620.15 | 0.670.11 | 77.930.09 | 0.260.03 | 314.40 |
6 | 15.400.15 | 0.650.18 | 0.300.02 | 72.900.08 | 0.120.01 | 292.80 |
7 | 16.750.09 | 0.900.16 | 0.880.02 | 72.500.07 | 0.170.03 | 293.52 |
8 | 15.560.16 | 0.740.19 | 0.520.19 | 77.520.15 | 0.110.01 | 312.16 |
Variety No | Reducing Sugar (%) | Glucose (%) | Amylose (%) |
|---|---|---|---|
1 | 65.880.01 | 36.300.02 | 0.670.02 |
2 | 61.670.01 | 34.530.04 | 0.560.05 |
3 | 66.200.02 | 32.760.05 | 0.590.01 |
4 | 68.050.01 | 32.670.08 | 0.430.06 |
5 | 63.170.03 | 36.980.03 | 0.670.03 |
6 | 60.900.01 | 35.780.08 | 0.720.02 |
7 | 64.550.02 | 38.660.07 | 0.690.07 |
8 | 63.060.01 | 37.790.02 | 0.640.02 |
Variety No | Calcium (mg/100g) | Iron (mg/100g) | Phosphorus (mg/100g) | Ascorbic acid (mg/100g) |
|---|---|---|---|---|
1 | 18.42 | 1.53 | 9.49 | 0.56 |
2 | 15.83 | 1.65 | 11.23 | 0.85 |
3 | 21.25 | 0.76 | 8.67 | 1.17 |
4 | 16.96 | 2.86 | 8.33 | 0.69 |
5 | 18.95 | 2.21 | 13.35 | 1.02 |
6 | 12.68 | 0.67 | 10.15 | 0.92 |
7 | 17.24 | 1.58 | 7.52 | 1.21 |
8 | 15.52 | 2.45 | 8.26 | 0.75 |
TCA | Trichloroacetic Acid |
BSA | Bovine Serum Albumin |
| [1] | Akter, T., Akther, S., Sultana, S., Jhorna, J. A., & Begum, S. (2019). The bees (Apocrita: Hymenoptera) of Dhaka city, Bangladesh. Journal of Biodiversity Conservation and Bioresource Management, 5(1), 113-120. |
| [2] | Islam, Md Nazrul & Billah, Md Morsaline & Rahman, Md & Hossain, Md & Rahman, Khandkar- Siddikur. (2023). Life and Livelihood of the Honey Collectors in the Sundarbans Mangrove Forest, Bangladesh: A Qualitative Investigation. |
| [3] | Saha, J. C. H. (2003, August). Beekeeping for rural development, its potentiality and beekeeping against poverty-Bangladesh perspective. In Proceedings of the 38th Congress Apimondia. Apimondia. |
| [4] | Rumman, S., Reybroeck, W., & Islam, T. (2021). Precision apiculture in Bangladesh: opportunities and challenges. Ecology Journal, 3(2), 193. |
| [5] | Omoya FO, Akharaiyi FC. A pasture honey trial for antibacterial potency on some selected pathogenic bacteria. Journal of Natural Products. 2010; 3: 05-11. |
| [6] | Surendra RJ. Honey in Nepal Approach, Strategy and Intervention for Subsector Promotion. Deutsche Gesellschaft für Technische Zusammenarbeit (GTZ) GmbH, German Technical Cooperation/Private Sector Promotion-Rural Finance Nepal (GTZ/PSP-RUFIN), 2008. |
| [7] | Cantarelli MA, Pellerano RG, Marchevsky EJ, Camina JM. Quality of honey from Argentina: study of chemical composition and trace elements. The Journal of the Argentine Chemical Society. 2008; 96: 33–41. |
| [8] | Ebenezer IO, Olubenga MT. Pollen characterization of honey samples from North Central Nigeria. Journal of Biological Sciences. 2010; 10: 43-47. |
| [9] | James OO, Mesubi MA, Usman LA, Yeye SO, Ajanaku KO. Physical characteristics of some honey samples from North-Central Nigeria. International Journal of Physical Sciences. 2009; 4: 464-470. |
| [10] | Alvarez-Suarez, J. M., Tulipani, S., Romandini, S., Bertoli, E., & Battino, M. (2010). Contribution of honey in nutrition and human health: a review. Mediterranean Journal of Nutrition and Metabolism, 3, 15-23. |
| [11] | Bogdanov S, Jurendic T, Sieber R, Gallmann P. Honey for nutrition and health: a review. J Am Coll Nutr. 2008 Dec; 27(6): 677-89. |
| [12] | Bobis, O., Marghitas, L., Bonta, V., Dezmirean, D., & Maghear, O. (2007). Free phenolic acids, flavonoids and abscisic acid related to HPLC sugar profile in acacia honey. Buletin USAMV-CN, 64(2007), 179-185. |
| [13] | AOAC. Official Methods of Analysis, 18th ed. Association of Official Analytical Chemists. Washington, D. C, 2004. |
| [14] | AOAC. Official Methods of Analysis, 17th ed. Association of Official Analytical Chemists. Washington, D. C, 1990. |
| [15] | Vogel, A. I., 1978. Vogel’s Text book of Quantitative inorganic analysis (4th Ed.) Longman Group limited, England, pp: 741. |
| [16] |
Food Data Central. (n.d.).
https://fdc.nal.usda.gov/fdc-app.html#/food-details/169640/nutrients |
| [17] | Erejuwa OO, Sulaiman SA, Wahab MS. Honey--a novel antidiabetic agent. Int J Biol Sci. 2012; 8(6): 913-34. |
| [18] | Iftikhar, A., Nausheen, R., Khurshid, M., Iqbal, R. K., Muzaffar, H., Malik, A., Khan, A. A., Batool, F., Akhtar, S., Yasin, A., & Anwar, H. (2023). Pancreatic regenerative potential of manuka honey evidenced through pancreatic histology and levels of transcription factors in diabetic rat model. Heliyon, 9(9), e20017. |
| [19] | Tomczyk, Monika & Czernicka, Maria & Dzugan, Malgorzata. (2019). The influence of geographical origin on honey composition studied by Polish and Slovak honeys. Czech Journal of Food Sciences. 37. 232-238. |
| [20] | J. Ndife, L. Abioye, M. Dandago, Quality Assessment of Nigerian Honey Sourced from Different Floral Locations, Nigerian Food Journal, Volume 32, Issue 2, 2014. |
| [21] | Chua, Lee Suan & Adnan, Nur. (2014). Biochemical and nutritional components of selected honey samples. Acta scientiarum polonorum. Technologia alimentaria. 13. 169-79. |
| [22] | Reda Nemo, Ketema Bacha, Microbial quality, physicochemical characteristics, proximate analysis, and antimicrobial activities of honey from Anfilo district, Food Bioscience, Volume 42, 2021. |
| [23] | Conti, M. E., Stripeikis, J., Campanella, L., Cucina, D., & Tudino, M. B. (2007). Characterization of Italian honeys (Marche Region) on the basis of their mineral content and some typical quality parameters. Chemistry Central Journal, 1, 1-10. |
| [24] | Bouddine, T., Laaroussi, H., Bakour, M., Guirrou, I., Khallouki, F., Mazouz, H.,... & Hajji, L. (2022). Organic honey from the Middle Atlas of Morocco: physicochemical parameters, antioxidant properties, pollen spectra, and sugar profiles. Foods, 11(21), 3362. |
| [25] | Cantarelli, M. A., Pellerano, R. G., Marchevsky, E. J., & Camiña, J. M. (2008). Quality of honey from Argentina: Study of chemical composition and trace elements. The Journal of Argentine Chemical Society, 96(1-2), 33-41. |
| [26] | Zhu, M., Zhao, H., Wang, Q., Wu, F., & Cao, W. (2020). A novel Chinese honey from Amorpha fruticosa L.: Nutritional composition and antioxidant capacity in vitro. Molecules, 25(21), 5211. |
| [27] | Alshammari, Ghedeir & Ahmed, Mohammed Asif & Alsulami, Tawfiq & Hakeem, Mohammed & Ibraheem, Mohamed & Al-Nouri, Doha. (2022). Phenolic Compounds, Antioxidant Activity, Ascorbic Acid, and Sugars in Honey from Ingenious Hail Province of Saudi Arabia. Applied Sciences. 12. 8334. |
| [28] | Dobrinas, S., Matei, N., Soceanu, A., Birghila, S., & Popescu, V. (2006). Estimation of vitamin C and Cd, Cu, Pb content in honey and propolis. Scientific Study and Research, 7(1), 729-734. |
| [29] | Akharaiyi, Fred Coolborn, and Helen Adetoun Lawal. "Physicochemical analysis and mineral contents of honey from farmers in western states of Nigeria." J. Nat. Sci. Res 6 (2016): 19. |
| [30] | Yuan, Y., Ren, C., Deng, M., Zhao, T., Liao, Y., Ren, R.,... & Wang, Y. (2024). Multi-parameter joint analysis of the quality of honey. Frontiers in Sustainable Food Systems, 8, 1359384. |
| [31] | Obiegbuna, J. E., Osajiele, B. O., & Ishiwu, C. N. (2017). Quality evaluation of awka market honey and honey from beekeepers in two floral regions of Anambra State, Nigeria. American Journal of Food Science and Technology, 5(4), 149-155. |
| [32] | Uršulin-Trstenjak, N., Levanić, D., Primorac, L., Bošnir, J., Vahčić, N., & Šarić, G. (2015). Mineral profile of Croatian honey and differences due to its geographical origin. Czech journal of food sciences, 33(2). |
APA Style
Hasan, M., Sakib, S. A., Islam, M. M. T., Haque, M. E. (2025). A Comprehensive Analysis on Nutritional Composition of Floral Honeys Commonly Available in Bangladesh. International Journal of Nutrition and Food Sciences, 14(1), 42-50. https://doi.org/10.11648/j.ijnfs.20251401.15
ACS Style
Hasan, M.; Sakib, S. A.; Islam, M. M. T.; Haque, M. E. A Comprehensive Analysis on Nutritional Composition of Floral Honeys Commonly Available in Bangladesh. Int. J. Nutr. Food Sci. 2025, 14(1), 42-50. doi: 10.11648/j.ijnfs.20251401.15
@article{10.11648/j.ijnfs.20251401.15,
  author = {Mahmudul Hasan and Sheikh Adnan Sakib and M. M. Towhidul Islam and Md. Enamul Haque},
  title = {A Comprehensive Analysis on Nutritional Composition of Floral Honeys Commonly Available in Bangladesh
},
  journal = {International Journal of Nutrition and Food Sciences},
  volume = {14},
  number = {1},
  pages = {42-50},
  doi = {10.11648/j.ijnfs.20251401.15},
  url = {https://doi.org/10.11648/j.ijnfs.20251401.15},
  eprint = {https://article.sciencepublishinggroup.com/pdf/10.11648.j.ijnfs.20251401.15},
  abstract = {Honey, a natural product of honeybees, boasts a complex composition that varies greatly depending on its floral source. Its therapeutic and antimicrobial activity can be attributed to its rich nutritive composition, including sugars, amino acids, vitamins, minerals, and bioactive compounds like phenolics, flavonoids, and hydrogen peroxide. This study delves into the nutritional values of various types of honey, emphasizing the significance of understanding their unique compositions and potential therapeutic properties associated with diverse floral sources. The study encompassed eight different honey varieties, including monofloral and polyfloral types, and scrutinized their proximate composition, dietary elements, and nutritional factors. The results revealed that among the honeys, Khalisha blossom honey boasts the highest carbohydrate content at 78.18%, with protein levels ranging from 0.30% to 0.95% and no fat particles detected. Additionally, the energy content ranged from 293 to 316 kcal per 100 grams of honey. Overall, Khalisha blossom honey emerged as the honey variety with the highest nutritional value, exhibiting its potential as a robust and healthy food choice for the country people. Furthermore, the research highlights notable differences in nutritional composition when compared to honey from other regions, such as Africa, Asia, and Europe, particularly in terms of carbohydrate, moisture, and vitamin content. This analysis is pivotal for understanding the unique nutritional and therapeutic attributes of Bangladeshi honey varieties, promoting informed dietary choices, and advocating for standardized quality assurance practices.
},
 year = {2025}
}
TY  - JOUR
T1  - A Comprehensive Analysis on Nutritional Composition of Floral Honeys Commonly Available in Bangladesh

AU  - Mahmudul Hasan
AU  - Sheikh Adnan Sakib
AU  - M. M. Towhidul Islam
AU  - Md. Enamul Haque
Y1  - 2025/02/07
PY  - 2025
N1  - https://doi.org/10.11648/j.ijnfs.20251401.15
DO  - 10.11648/j.ijnfs.20251401.15
T2  - International Journal of Nutrition and Food Sciences
JF  - International Journal of Nutrition and Food Sciences
JO  - International Journal of Nutrition and Food Sciences
SP  - 42
EP  - 50
PB  - Science Publishing Group
SN  - 2327-2716
UR  - https://doi.org/10.11648/j.ijnfs.20251401.15
AB  - Honey, a natural product of honeybees, boasts a complex composition that varies greatly depending on its floral source. Its therapeutic and antimicrobial activity can be attributed to its rich nutritive composition, including sugars, amino acids, vitamins, minerals, and bioactive compounds like phenolics, flavonoids, and hydrogen peroxide. This study delves into the nutritional values of various types of honey, emphasizing the significance of understanding their unique compositions and potential therapeutic properties associated with diverse floral sources. The study encompassed eight different honey varieties, including monofloral and polyfloral types, and scrutinized their proximate composition, dietary elements, and nutritional factors. The results revealed that among the honeys, Khalisha blossom honey boasts the highest carbohydrate content at 78.18%, with protein levels ranging from 0.30% to 0.95% and no fat particles detected. Additionally, the energy content ranged from 293 to 316 kcal per 100 grams of honey. Overall, Khalisha blossom honey emerged as the honey variety with the highest nutritional value, exhibiting its potential as a robust and healthy food choice for the country people. Furthermore, the research highlights notable differences in nutritional composition when compared to honey from other regions, such as Africa, Asia, and Europe, particularly in terms of carbohydrate, moisture, and vitamin content. This analysis is pivotal for understanding the unique nutritional and therapeutic attributes of Bangladeshi honey varieties, promoting informed dietary choices, and advocating for standardized quality assurance practices.

VL  - 14
IS  - 1
ER  -
Department of Biochemistry and Molecular Biology, University of Dhaka, Dhaka, Bangladesh
Deptment of Pharmacy, State University of Bangladesh, Dhaka, Bangladesh
Department of Biochemistry and Molecular Biology, University of Dhaka, Dhaka, Bangladesh
Department of Biochemistry and Molecular Biology, University of Dhaka, Dhaka, Bangladesh
Information