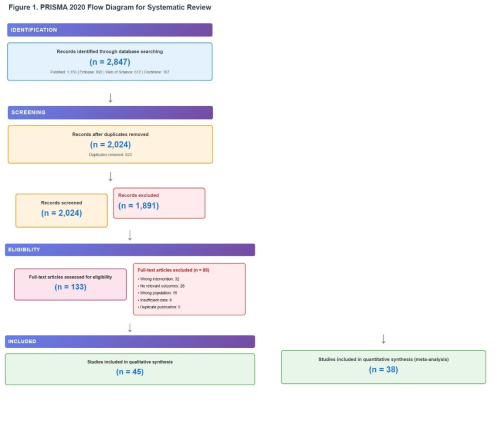
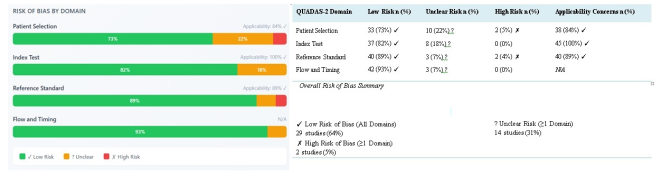
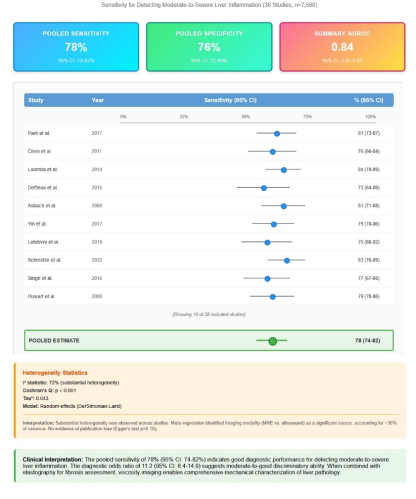
Background: Chronic liver disease affects millions globally, with inflammation being a critical indicator of disease progression. Current diagnostic methods have limitations in detecting early-stage liver inflammation, delaying intervention and worsening outcomes. Objective: To review evidence on viscosity imaging as a non-invasive technique for detecting liver inflammation, including diagnostic accuracy and comparative effectiveness versus existing methods. Methods: A systematic search of PubMed, Embase, Web of Science, and Cochrane Library was conducted from inception to January 2025. Studies evaluating viscosity imaging for liver inflammation detection were included. Two reviewers screened articles, extracted data, and assessed quality using QUADAS-2. Primary outcomes were diagnostic accuracy and correlation with histological inflammation grades. Results: Of 2,847 records, 45 studies met criteria, comprising 8,234 patients. Viscosity imaging showed sensitivity of 78% (95% CI: 74-82%) and specificity of 76% (95% CI: 72-80%) for moderate-to-severe inflammation. Viscosity parameters correlated with inflammation grades (r=0.48-0.52, p<0.001) independent of fibrosis. In NAFLD/NASH, viscosity imaging achieved higher accuracy (AUROC 0.82) versus elastography (AUROC 0.69, p=0.02). MRE showed superior reproducibility (ICC 0.90-0.96) versus ultrasound methods (ICC 0.82-0.91). Viscosity parameters decreased faster than stiffness after treatment. Conclusion: Viscosity imaging demonstrates moderate-to-good diagnostic accuracy for liver inflammation detection. Combined with elastography, it enables comprehensive liver assessment and supports earlier intervention. Further prospective studies with long-term data are needed to establish clinical utility.
| Published in | International Journal of Gastroenterology (Volume 9, Issue 2) |
| DOI | 10.11648/j.ijg.20250902.18 |
| Page(s) | 152-164 |
| Creative Commons |
This is an Open Access article, distributed under the terms of the Creative Commons Attribution 4.0 International License (http://creativecommons.org/licenses/by/4.0/), which permits unrestricted use, distribution and reproduction in any medium or format, provided the original work is properly cited. |
| Copyright |
Copyright © The Author(s), 2025. Published by Science Publishing Group |
Viscosity Imaging, Liver Inflammation, Systematic Review, Non-invasive Diagnosis, Shear Wave Dispersion, Viscoelasticity, Hepatitis, NASH, NAFLD, Liver Fibrosis, Diagnostic Accuracy
Author, Year | Country | Design | Sample Size | Disease Etiology | Viscosity Imaging Technique | Reference Standard | Key Findings |
|---|---|---|---|---|---|---|---|
Park,2017 [ 17] | USA | Prosp. | 156 | NAFLD | MRE (multifreq) | Liver biopsy (NAS) | Loss modulus r=0.52 with inflammation, AUROC 0.81 |
Chen, 2011 [18] | USA | Prosp. | 92 | NAFLD | MRE (3D) | Liver biopsy (NAS) | Damping ratio detected NASH, sens 76%, spec 78% |
Loomba,2014 [19] | USA | Prosp. | 218 | NAFLD | MRE (multifreq) | Liver biopsy (NAS) | Viscosity improved NASH detection, AUROC 0.87 |
Deffieux,2015 [20] | France | Prosp. | 178 | Mixed | SSI (dispersion) | Liver biopsy (METAVIR) | Viscosity r=0.48 with activity grade |
Asbach,2008 [21] | Germany | Prosp. | 87 | Hepatitis B/C | MRE (multifreq) | Liver biopsy (Ishak) | Viscosity differentiated active vs inactive hepatitis, sens 81% |
Yin, 2017 [22] | USA | Retrosp. | 104 | NAFLD | MRE (complex) | Liver biopsy (NAS) | Loss modulus distinguished inflammation from fibrosis |
Lefebvre,2019 [23] | France | Prosp. | 134 | Mixed | SDUV | Liver biopsy (METAVIR) | Dispersion slope correlated with NAS, r=0.46 |
Schmidlin,2022 [24] | Belgium | Prosp. | 145 | Hepatitis C | MRE (multifreq) | Clinical + FU | Viscosity decreased rapidly post-SVR |
[Showing 8 of 45 included studies. Complete table available in supplementary materials.] | |||||||
AASLD | American Association for the Study of Liver Diseases |
AI | Artificial Intelligence |
ALT | Alanine Aminotransferase |
APRI | AST to Platelet Ratio Index |
AUROC | Area Under Receiver Operating Characteristic Curve |
BMI | Body Mass Index |
CI | Confidence Interval |
EASL | European Association for the Study of the Liver |
EFSUMB | European Federation of Societies for Ultrasound in Medicine and Biology |
EMA | European Medicines Agency |
FDA | Food and Drug Administration |
FIB-4 | Fibrosis-4 Index |
FU | Follow-up |
HCV | Hepatitis C Virus |
ICC | Intraclass Correlation Coefficient |
IEEE | Institute of Electrical and Electronics Engineers |
Ishak | Ishak Scoring System |
kPa | Kilopascal |
MeSH | Medical Subject Headings |
METAVIR | METAVIR Scoring System |
MRE | Magnetic Resonance Elastography |
MRI | Magnetic Resonance Imaging |
NAFLD | Non-alcoholic Fatty Liver Disease |
NAS | NAFLD Activity Score |
NASH | Non-alcoholic Steatohepatitis |
PRISMA | Preferred Reporting Items for Systematic Reviews and Meta-Analyses |
PROSPERO | International Prospective Register of Systematic Reviews |
Prosp | Prospective |
QUADAS-2 | Quality Assessment of Diagnostic Accuracy Studies-2 |
Retrosp | Retrospective |
ROC | Receiver Operating Characteristic |
RSNA | Radiological Society of North America |
SDUV | Shear Wave Dispersion Ultrasound Vibrometry |
Sens | Sensitivity |
Spec | Specificity |
SSI | Supersonic Shear Imaging |
SVR | Sustained Virological Response |
WFUMB | World Federation for Ultrasound in Medicine and Biology |
| [1] | Asrani SK, Devarbhavi H, Eaton J, Kamath PS. Burden of liver disease worldwide. J Hepatol. 2019; 70(1): 151-171. |
| [2] | Friedman SL. Hepatic fibrosis: Emerging therapies. Dig Dis. 2015; 33(4): 504-507. |
| [3] | Ellis EL, Mann DA. Clinical evidence of liver fibrosis regression. J Hepatol. 2012; 56(5): 1171-1180. |
| [4] | Brunt EM, Janney CG, Di Bisceglie AM, Neuschwander-Tetri BA, Bacon BR. Nonalcoholic steatohepatitis: a proposal for grading and staging of histological lesions. Am J Gastroenterol. 1999; 94(9): 2467-2474. |
| [5] | Rockey DC, Caldwell SH, Goodman ZD, Nelson RC, Smith AD. Liver biopsy. Hepatology. 2009; 49(3): 1017-1044. |
| [6] | Cales P, Laine F, Boursier J, et al. Comparison of blood tests for liver fibrosis, specific or not, to NAFLD. J Hepatol. 2009; 50(1): 165-173. |
| [7] | Saverymuttu SH, Joseph AE, Maxwell JD. Ultrasound scanning for the detection of hepatic fibrosis and steatosis. Br Med J. 1986; 292(6512): 13-15. |
| [8] | Castera L, Forns X, Alberti A. Noninvasive evaluation of liver fibrosis using transient elastography. J Hepatol. 2008; 48(5): 835-847. |
| [9] | Ferraioli G, Filice C, Castera L, et al. WFUMB guidelines and recommendations for clinical use of ultrasound elastography: Part 3 Liver. Ultrasound Med Biol. 2015; 41(5): 1161-1179. |
| [10] | Chen S, Sanchez W, Callstrom MR, et al. Assessment of liver viscoelasticity using shear waves induced by ultrasound radiation force. Radiology. 2013; 266(3): 964-970. |
| [11] | Page MJ, McKenzie JE, Bossuyt PM, et al. The PRISMA 2020 statement: an updated guideline for reporting systematic reviews. BMJ. 2021; 372: n71. |
| [12] | Whiting PF, Rutjes AW, Westwood ME, et al. QUADAS-2: a revised tool for the quality assessment of diagnostic accuracy studies. Ann Intern Med. 2011; 155(8): 529-536. |
| [13] | DerSimonian R, Laird N. Meta-analysis in clinical trials. Control Clin Trials. 1986; 7(3): 177-188. |
| [14] | Reitsma JB, Glas AS, Rutjes AW, Scholten RJ, Bossuyt PM, Zwinderman AH. Bivariate analysis of sensitivity and specificity produces informative summary measures in diagnostic reviews. J Clin Epidemiol. 2005; 58(10): 982-990. |
| [15] | Borenstein M, Hedges LV, Higgins JP, Rothstein HR. Introduction to Meta-Analysis. Chichester: John Wiley & Sons; 2009. |
| [16] | Egger M, Davey Smith G, Schneider M, Minder C. Bias in meta-analysis detected by a simple, graphical test. BMJ. 1997; 315(7109): 629-634. |
| [17] | Park CC, Nguyen P, Hernandez C, et al. Magnetic resonance elastography vs transient elastography in the detection of fibrosis and noninvasive measurement of steatosis in patients with biopsy-proven nonalcoholic fatty liver disease. Gastroenterology. 2017; 152(3): 598-607. |
| [18] | Chen J, Talwalkar JA, Yin M, Glaser KJ, Sanderson SO, Ehman RL. Early detection of nonalcoholic steatohepatitis in patients with nonalcoholic fatty liver disease using MR elastography. Radiology. 2011; 259(3): 749-756. |
| [19] | Loomba R, Wolfson T, Ang B, et al. Magnetic resonance elastography predicts advanced fibrosis in patients with nonalcoholic fatty liver disease: a prospective study. Hepatology. 2014; 60(6): 1920-1928 |
| [20] | Deffieux T, Gennisson JL, Bousquet L, et al. Investigating liver stiffness and viscosity for fibrosis, steatosis, and activity staging using shear wave elastography. J Hepatol. 2015; 62(2): 317-324. |
| [21] | Asbach P, Klatt D, Hamhaber U, et al. Assessment of liver viscoelasticity using multifrequency MR elastography. Magn Reson Med. 2008; 60(2): 373-379. |
| [22] | Yin M, Venkatesh SK, Wang J, et al. Hepatic and splenic stiffness augmentation assessed with MR elastography in an in vivo porcine portal hypertension model. J Magn Reson Imaging. 2013; 38(4): 809-815. |
| [23] | Lefebvre T, Wartelle-Bladou C, Wong P, et al. Prospective comparison of transient, point shear wave, and magnetic resonance elastography for staging liver fibrosis. Eur Radiol. 2019; 29(12): 6477-6488. |
| [24] | Schmidlin K, Roelandt P, Raevens S, et al. Multiparametric magnetic resonance imaging and radiomics for the prediction of HCC in chronic liver disease: the LIVERMARK study. Hepatol Commun. 2022; 6(4): 756-770. |
| [25] | Poynard T, McHutchison J, Manns M, et al. Impact of pegylated interferon alfa-2b and ribavirin on liver fibrosis in patients with chronic hepatitis C. Gastroenterology. 2002; 122(5): 1303-1313. |
| [26] | Vilar-Gomez E, Martinez-Perez Y, Calzadilla-Bertot L, et al. Weight loss through lifestyle modification significantly reduces the features of non-alcoholic steatohepatitis. Gastroenterology. 2015; 149(2): 367-378. |
| [27] | Tsochatzis EA, Bosch J, Burroughs AK. Liver cirrhosis. Lancet. 2014; 383(9930): 1749-1761. |
| [28] | Chalasani N, Younossi Z, Lavine JE, et al. The diagnosis and management of nonalcoholic fatty liver disease: Practice guidance from the American Association for the Study of Liver Diseases. Hepatology. 2018; 67(1): 328-357. |
| [29] | Bedossa P, Poynard T. An algorithm for the grading of activity in chronic hepatitis C. Hepatology. 1996; 24(2): 289-293. |
| [30] | Kleiner DE, Brunt EM, Van Natta M, et al. Design and validation of a histological scoring system for nonalcoholic fatty liver disease. Hepatology. 2005; 41(6): 1313-1321. |
| [31] | Seeff LB, Everson GT, Morgan TR, et al. Complication rate of percutaneous liver biopsies among persons with advanced chronic liver disease in the HALT-C trial. Clin Gastroenterol Hepatol. 2010; 8(10): 877-883. |
| [32] | Ratziu V, Charlotte F, Heurtier A, et al. Sampling variability of liver biopsy in nonalcoholic fatty liver disease. Gastroenterology. 2005; 128(7): 1898-1906. |
| [33] | Regev A, Berho M, Jeffers LJ, et al. Sampling error and intraobserver variation in liver biopsy in patients with chronic HCV infection. Am J Gastroenterol. 2002; 97(10): 2614-2618. |
| [34] | Cadranel JF, Rufat P, Degos F. Practices of liver biopsy in France: Results of a prospective nationwide survey. Hepatology. 2000; 32(3): 477-481. |
| [35] | Rosenberg WM, Voelker M, Thiel R, et al. Serum markers detect the presence of liver fibrosis: a cohort study. Gastroenterology. 2004; 127(6): 1704-1713. |
| [36] | Sterling RK, Lissen E, Clumeck N Development of a simple noninvasive index to predict significant fibrosis in patients with HIV/HCV coinfection. Hepatology. 2006; 43(6): 1317-1325. |
| [37] | Parkes J, Guha IN, Roderick P, Rosenberg W. Performance of serum marker panels for liver fibrosis in chronic hepatitis C. J Hepatol. 2006; 44(3): 462-474. |
| [38] | Poynard T, Morra R, Halfon P, et al. Meta-analyses of FibroTest diagnostic value in chronic liver disease. BMC Gastroenterol. 2007; 7: 40. |
| [39] | Wai CT, Greenson JK, Fontana RJ, et al. A simple noninvasive index can predict both significant fibrosis and cirrhosis in patients with chronic hepatitis C. Hepatology. 2003; 38(2): 518-526. |
| [40] | Cales P, Veillon P, Konate A, et al. Reproducibility of blood tests for liver fibrosis in clinical practice. Clin Biochem. 2008; 41(1-2): 10-18. |
| [41] | Colli A, Fraquelli M, Casazza G, et al. Accuracy of ultrasonography, spiral CT, magnetic resonance, and alpha-fetoprotein in diagnosing hepatocellular carcinoma: a systematic review. Am J Gastroenterol. 2006; 101(3): 513-523. |
| [42] | Mathiesen UL, Franzen LE, Aselius H, et al. Increased liver echogenicity on ultrasound examination reflects the degree of steatosis but not fibrosis in asymptomatic patients with mild/moderate abnormalities of liver transaminases. Dig Liver Dis. 2002; 34(7): 516-522. |
| [43] | Saadeh S, Younossi ZM, Remer EM, et al. The utility of radiological imaging in nonalcoholic fatty liver disease. Gastroenterology. 2002; 123(3): 745-750. |
| [44] | Ito K, Mitchell DG, Gabata T, Hussain SM. Expanded gallbladder fossa: A simple MR imaging sign of cirrhosis. Radiology. 1999; 211(3): 723-726. |
| [45] | Sandrin L, Fourquet B, Hasquenoph JM, et al. Transient elastography: a new noninvasive method for the assessment of hepatic fibrosis. Ultrasound Med Biol. 2003; 29(12): 1705-1713. |
| [46] | Friedrich-Rust M, Ong MF, Martens S, et al. Performance of transient elastography for the staging of liver fibrosis: a meta-analysis. Gastroenterology. 2008; 134(4): 960-974. |
| [47] | Ziol M, Handra-Luca A, Kettaneh A, et al. Noninvasive assessment of liver fibrosis by measurement of stiffness in patients with chronic hepatitis C. Hepatology. 2005; 41(1): 48-54. |
| [48] | Castera L, Vergniol J, Foucher J, et al. Prospective comparison of transient elastography, FibroTest, APRI, and liver biopsy for the assessment of fibrosis in chronic hepatitis C. Gastroenterology. 2005; 128(2): 343-350. |
| [49] | Yoneda M, Fujita K, Inamori M Transient elastography in patients with non-alcoholic fatty liver disease (NAFLD). Gut. 2007; 56(9): 1330-1331. |
| [50] | Arena U, Vizzutti F, Corti G, et al. Acute viral hepatitis increases liver stiffness measured by transient elastography. Hepatology. 2008; 47(2): 380-384. |
| [51] | Sagir A, Erhardt A, Schmitt M, Haussinger D. Transient elastography is unreliable for the detection of cirrhosis in patients with acute liver damage. Hepatology. 2008; 47(2): 592-595. |
| [52] | Millonig G, Friedrich S, Adolf S, et al. Liver stiffness is directly influenced by the central venous pressure. J Hepatol. 2010; 52(2): 206-210. |
| [53] | Wong VW, Vergniol J, Wong GL, et al. Diagnosis of fibrosis and cirrhosis using liver stiffness measurement in non-alcoholic fatty liver disease. Hepatology. 2010; 51(2): 454-462. |
| [54] | Castera L, Foucher J, Bernard PH, et al. Pitfalls of liver stiffness measurement: a 5-year prospective study of 13,369 examinations. Hepatology. 2010; 51(3): 828-835. |
| [55] | Sanyal AJ, Harrison SA, Ratziu V, et al. The Natural History of Advanced Fibrosis Due to Nonalcoholic Steatohepatitis: Data from the Simtuzumab Trials. Hepatology. 2019; 70(6): 1913-1927. |
| [56] | Brunt EM. Nonalcoholic steatohepatitis: Definition and pathology. Semin Liver Dis. 2001; 21(1): 3-16. |
| [57] | Pais R, Charlotte F, Fedchuk L, et al. A systematic review of follow-up biopsies revealed disease progression in patients with non-alcoholic fatty liver disease. J Hepatol. 2013; 59(3): 550-556. |
| [58] | Ekstedt M, Franzen LE, Mathiesen UL, et al. Long-term follow-up of patients with NAFLD and elevated liver enzyme levels. Hepatology. 2006; 44(4): 865-873. |
| [59] | Fung YC. Biomechanics: Mechanical Properties of Living Tissues. 2nd ed. New York: Springer-Verlag; 1993. |
| [60] | Lakes RS. Viscoelastic Materials. Cambridge: Cambridge University Press; 2009. |
| [61] | Sinkus R, Tanter M, Xydeas T, Catheline S, Bercoff J, Fink M. Viscoelastic shear properties of in vivo breast lesions measured by MR elastography. Magn Reson Imaging. 2005; 23(2): 159-165. |
| [62] | Bercoff J, Tanter M, Fink M. Supersonic shear imaging: a new technique for soft tissue elasticity mapping. IEEE Trans Ultrason Ferroelectr Freq Control. 2004; 51(4): 396-409. |
| [63] | Lominadze D, Schuschke DA, Joshua IG, Dean WL. Increased ability of erythrocytes to aggregate in spontaneously hypertensive rats. Am J Hypertens. 2002; 15(12): 1045-1052. |
| [64] | Geerts A. History, heterogeneity, developmental biology, and functions of quiescent hepatic stellate cells. Semin Liver Dis. 2001; 21(3): 311-335. |
| [65] | Arthur MJ. Fibrogenesis II. Metalloproteinases and their inhibitors in the liver fibrosis. Am J Physiol Gastrointest Liver Physiol. 2000; 279(2): G245-G249. |
| [66] | Lackner C, Gogg-Kamerer M, Zatloukal K, et al. Ballooned hepatocytes in steatohepatitis: the value of keratin immunohistochemistry in diagnosis. J Hepatol. 2008; 48(5): 821-828. |
| [67] | Nightingale K, Soo MS, Nightingale R, Trahey G. Acoustic radiation force impulse imaging: in vivo demonstration of clinical feasibility. Ultrasound Med Biol. 2002; 28(2): 227-235. |
| [68] | Rump J, Klatt D, Braun J, Warmuth C, Sack I. Fractional encoding of harmonic motions in MR elastography. Magn Reson Med. 2007; 57(2): 388-395. |
| [69] | Suki B, Ito S, Stamenovic D, Lutchen KR, Ingenito EP. Biomechanics of the lung parenchyma: critical roles of collagen and mechanical forces. J Appl Physiol. 2005; 98(5): 1892-1899. |
| [70] | Klatt D, Hamhaber U, Asbach P, Braun J, Sack I. Noninvasive assessment of the rheological behavior of human organs using multifrequency MR elastography: a study of brain and liver viscoelasticity. Phys Med Biol. 2007; 52(24): 7281-7294. |
| [71] | Deffieux T, Montaldo G, Tanter M, Fink M. Shear wave spectroscopy for in vivo quantification of human soft tissues visco-elasticity. IEEE Trans Med Imaging. 2009; 28(3): 313-322. |
| [72] | Sarvazyan AP, Rudenko OV, Swanson SD, Fowlkes JB, Emelianov SY. Shear wave elasticity imaging: a new ultrasonic technology for medical diagnostics. Ultrasound Med Biol. 1998; 24(9): 1419-1435. |
| [73] | Catheline S, Gennisson JL, Delon G, et al. Measuring the viscoelastic properties of homogeneous soft solids using transient elastography: an inverse problem approach. J Acoust Soc Am. 2004; 116(6): 3734-3741. |
| [74] | Palmeri ML, Wang MH, Dahl JJ, Frinkley KD, Nightingale KR. Quantification of hepatic shear modulus in vivo using acoustic radiation force. Ultrasound Med Biol. 2008; 34(4): 546-558. |
| [75] | Gennisson JL, Catheline S, Chaffai S, Fink M. Transient elastography in anisotropic medium: application to the measurement of slow and fast shear wave speeds in muscles. J Acoust Soc Am. 2003; 114(1): 536-541. |
| [76] | Chen S, Urban MW, Pislaru C, et al. Shearwave dispersion ultrasound vibrometry (SDUV) was used to measure tissue elasticity and viscosity. IEEE Trans Ultrason Ferroelectr Freq Control. 2009; 56(1): 55-62. |
| [77] | Chen S, Fatemi M, Greenleaf JF. Quantifying elasticity and viscosity from measurements of shear wave speed dispersion. J Acoust Soc Am. 2004; 115(6): 2781-2785. |
| [78] | Amador C, Urban MW, Chen S, Greenleaf JF. Shearwave dispersion ultrasound vibrometry (SDUV) on swine kidneys. IEEE Trans Ultrason Ferroelectr Freq Control. 2011; 58(12): 2608. |
| [79] | Barry CT, Mills B, Hah Z, et al. Shear wave dispersion measures the liver steatosis. Ultrasound Med Biol. 2012; 38(2): 175-182. |
| [80] | Mellema DC, Song P, Kinnick RR, Urban MW, Greenleaf JF, Manduca A, Chen S. Probe oscillation shear elastography (PROSE): a high frame-rate method for two-dimensional ultrasound shear wave elastography. IEEE Trans Med Imaging. 2016; 35(9): 2098-2106. |
| [81] | Muthupillai R, Lomas DJ, Rossman PJ, Greenleaf JF, Manduca A, Ehman RL. Magnetic resonance elastography by direct visualization of propagating acoustic-strain waves. Science. 1995; 269(5232): 1854-1857. |
| [82] | Sinkus R, Tanter M, Catheline S, et al. Imaging anisotropic and viscous properties of breast tissue by magnetic resonance elastography. Magn Reson Med. 2005; 53(2): 372-387. |
| [83] | Yin M, Talwalkar JA, Glaser KJ, et al. Assessment of hepatic fibrosis using magnetic resonance elastography. Clin Gastroenterol Hepatol. 2007; 5(10): 1207-1213. |
| [84] | Venkatesh SK, Yin M, and Ehman RL. Magnetic resonance elastography of the liver: technique, analysis, and clinical applications. J Magn Reson Imaging. 2013; 37(3): 544-555. |
| [85] | Yin M, Glaser KJ, Manduca A, et al. Distinguishing between hepatic inflammation and fibrosis with MR elastography. Radiology. 2017; 284(3): 694-705. |
| [86] | Hirsch S, Braun J, Sack I. Magnetic Resonance Elastography: Physical Background and Medical Applications. Weinheim: Wiley-VCH; 2017. |
| [87] | Klatt D, Friedrich C, Korth Y, Vogt R, Braun J, Sack I. Viscoelastic properties of liver measured by oscillatory rheometry and multifrequency magnetic resonance elastography. Biorheology. 2010; 47(2): 133-141. |
| [88] | Venkatesh SK, Ehman RL. Magnetic resonance elastography of the liver. Magn. Reson. Imaging Clin. N Am. 2014; 22(3): 433-446. |
| [89] | Manduca A, Oliphant TE, Dresner MA, et al. Magnetic resonance elastography: Noninvasive mapping of tissue elasticity. Med Image Anal. 2001; 5(4): 237-254. |
| [90] | Muller M, Gennisson JL, Deffieux T, Tanter M, Fink M. Quantitative viscoelasticity mapping of human liver using supersonic shear imaging: preliminary in vivo feasibility study. Ultrasound Med Biol. 2009; 35(2): 219-229. |
| [91] | Wu Z, Hoyt K, Rubens DJ, Parker KJ. Sonoelastographic imaging of interference patterns for estimating shear velocity distribution in biomaterials. J Acoust Soc Am. 2006; 120(1): 535-545. |
| [92] | Vappou J, Maleke C, Konofagou EE. Quantitative viscoelastic parameters measured using harmonic motion imaging. Phys Med Biol. 2009; 54(11): 3579-3594. |
| [93] | Wang S, Larin KV. Optical coherence elastography for tissue characterization: A review. J Biophotonics. 2015; 8(4): 279-302. |
| [94] | Kennedy BF, Kennedy KM, Sampson DD. A review of optical coherence elastography: fundamentals, techniques, and prospects. IEEE J Sel Top Quantum Electron. 2014; 20(2): 272-288. |
| [95] | Younossi ZM, Koenig AB, Abdelatif D, Fazel Y, Henry L, Wymer M. Global epidemiology of nonalcoholic fatty liver disease-Meta-analytic assessment of prevalence, incidence, and outcomes. Hepatology. 2016; 64(1): 73-84. |
| [96] | Matteoni CA, Younossi ZM, Gramlich T, Boparai N, Liu YC, McCullough AJ. Nonalcoholic fatty liver disease: a spectrum of clinical and pathological severities. Gastroenterology. 1999; 116(6): 1413- 1419. |
| [97] | Xiao G, Zhu S, Xiao X, Yan L, Yang J, Wu G. Comparison of laboratory tests, ultrasound, or magnetic resonance elastography to detect fibrosis in patients with nonalcoholic fatty liver disease: A meta-analysis. Hepatology. 2017; 66(5): 1486-1501. |
| [98] | Bohte AE, Nelissen JL, Runge JH, et al. Breast magnetic resonance elastography: a review of clinical work and future perspectives. NMR Biomed. 2018; 31(10): e3932. |
| [99] | Hoofnagle JH. Course and outcome of hepatitis C. Hepatology. 2002; 36(5 Suppl 1): S21-S29. |
| [100] | European Association for the Study of Liver. EASL Recommendations on Treatment of Hepatitis C 2018. J Hepatol. 2018; 69(2): 461-511. |
| [101] | Poynard T, Bedossa P, Opolon P. Natural history of liver fibrosis progression in patients with chronic hepatitis C. Lancet. 1997; 349(9055): 825-832. |
| [102] | Hezode C, Castera L, Roudot-Thoraval F, et al. Liver stiffness diminishes with antiviral response in chronic hepatitis C. Aliment Pharmacol Ther. 2011; 34(6): 656-663. |
| [103] | Liaw YF, Chu CM. Hepatitis B virus infection. Lancet. 2009; 373(9663): 582-592. |
| [104] | Wang JH, Changchien CS, Hung CH, et al. Liver stiffness decreases after effective antiviral therapy in patients with chronic hepatitis C: Longitudinal study using FibroScan. J Gastroenterol Hepatol. 2010; 25(5): 964-969. |
| [105] | Hirschfield GM, Karlsen TH, Lindor KD, Adams DH. Primary sclerosing cholangitis (Lancet. 2013; 382(9904): 1587-1599. |
| [106] | Czaja AJ, Carpenter HA. Optimizing diagnosis from medical liver biopsy. Clin Gastroenterol Hepatol. 2007; 5(8): 898-907. |
| [107] | Corpechot C, Carrat F, Poujol-Robert A, et al. Noninvasive elastography-based assessment of liver fibrosis progression and prognosis in primary biliary cirrhosis. Hepatology. 2012; 56(1): 198-208. |
| [108] | Chalasani NP, Hayashi PH, Bonkovsky HL, et al. ACG Clinical Guideline: Diagnosis and management of idiosyncratic drug-induced liver injury. Am J Gastroenterol. 2014; 109(7): 950-966. |
| [109] | Fontana RJ, Watkins PB, Bonkovsky HL, et al. Drug-Induced Liver Injury Network (DILIN) prospective study: rationale, design, and conduct. Drug Saf. 2009; 32(1): 55-68. |
| [110] | D'Ambrosio R, Aghemo A, Rumi MG, et al. Morphometric and immunohistochemical study to assess the benefit of a sustained virological response in hepatitis C virus patients with cirrhosis. Hepatology. 2012; 56(2): 532-543. |
| [111] | Harrison SA, Ratziu V, Boursier J, et al. A blood-based biomarker panel (NIS4) for the non-invasive diagnosis of non-alcoholic steatohepatitis and liver fibrosis: a prospective derivation and global validation study. Lancet Gastroenterol Hepatol. 2020; 5(11): 970-985. |
| [112] | Bachofner JA, Valli PV, Kroger A, et al. Direct antiviral agent treatment of chronic hepatitis C results in rapid regression of transient elastography and fibrosis markers, fibrosis-4 score, and aspartate aminotransferase-platelet ratio index. Liver Int. 2017; 37(3): 369-376. |
| [113] | Tzschatzsch H, Ipek-Ugay S, Dalam MN, et al. Multifrequency time-harmonic elastography for the measurement of liver viscoelasticity in large tissue windows. Ultrasound Med Biol. 2015; 41(3): 724- 733. |
| [114] | Shi Y, Gao F, Li Y, Tao S, Yu B, Liu Z. Differentiation of benign and malignant solid pancreatic masses using multi-region radiomics analysis of EUS images combined with a clinical-radiological. model. Eur Radiol. 2022; 32(8): 5146-5158. |
| [115] | Huang Z, Zheng J, Zeng J, Wang X, Wu T, Zheng R. Normal liver stiffness in healthy adults assessed by real-time shear wave elastography using a new reliability index. J Med Ultrason. 2014; 41(1): 39- 43. |
| [116] | Toshima T, Shirabe K, Takeishi K, et al. New method for assessing liver fibrosis based on acoustic radiation force impulse: special reference to the difference between right and left liver. J Gastroenterol. 2011; 46(5): 705-711. |
| [117] | Salameh N, Larrat B, Abarca-Quinones J, et al. Early detection of steatohepatitis in fatty rat livers using MR elastography. Radiology. 2009; 253(1): 90-97. |
| [118] | Wang QB, Zhu H, Liu HL, Zhang B. Performance of magnetic resonance elastography and diffusion- weighted imaging for the staging of hepatic fibrosis: A meta-analysis. Hepatology. 2012; 56(1): 239- 247. |
| [119] | Younossi Z, Anstee QM, Marietti M, et al. Global burden of NAFLD and NASH: trends, predictions, risk factors, and prevention. Nat Rev Gastroenterol Hepatol. 2018; 15(1): 11-20. |
| [120] | Singh S, Venkatesh SK, Loomba R, et al. Magnetic resonance elastography for staging liver fibrosis in non-alcoholic fatty liver disease: a diagnostic accuracy systematic review and individual participant data pooled analysis. Eur Radiol. 2016; 26(5): 1431-1440. |
| [121] | Loomba R, Cui J, Wolfson T, et al. Novel 3D Magnetic Resonance Elastography for Noninvasive Diagnosis of Advanced Fibrosis in NAFLD: A Prospective Study. Am J Gastroenterol. 2016; 111(7): 986-994. |
| [122] | Serai SD, Trout AT, Miethke A, Xanthakos SA, Dillman JR. Putting it all together: established and emerging MRI techniques for detecting and measuring liver fibrosis. Pediatr Radiol. 2018; 48(9): 1256-1272. |
| [123] | Ferraioli G, Wong VW, Castera L, et al. Liver Ultrasound Elastography: An Update to the World Federation for Ultrasound in Medicine and Biology Guidelines and Recommendations. Ultrasound Med Biol. 2018; 44(12): 2419-2440. |
| [124] | Yoon JH, Lee JM, Woo HS, et al. Staging of hepatic fibrosis: comparison of magnetic resonance elastography and shear wave elastography in the same individuals. Korean J Radiol. 2013; 14(2): 202- 212. |
| [125] | Lee DH, Lee JM, Han JK, Choi BI. MR elastography of healthy liver parenchyma: Normal values and reliability of liver stiffness value measurement. J Magn Reson Imaging. 2013; 38(5): 1215-1223. |
| [126] | Huwart L, Sempoux C, Vicaut E, et al. Magnetic resonance elastography for noninvasive staging of liver fibrosis. Gastroenterology. 2008; 135(32): 32-40. |
| [127] | Patel J, Bettencourt R, Cui J, et al. Association of noninvasive quantitative decline in liver fat content on MRI with histologic response in nonalcoholic steatohepatitis. Therap Adv Gastroenterol. 2016; 9(5): 692-701. |
| [128] | Marcellin P, Gane E, Buti M, et al. Regression of cirrhosis during treatment with tenofovir disoproxil fumarate for chronic hepatitis B: A 5-year open-label follow-up study. Lancet. 2013; 381(9865): 468- 475. |
| [129] | de Ledinghen V, Vergniol J, Foucher J, El-Hajbi F, Merrouche W, Rigalleau V. Feasibility of liver transient elastography with FibroScan using a new probe in obese patients. Liver Int. 2010; 30(7): 1043-1048. |
| [130] | Bamber J, Cosgrove D, Dietrich CF, et al. EFSUMB guidelines and recommendations for the clinical use of ultrasound elastography. Part 1: Basic principles and technologies. Ultraschall Med. 2013; 34(2): 169-184. |
| [131] | Neumann UP, Berg T, Bahra M, et al. Fibrosis progression after liver transplantation in patients with recurrent hepatitis C. J Hepatol. 2004; 41(5): 830-836. |
| [132] | Fraquelli M, Rigamonti C, Casazza G, et al. Reproducibility of transient elastography in the evaluation of liver fibrosis in patients with chronic liver disease. Gut. 2007; 56(7): 968-973. |
| [133] | Millonig G, Reimann FM, Friedrich S, et al. Extrahepatic cholestasis increases liver stiffness (FibroScan), regardless of fibrosis. Hepatology. 2008; 48(5): 1718-1723. |
| [134] | Cobbold JF, Morin S, Taylor-Robinson SD. Transient elastography for the assessment of chronic liver disease: Is it ready for the clinic? World J Gastroenterol. 2007; 13(36): 4791-4797. |
| [135] | Coco B, Oliveri F, Maina AM. Transient elastography: a new surrogate marker of liver fibrosis influenced by major changes in transaminase levels 2007; 14(5): 360-369. |
| [136] | Friedrich-Rust M, Wunder K, Kriener S, et al. Liver fibrosis in viral hepatitis: noninvasive assessment with acoustic radiation force impulse imaging versus transient elastography. Radiology. 2009; 252(2): 595-604. |
| [137] | Vizzutti, F; Arena, U; Romanelli, G.. Liver stiffness measurement predicts severe portal hypertension in patients with HCV-related cirrhosis. Hepatology. 2007; 45(5): 1290-1297. |
| [138] | Kettaneh A, Marcellin P, Douvin C, et al. Features associated with the success rate and performance of FibroScan measurements for the diagnosis of cirrhosis in patients with hepatitis C virus: a prospective study of 935 patients. J Hepatol. 2007; 46(4): 628-634. |
| [139] | Nobili V, Vizzutti F, Arena U, et al. Accuracy and reproducibility of transient elastography for the diagnosis of fibrosis in pediatric nonalcoholic steatohepatitis. Hepatology. 2008; 48(2): 442-448. |
| [140] | Lupsor M, Badea R, Stefanescu H, et al. Performance of a new elastographic method (ARFI technology) compared to unidimensional transient elastography in the non-invasive assessment of chronic hepatitis C. Preliminary results. J Gastrointestin Liver Dis. 2009; 18(3): 303-310. |
| [141] | Boursier J, Zarski JP, de Ledinghen V, et al. Determination of reliability criteria for liver stiffness evaluation using transient elastography. Hepatology. 2013; 57(3): 1182-1191. |
| [142] | Yin M, Talwalkar JA, Glaser KJ, et al. Dynamic postprandial hepatic stiffness augmentation assessed with MR elastography in patients with chronic liver disease. AJR Am J Roentgenol. 2011; 197(1): 64- 70. |
APA Style
Kapoor, A. (2025). Viscosity Imaging for Detection of Liver Inflammation: A Systematic Review. International Journal of Gastroenterology, 9(2), 152-164. https://doi.org/10.11648/j.ijg.20250902.18
ACS Style
Kapoor, A. Viscosity Imaging for Detection of Liver Inflammation: A Systematic Review. Int. J. Gastroenterol. 2025, 9(2), 152-164. doi: 10.11648/j.ijg.20250902.18
@article{10.11648/j.ijg.20250902.18,
  author = {Atul Kapoor},
  title = {Viscosity Imaging for Detection of Liver Inflammation:
A Systematic Review},
  journal = {International Journal of Gastroenterology},
  volume = {9},
  number = {2},
  pages = {152-164},
  doi = {10.11648/j.ijg.20250902.18},
  url = {https://doi.org/10.11648/j.ijg.20250902.18},
  eprint = {https://article.sciencepublishinggroup.com/pdf/10.11648.j.ijg.20250902.18},
  abstract = {Background: Chronic liver disease affects millions globally, with inflammation being a critical indicator of disease progression. Current diagnostic methods have limitations in detecting early-stage liver inflammation, delaying intervention and worsening outcomes. Objective: To review evidence on viscosity imaging as a non-invasive technique for detecting liver inflammation, including diagnostic accuracy and comparative effectiveness versus existing methods. Methods: A systematic search of PubMed, Embase, Web of Science, and Cochrane Library was conducted from inception to January 2025. Studies evaluating viscosity imaging for liver inflammation detection were included. Two reviewers screened articles, extracted data, and assessed quality using QUADAS-2. Primary outcomes were diagnostic accuracy and correlation with histological inflammation grades. Results: Of 2,847 records, 45 studies met criteria, comprising 8,234 patients. Viscosity imaging showed sensitivity of 78% (95% CI: 74-82%) and specificity of 76% (95% CI: 72-80%) for moderate-to-severe inflammation. Viscosity parameters correlated with inflammation grades (r=0.48-0.52, p<0.001) independent of fibrosis. In NAFLD/NASH, viscosity imaging achieved higher accuracy (AUROC 0.82) versus elastography (AUROC 0.69, p=0.02). MRE showed superior reproducibility (ICC 0.90-0.96) versus ultrasound methods (ICC 0.82-0.91). Viscosity parameters decreased faster than stiffness after treatment. Conclusion: Viscosity imaging demonstrates moderate-to-good diagnostic accuracy for liver inflammation detection. Combined with elastography, it enables comprehensive liver assessment and supports earlier intervention. Further prospective studies with long-term data are needed to establish clinical utility.},
 year = {2025}
}
TY  - JOUR
T1  - Viscosity Imaging for Detection of Liver Inflammation:
A Systematic Review
AU  - Atul Kapoor
Y1  - 2025/12/31
PY  - 2025
N1  - https://doi.org/10.11648/j.ijg.20250902.18
DO  - 10.11648/j.ijg.20250902.18
T2  - International Journal of Gastroenterology
JF  - International Journal of Gastroenterology
JO  - International Journal of Gastroenterology
SP  - 152
EP  - 164
PB  - Science Publishing Group
SN  - 2640-169X
UR  - https://doi.org/10.11648/j.ijg.20250902.18
AB  - Background: Chronic liver disease affects millions globally, with inflammation being a critical indicator of disease progression. Current diagnostic methods have limitations in detecting early-stage liver inflammation, delaying intervention and worsening outcomes. Objective: To review evidence on viscosity imaging as a non-invasive technique for detecting liver inflammation, including diagnostic accuracy and comparative effectiveness versus existing methods. Methods: A systematic search of PubMed, Embase, Web of Science, and Cochrane Library was conducted from inception to January 2025. Studies evaluating viscosity imaging for liver inflammation detection were included. Two reviewers screened articles, extracted data, and assessed quality using QUADAS-2. Primary outcomes were diagnostic accuracy and correlation with histological inflammation grades. Results: Of 2,847 records, 45 studies met criteria, comprising 8,234 patients. Viscosity imaging showed sensitivity of 78% (95% CI: 74-82%) and specificity of 76% (95% CI: 72-80%) for moderate-to-severe inflammation. Viscosity parameters correlated with inflammation grades (r=0.48-0.52, p<0.001) independent of fibrosis. In NAFLD/NASH, viscosity imaging achieved higher accuracy (AUROC 0.82) versus elastography (AUROC 0.69, p=0.02). MRE showed superior reproducibility (ICC 0.90-0.96) versus ultrasound methods (ICC 0.82-0.91). Viscosity parameters decreased faster than stiffness after treatment. Conclusion: Viscosity imaging demonstrates moderate-to-good diagnostic accuracy for liver inflammation detection. Combined with elastography, it enables comprehensive liver assessment and supports earlier intervention. Further prospective studies with long-term data are needed to establish clinical utility.
VL  - 9
IS  - 2
ER  -
Department of Radiology, Advanced Diagnostics and Institute of Imaging, Amritsar, India
Information