Research Article | | Peer-Reviewed

The Effect of Independent Variables on the Vitamin Contents of Auricularia Auricula Judae (AAJ) Using Response Surface Methodology

Received: 9 January 2025     Accepted: 5 February 2025     Published: 18 March 2025
Views:       Downloads:
Abstract

The study investigated the quality of tree ear mushroom or Auricularia auricula judae (AAJ) as affected by the pre-treatment blanching and drying. This pre-treatment technique was optimized using RSM in which the independent variables blanching time (hot water), drying temperature (hot air oven)), and responses were fitted to a second order regression model by performing the ANOVA to determine the individual effects of the variables on the responses of the AAJ. whereas the method of association of vitamin chemist as described by Kirk and Sawyer was used to determine the vitamin content of the tree ear mushroom riboflavin and thiamine contents were determined using spectrophotometric method while niacin analysis were carried out using the extracting method filter all the analysis The result revealed that the total vitamin content was observed to have the highest concentration, while riboflavin was the lowest with observed peak values of 4.63% and 0.04% respectively. This result strongly suggests that the fungus is rich and healthy which could be explored for beneficial purposes. And it is recommended that incentive should be given to farmers to cultivate much of the mushroom to meet their natural demands.

Published in International Journal of Food Engineering and Technology (Volume 9, Issue 1)
DOI 10.11648/j.ijfet.20250901.11
Page(s) 1-19
Creative Commons

This is an Open Access article, distributed under the terms of the Creative Commons Attribution 4.0 International License (http://creativecommons.org/licenses/by/4.0/), which permits unrestricted use, distribution and reproduction in any medium or format, provided the original work is properly cited.

Copyright

Copyright © The Author(s), 2025. Published by Science Publishing Group

Keywords

Tree Ear Mushroom, Optimization, Vitamin, Blanching, Nutritional Content

1. Introduction
China is the world's largest producer of mushrooms, with production growing steadily . But according to , wild mushrooms are becoming more significant due to their pharmacological, sensory, and nutritional qualities . Because of their distinct flavors, they can be used as a source of food flavoring. The inclusion of whole mushrooms into the diet may serve as potential dietary supplements. For instance, consuming mushrooms can cover the daily intake requirements of different essential vitamins. Mushrooms offer medicinal values to humans since they contain certain pharmacological properties which are currently widely recognized yet largely untapped sources of powerful new pharmaceutical products. For instance, mushrooms contain low calories and significant purine contents, low glucose and high Manitol contents, as well as low levels of sodium concentration which are suitable for the diet of people suffering from excessive weight, metabolic disease, diabetes, and high blood pressure respectively.
Besides, these fungi have a high content of selenium, which is regarded as an excellent antioxidant. Evidence shows that high Basidiomycetes mushrooms contain different types of biologically active high-molecular weight and low molecular weight compounds that could be utilized. Since mushrooms offer the above-stated nutritional and medicinal benefits to man thus the need to pretreat it for future use using special techniques, one of which is blanching. This technique needs to be optimized using a methodology known as the Response Surface Methodology (RSM) which has found its application in the extraction of crude polysaccharides from wild edible mushroom , in the optimization processes of food systems as a mathematical model with the objective of achieving product excellent at the lowest possible overall cost and accelerate the transitional cycle from research and development to manufacturing , in the extraction and characterization of polysaccharides from medicinal mushrooms , and in the freeze drying and microwave drying of medicinal mushroom and other foods. All of these applications yielded positive results. The mushroom –Auricularia auricula judae (AAJ) generally called black wood Ear or Tree Ear, is not an exception.
In view of the above, this research on Optimization of Pre-treatment (blanching) and Drying on the nutritional quality of mushroom Auricularia auricula judae (AAJ) is necessary.
1.1. Statement of Problem
The poor economic condition of a country has an effect on the imbalance of food nutrients consumed by the people especially in developing countries. The poverty level of some of the people in my area and unawareness on what to do to get cheap food sources that are rich nutritionally has brought about a lot of health problems. Tree Ear Mushroom as one of the mushrooms eaten locally is not optimized nor pre-treated (blanched) before consumption, as a result, some of the nutrients in the mushroom could be destroyed without consumers noticing it.
1.2. Objectives of the Study
To determine the vitamin contents of mushroom Auricularia auricula-judae (AAJ) using RSm= Response surface Methodology.
2. Literature Review
2.1. Concept of Tree Ear Mushroom
The tree ear or jelly ear mushroom was described scientifically in 1789 by Jean Baptiste Francois (Pierre) Bulliard, who named it Tremella auricula judae. After several changes of genus this fungus was transferred into its present genus in 1897 by Austrian Botanist. However, in 1888, the species was given the name Auricularia auricula judae by Joseph Schröter. “Auricula” is a Latin word meaning “ear” and “Judae” means “Judas” – the Jew who is spoken of as the betrayer of Jesus . The fungus is associated with Judas Iscariot because of the belief that he hanged himself on an elder tree after his betrayal of Jesus Christ. Folklore suggests that the ears are Judas’s returned spirit and are all that are left to remind us of his suicide .
2.2. Identification Guide
The tree ear mushrooms are easy to identify in their raw form. They grow on wood and they are distinctively shaped, typically reminiscent of a floppy ear, with fruit bodies covered with tiny hairs, wrinkle, and may have veins making it appear even more ear-like. The outer surface of the lobed fruit body is tan–brown with a purple tinge and covered in a fine grayish velvety down, while the inner surface is smooth. When the fruit bodies age, they become darker in colour while the inner surface is lighter grey purple in colour. See Figures 1 and 2.below.
Source:

Download: Download full-size image

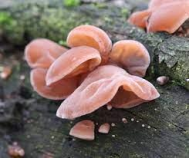
Figure 1. Young Untreated Tree Ear Mushroom (AAJ) Growing on Fallen Wood.
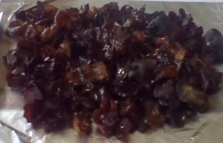
Figure 2. Pre- Treated Tree Ear Mushroom (AAJ).
The tree or wood ear mushrooms are known by many names. They are often called: black fungus, wood ear mushroom, jelly ear, cloud ear, Jew’s or Judas’s ear or kikurage mushrooms . In Nigeria, the tree ear mushroom could also be identified by their respective local names given to it by the indigenes of the country. For instance, the Efiks call it “ùdıb”, the Yorubas call it “olu”, the Igbos call it “ero”, whereas the Hausas call it “naman kaza. Other names are ‘Ntungkpa,' by Yakurr people and "Hitofah”, by Bahumono people all of Cross River State, Nigeria and other names.
2.3. Edibility of the Mushroom
Tree Ear Mushroom is an edible mushroom with ten to fifteen species recognized worldwide, it is safe to eat, and has a mild, even flavour. It has a soft jelly-like texture, although older species can become quite chewy. The fruit does not have a strong taste, but it absorbs other strong flavours quite easily. There is no poisonous species that will be confused with this mushroom .
2.4. Nutritional Component of Tree Ear Mushroom (AAJ)
The Tree Ear Mushroom (AAJ) has been proven to be a very good source of almost all essential amino acids (34 7%) as compared to plant proteins. It is also asserted that the chemical content of this (AAJ) fungus proves that it is a valuable raw material to produce low-calorie dietary food as well as a good source of biologically active polysaccharides . It is therefore fit to support that Tree Ear Mushroom is an edible fungus grown on plant residues containing 35% of protein, all essential amino acids and other substances. Commenting on the composition of AAJ, Irina, et al., 2015 noted that this fungus contains 3.6% of ash, 12.5% of protein, 1.7% of fat and a large amount carbohydrate (66.1%) per dry matter. The research work of Lama, 2020 shows that one hundred grams of raw tree ear mushroom contains: 7% thiamine (vitamin B1), 16% riboflavin (vitamin B2), 40% vitamin B5 (pantothenic acid), 6% vitamin B6, 5% folate (vitamin B9), 32% copper, 5% iron, 8% magnesium, 16% selenium, and 6% zinc. Additionally, tree ear mushrooms contain about 85 – 95% moisture content, appreciable amount of niacin (vitamin B3), biotin (vitamin H, vitamin B7, or vitamin B8), folic acid (vitamin B9), and vitamin B12 (cobalamin) .
Tree ear mushrooms (AAJ) also contain protein, low fat, dietary soluble fiber, omega fatty acids like linoleic acid and antioxidants. Moreover, reports show that mushrooms contain low levels of carbohydrate . For instance, the works show that in a cup of whole white mushrooms just 3 grams of carbohydrate was found. This species of edible fungus contains minerals required in the human diet, such as, calcium (Ca), potassium (K), magnesium (Mg), Iron (Fe), Zinc (Zn). Tree Ear mushroom (AAJ) is high in Calcium in comparison with other mushrooms .
2.5. Uses of Mushroom (AAJ)
Mushroom can be utilized in varieties of ways as indicated below:
2.5.1. Mushroom as Food
The mushroom AAJ is a traditional food found throughout the year in temperate regions worldwide. The Mushroom is edible, nutritionally rich and regarded as a vegetarian meat supplement, and used as food in Asian cuisine . Mushrooms have been considered as ingredients of gourmet cuisine across the world; especially for their unique flavour and have been valued by humans as a culinary wonder. They are considered as a delicacy with high nutritional and fun functional value. They are of considerable interest because of their organoleptic merit, medicinal properties, and economic significance . The ground powder of the mushroom is used as a flavour and also to remove excess liquid in soups as an alternative to flours because of its absorbent abilities. The mushroom is used in soups such as ‘hot’ and ‘sour’ soups, draw soups, and in all sorts of stews. The tree ear mushroom (AAJ) is used as a ‘trail food’, that is, something you can pick off a tree ear, clean and eat; it can be quite a good gum substitute.
Moreover, The Tree Ear Mushroom (AAJ) has been recognized as the ideal food for diabetic prevention of hyperglycemia. Many studies have shown that the mushroom AAJ has active biological compounds of medicinal and dietary supplements for anti-tumor, anti-diabetic, anti- inflammatory, anti-oxidant, anti-microbial, anti-coagulant, hypolypidemic, cholesterol lowering properties and hepati Steatosis . In some parts of Cross River State, Nigeria the mushroom is regarded as a delicacy, and commonly used as a meat supplement in some of their festival soups.
2.5.2. Uses in Folk Medicine
The fungus has a much stronger background of folk medicine than as food. It is used in folk medicine as recently as in the 19th century for complaints including sore throat, sore eyes, and jaundice and as astringents due to its ability to absorb water. It has been used in different countries for the treatment of different ailments as follows:
China: The mushroom was used in soup to treat colds and fevers, and to treat infections of the lungs. They also recommend this fungus for haemorrhoids and as cleansing agent for both stomach and intestines. It was used to treat such widely varying conditions as hemoptysis (spitting up blood), angina (cardiac pain), diarrhea and warding against gastrointestinal upset. There was this popular belief that plants and fungi, resembling certain parts of the body, could be used to treat ailments of that part of the body. Since this fungus resembles the folds of the throat, it is boiled in milk or vinegar and used to treat throat ailments . Consider how this fungus has been utilized in some parts of the world:
Indonesia: It has been used by many Herbalists as a poultice to treat inflammation of the eye, as well as a palliative to treat sore throats, in the 16th centuries, it was boiled in milk or steeped in beer to produce the throat medicine.
Ghana: A report for the CommonWealth Forestry Conference in Southern Ghana on medicinal and edible fungi found that the mushroom is used as blood tonic, .
Scotland: the mushroom was used as a gargle for sore throats.
Ireland: The fungus is used in an attempt to cure Jaundice.
2.5.3. Pharmaceutical Uses of the Mushroom
Other therapeutic uses of the fungus from modern medicine include lowering blood cholesterol and triglycerides. There is evidence that it can play a role in treating diabetes. They have also been found to have anti -tumor, cardiovascular, anti- viral, anti-bacterial and anti- parasitic effect, anti-coagulant, anti-inflammatory, hyper-cholesterol, and hypolidemic and hepatic steatosis preventing activities. A more recent study shows that tree ear fungus block blood clotting by obstructing the platelets. There have actually been cases of internal bleeding from particularly sensitive people who accidentally ate too much sweet and were injected with this fungus and their problem was solved. Nonetheless, this species of mushroom protects bone density levels caused by malnutrition and unbalanced nutrition during the diet of abdominal obese women . There is evidence that injecting this fungus regularly in small doses can be therapeutic in preventing stroke and heart attack.
2.6. Pre-Treatment of Mushroom
The word “pre-treatment”, according to the Cambridge Dictionary, means “to treat in advance”. “Treat”, on the other hand, means “to put something through a special process in order to protect it”. Therefore, pre-treatment of mushroom is the advance subjection of mushroom to special processes in order to protect or preserve it for future use. Preservation of mushrooms is vital as freshly harvested mushrooms are highly perishable because of their high moisture content and their susceptibility to enzymatic browning. There are several ways of preserving mushrooms, these include: drying, freezing, tincturing, pickling, powdering, and making mushroom ketchup . Out of all these ways, freezing stands out unique as it preserves the texture, flavor, as well as the nutrient value of the mushrooms much more effectively . There are three (3) methods that could be employed prior to the application of any of the afore-stated preservation techniques, these include: blanching, steaming, or frying . For easy, long preservation of mushrooms, blanching is preferable. However, in this research work, blanching alongside with drying will be given priority to.
2.7. Effects of Some Pre-Treatment Techniques on Mushroom
In this section, the pre-treatment techniques that will be given attention to is blanching accompanied by drying. With respect to the afore-mentioned pretreatment techniques, some underlying factors that could affect the quality and texture of mushrooms are: blanching time, drying time, and drying temperature.
2.8. The Blanching Process
As noted in section 2.1.7.1, blanching can be vital for a long-time preservation of mushrooms. The word “blanching” refers to a cooking technique in which food, usually a vegetable or fruit, is scalded in boiling water, removed after a brief, timed interval, and finally plunged into iced water or placed under cold running water (shocking or refreshing) to halt the cooking process or as defined by “blanching is a thermal treatment that is usually performed prior to food processes such as drying, freezing, frying, and canning.” Blanching can also be said to be a controlled heating process which is based on the use of minimum heat requirement.
Some of the steps or processes involved in blanching include:
1. The mushrooms are sorted by sizes or cut into similar-sized chunks.
2. The mushrooms are soaked in a mixture containing 2 cups of water and 1 teaspoon of lemon juice for 5-10 minutes in order to prevent discolouration of the mushroom.
3. The mushrooms are placed in a steamer basket inside a pot of boiling water and allowed to steam for 3-5 minutes.
4. The mushrooms are removed and immediately placed in a bath of ice water for 3-5 minutes.
5. The water is strained and the mushrooms are placed in airtight, freezer-safe bags, and then either stored in the freezer or dried 13].
3. Materials and Methods
3.1. Materials
Mushroom fruiting bodies of tree ear (AAJ) weighing 1000.32g were bought from Farmers who came from Idomi community in Yakurr Local Government Area of Cross River State, Nigeria, where there was evidence of visible logs and dead trees. The mushrooms were collected during the early rainy season because during this period they are found in abundance, thus the choice of the season.
3.2. Preparation of Mushroom
The mushroom was properly identified in the Department of Plant and Ecological Sciences University of Calabar based on their macro- and micro- morphological features. The collected mushroom sample was sorted out, washed and water drained from it. The sample was then blanched, drained off water, oven dry and stored for analysis. (Figure 3)
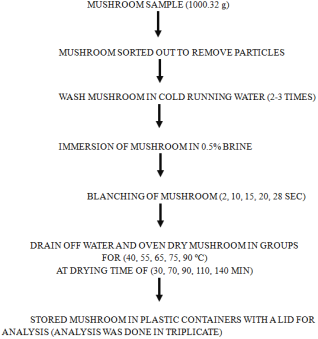
Figure 3. Modified Flow Chart of mushroom (AAJ) Preparation.
3.3. Optimization of Pre-treatment of Tree Ear Mushroom (AAJ)
The method of modification was used to optimize the pre-treatment of tree ear mushroom (AAJ). The whole sample was soaked with 0.5% of Sodium Chloride solution (or brine solution) of 2litres (2000 ml) for 3minutes.
3.4. Preparation of Brine Solution
Ten (10) grams of sodium chloride (NaCL) was dissolved in two (2) litres of water that is brine solution. One thousand (1000) g of the sample was soaked for three (3) minutes in the brine solution and then filtered.
3.5. Blanching Using Hot Water at 100°C
One thousand (1000) g of the sample were divided into twenty (20) runs, and each of the runs contained fifty (50) g of the mushroom. Distilled water was used for the boiling point of water at 100°C. The blanching time using hot water was 2, 10, 15, 20, and 28 seconds while the drying of the sample using hot air (oven) was 40, 55, 65, 75 and 90°C temperature, at the drying time of 30, 70, 90, 110 and 140 minutes. Each of the sample groups was dried out according to the temperature and drying time duration. Further, in determining the amino acid, applied Biosystem PTH amino acid Analyzer was used for the determination process. Model 120A PTH amino acid analyzer HPLC automatically analyses phenyl thiohydantoin (PTH) amino acids derived from Edman degradation of protein and peptildes.
4. Data Analysis
Table 1. Determination of Vitamins in Mushroom (AAJ) (mg/100g Dry Matter).

EXP. RUN

Blanching Time (SEC)

Drying Time (MINS)

Drying Temp °C

Total Vitamin C

Soluble Vitamin C

Riboflavin

Thaimin

Niacin

1

20

110

75

2.72 ± 0.02

1.48 ± 0.02

0.05 ± 0.01

0.12 ± 0.02

0.51 ± 0.01

2

6.59

90

65

3.68 ± 0.02

1.84 ± 0.02

0.09 ± 0.01

0.20 ± 0.1

0.93 ± 0.01

3

15

90

48.18

4.00 ± 0.1

1.78 ± 0.01

1.00 ± 0.1

0.21 ± 0.01

1.01 ± 0.01

4

15

90

65

3.37 ± 0.01

1.68 ± 0.02

0.08 ± 0.02

0.18 ± 0.02

0.85 ± 0.01

5

15

90

65

3.37 ± 0.01

1.68 ± 0.02

0.08 ± 0.02

0.18 ± 0.02

0.85 ± 0.01

6

10

110

75

2.98 ± 0.02

1.62 ± 0.02

0.07 ± 0.01

0.14 ± 0.02

0.56 ± 0.02

7

10

70

75

4.12 ± 0.02

2.05 ± 0.01

0.12 ± 0.02

0.22 ± 0.02

1.04 ± 0.02

8

10

70

55

4.33 ± 0.01

2.16 ± 0.02

0.13 ± 0.01

0.23 ± 0.01

1.09 ± 0.01

9

20

70

55

3.85 ± 0.01

1.92 ± 0.02

0.10 ± 0.1

0.17 ± 0.01

0.97 ± 0.01

10

23.409

90

65

3.06 ± 0.02

1.52 ± 0.02

0.07 ± 0.01

0.16 ± 0.02

0.77 ± 0.01

11

15

90

65

3.37 ± 0.01

1.68 ± 0.02

0.08 ± 0.02

0.18 ± 0.02

0.85 ± 0.01

12

20

110

55

2.68 ± 0.02

1.83 ± 0.01

0.09 ± 0.01

0.19 ± 0.01

0.92 ± 0.02

13

15

56.364

65

4.63 ± 0.01

2.31 ± 0.01

0.11 ± 0.01

0.25 ± 0.01

1.17 ± 0.01

14

20

70

75

3.74 ± 0.02

1.87 ± 0.01

0.04 ± 0.02

0.13 ± 0.1

0.94 ± 0.02

15

10

110

55

3.98 ± 0.02

1.99 ± 0.01

0.14 ± 0.02

0.24 ± 0.02

1.00 ± 0.1

16

15

90

65

3.37 ± 0.01

1.68 ± 0.02

0.08 ± 0.02

0.18 ± 0.02

0.85 ± 0.01

17

15

90

81.8179

2.74 ± 0.02

1.37 ± 0.01

0.06 ± 0.02

0.15 ± 0.01

0.69 ± 0.01

18

15

90

65

3.37 ± 0.01

1.68 ± 0.02

0.08 ± 0.02

0.18 ± 0.02

0.85 ± 0.01

19

15

123.636

65

2.11 ± 0.01

1.05 ± 0.01

0.05 ± 0.01

0.11 ± 0.01

0.53 ± 0.01

20

15

90

65

3.37 ± 0.01

1.68 ± 0.02

0.08 ± 0.02

0.18 ± 0.02

0.85 ± 0.01

Each Value Represents the Mean of 3 Determinants ± SD
Results in Table 1 shows that the observed value of Total Vitamin C, Soluble Vitamin C, Riboflavin, Thiamin and Niacin contents of AAJ were found to be from 2.11 to 4.63mg/100g, 1.05 to 2.3mg/100g, 0.06 to 1.00mg/100g, 0.11 to 0.25mg/100g, and 0.51 to 1.17mg/100g respectively.
Table 2. Response surface linear model for effect of blanching time, drying time and drying temperature on total vitamin C content of AAJ.

Source

Sum of Squares

Df

Mean Square

F-value

p-value

Significant

Model

6.39

3

2.13

32.72

< 0.0001

A-Blanching Time

0.9087

1

0.9087

13.97

0.0018

B-Drying Time

4.66

1

4.66

71.65

< 0.0001

C-Drying Temp

0.8164

1

0.8164

12.55

0.0027

Residual

1.04

16

0.0651

Lack of Fit

1.04

11

0.0946

Pure Error

0.0000

5

0.0000

Cor Total

7.43

19

Std. Dev.

0.2551

0.8598

Mean

3.44

Adjusted R²

0.8336

C.V.%

7.42

Predicted R²

0.7428

Adeq Precision

19.0530

Table 2 shows that response surface linear model (F=32.72; P = 0.0001) was significant (P<0.05) and effective in describing the total vitamin C content of AAJ. The result shows that, blanching time, (P=13.97; P=0.0018), drying time (F = 71.65; P = 0.0001) and drying temperature (F=12.55; P=0.0027) had significant (P<0.05) effects influencing the total vitamin C content of AAJ.
Effect of independent variables on the total vit. C content of AAJ
The estimated regression for the effect of independent variables on total Vit. C content of AAJ is presented in Table 2, and the coded regression equation is given by the equation (1).
Y11 = +3.44 – 0.2579X1 – 0.5842 X2 – 0.2445X3 (1)
Where; Y11=blanching time
X1=drying time
X3=drying temperature
Table 3. Estimated Regression Coefficients for the total Vit. C content of AAJ. Estimated Regression Coefficients for the total Vit. C content of AAJ. Estimated Regression Coefficients for the total Vit. C content of AAJ.

Factor

Coefficient Estimate

df

Standard Error

95% CI Low

95% CI High

VIF

Intercept

3.44

1

0.0570

3.32

3.56

A-Blanching Time

-0.2579

1

0.0690

-0.4043

-0.1116

1.0000

B-Drying Time

-0.5842

1

0.0690

-0.7305

-0.4379

1.0000

C-Drying Temp

-0.2445

1

0.0690

-0.3908

-0.0982

1.0000

The 3 – D plot shows increase in drying time with blanching time resulted in decreased total vit. C content of AAJ. Similarly, a decreased total vit C content was observed with increased drying temperature from 55 - 75°c.
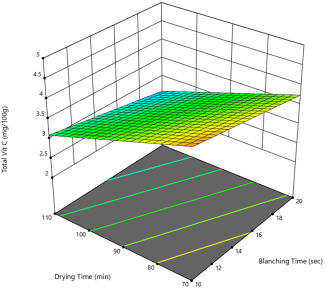
Figure 4. Shows the effect of drying time and blanching time on the total vitamin C content of AAJ. Increase in drying time and blanching time resulted in decreased total vitamin C content of AAJ.
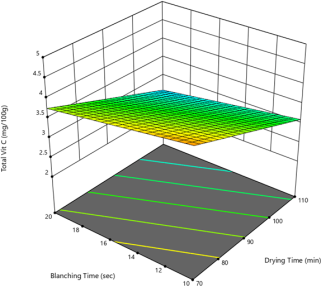
Figure 5. Shows the effect of drying time and blanching time on the total vitamin C content of AAJ. Increase in drying time and blanching time resulted in decreased total vitamin C content of AAJ.
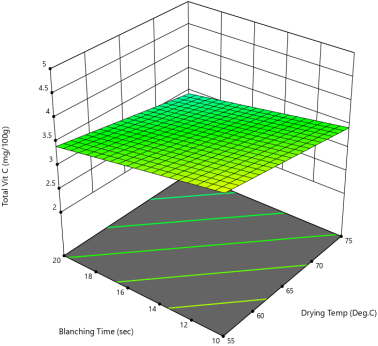
Figure 6. Effect of drying temperature and blanching time on the total vitamin C content of AAJ. Increase in drying temperature and blanching time resulted in decreased total vitamin C content of AAJ.
Table 4. Response surface linear model for effect of blanching time, drying time and drying temperature on soluble vitamin C content of AAJ.

Source

Sum of Squares

Df

Mean Square

F-value

p-value

Model

1.05

3

0.3486

12.45

0.0002

Significant

A-Blanching Time

0.1159

1

0.1159

4.14

0.0588

B-Drying Time

0.7494

1

0.7494

26.76

< 0.0001

C-Drying Temp

0.1804

1

0.1804

6.44

0.0219

Residual

0.4480

16

0.0280

Lack of Fit

0.4480

11

0.0407

Pure Error

0.0000

5

0.0000

Cor Total

1.49

19

Std. Dev.

0.1673

0.7001

Mean

1.74

Adjusted R²

0.6438

C.V.%

9.60

Predicted R²

0.4579

Adeq Precision

11.7943

Table 4 shows that response surface linear model (F=12.42; P = 0.0002) was significant (P<0.05) and effective in describing the Soluble Vitamin C content of AAJ. The result shows that, drying time (F = 26.76; P = 0.0001) and drying temperature (F=6.44; P=0.0219) had significant (P<0.05) effects on the Soluble Vitamin C content of AAJ.
Effects of independent variables on soluble vit. C content of AAJ
The estimated regression for the effects of independent variables on the soluble vit. C content of AAJ is presented in Table 4. and the regression equation given in equation (2).
Y12 = +1.74 – 0.2342X2 – 0.1149X3 (2)
Table 5. Estimated Regression Coefficients for the soluble Vit. C content of AAJ.

Factor

Coefficient Estimate

df

Standard Error

95% CI Low

95% CI High

VIF

Intercept

1.74

1

0.0374

1.66

1.82

A-Blanching Time

-0.0921

1

0.0453

-0.1881

0.0039

1.0000

B-Drying Time

-0.2342

1

0.0453

-0.3302

-0.1383

1.0000

C-Drying Temp

-0.1149

1

0.0453

-0.2109

-0.0189

1.0000

The effects of blanching time, drying time and drying temperature on soluble vit. C content of AAJ was better explained using 3-D surface model graphs.
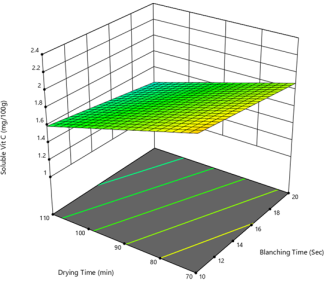
Figure 7. Shows the effect of drying time and blanching time on the soluble vitamin C content of AAJ. Increase in drying temperature and blanching time resulted in decreased total vitamin C content of AAJ.
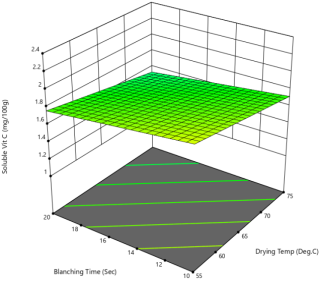
Figure 8. Effect of drying temperature and blanching time on the soluble vitamin C content of AAJ. Increase in drying temperature and blanching time resulted in decreased total vitamin C content of AAJ.
Table 6. Response surface reduced quadratic model for effect of blanching time, drying time and drying temperature on riboflavin content of AAJ.

Source

Sum of Squares

Df

Mean Square

F-value

p-value

Model

0.4896

2

0.2448

13.00

0.0004

significant

C-Drying Temp

0.2270

1

0.2270

12.06

0.0029

0.2625

1

0.2625

13.94

0.0017

Residual

0.3200

17

0.0188

Lack of Fit

0.3200

12

0.0267

Pure Error

0.0000

5

0.0000

Cor Total

0.8096

19

Std. Dev.

0.1372

0.6047

Mean

0.1300

Adjusted R²

0.5582

C.V.%

105.54

Predicted R²

-0.2991

Adeq Precision

11.1998

Table 6 Shows that the reduced quadratic model (F=13.00; P = 0.0004) was significant (P<0.05) and effective in describing the Riboflavin content of AAJ. The result shows that, drying temperature (F=12.06; P=0.0029) and quadratic effect of drying temperature (F=13.94; P=0.0017) had significant (P<0.05) effects on the Riboflavin content of AAJ.
Effect of independent variables on Riboflavin content of AAJ
The estimated regression coefficient for the effect of blanching time (X1) drying time (X2) and drying temperature (X3) on the riboflavin content of AAJ is presented in Table 7. The relationship for these effects could be expressed by the eqn below;
Y13 = + 0.387 – 0.1289X3 + 0.1338 X32 (3)
Table 7. Estimated Regression Coefficients for the riboflavin content of AAJ.

Factor

Coefficient Estimate

Df

Standard Error

95% CI Low

95% CI High

VIF

Intercept

0.0387

1

0.0392

-0.0441

0.1214

C-Drying Temp

-0.1289

1

0.0371

-0.2073

-0.0506

1.0000

0.1338

1

0.0358

0.0582

0.2093

1.0000

The 3-Dimensional plots of the effect of independent variables on response soluble oxalate is presented in Figure 5.
The quadratic effect of drying temperature exerted a positive effect on the response. This is evident as the plot is seen curving at a temperature above 67.5°C.
Table 8. Response surface linear model for effect of blanching time, drying time and drying temperature on thiamin content of AAJ.

Source

Sum of Squares

Df

Mean Square

F-value

p-value

Model

0.0200

3

0.0067

13.28

0.0001

Significant

A-Blanching Time

0.0060

1

0.0060

12.05

0.0032

B-Drying Time

0.0064

1

0.0064

12.74

0.0026

C-Drying Temp

0.0075

1

0.0075

15.03

0.0013

Residual

0.0080

16

0.0005

Lack of Fit

0.0080

11

0.0007

Pure Error

0.0000

5

0.0000

Cor Total

0.0280

19

Std. Dev.

0.0224

0.7134

Mean

0.1800

Adjusted R²

0.6597

C.V.%

12.44

Predicted R²

0.4692

Adeq Precision

13.2129

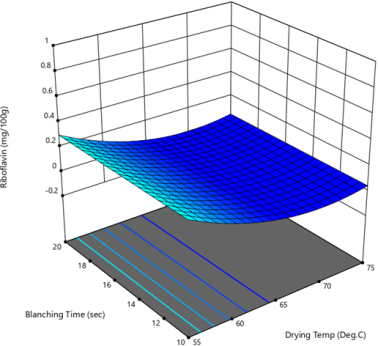
Figure 9. Shows the effect of drying temperature and blanching time on the riboflavin content of AAJ. Increase in drying temperature and blanching time resulted in decreased riboflanvin content of AAJ.
Table 8 shows that response surface linear model (F=13.28; P = 0.0001) was significant (P<0.05) in describing the thiamin content of AAJ. The result shows that, blanching time, (P=12.05; P=0.0032), drying time (F = 12.74; P = 0.0026) and drying temperature (F=15.03; P=0.0013) had significant (P<0.05) effects on the thiamin content of AAJ.
Effect of independent variables on thiamin content of AAJ
The regression for the effects of blanching time (X1), drying time (X2) and drying temperature (X3) on thiamin (Y4) content of AAJ is presented in Table 8 and the relationship could be expressed by equation (4).
Y4= + 0.1800 – 0.0210X1– 0.0216X2– 0.0235X3(4)
Table 9. Estimated Regression Coefficients for the thiamin content of AAJ.

Factor

Coefficient Estimate

df

Standard Error

95% CI Low

95% CI High

VIF

Intercept

0.1800

1

0.0050

0.1694

0.1906

A-Blanching Time

-0.0210

1

0.0061

-0.0339

-0.0082

1.0000

B-Drying Time

-0.0216

1

0.0061

-0.0345

-0.0088

1.0000

C-Drying Temp

-0.0235

1

0.0061

-0.0363

-0.0107

1.0000

The 3-Dimensional plots of the effect of independent variables on Thiamin content of AAJ as presented in Figure 6.
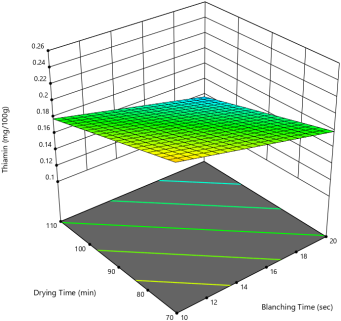
Figure 10. Effect of drying time and blanching time on the thiamin content of AAJ. Increase in drying time and blanching time resulted in decreased thiamin content of AAJ.
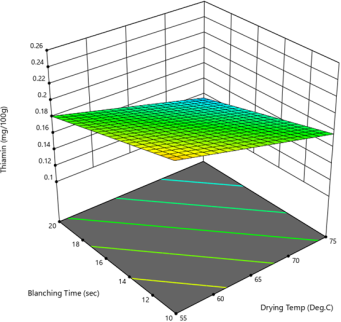
Figure 11. Effect of drying temperature and blanching time on the thiamin content of AAJ. Increase in drying temperature and blanching time resulted in decreased thiamin content of AAJ.
Table 10. Response surface 2FI model for effect of blanching time, drying time and drying temperature on Niacin content of AAJ.

Source

Sum of Squares

df

Mean Square

F-value

p-value

Model

0.5924

6

0.0987

75.28

< 0.0001

Significant

A-Blanching Time

0.0281

1

0.0281

21.40

0.0005

B-Drying Time

0.3311

1

0.3311

252.43

< 0.0001

C-Drying Temp

0.1578

1

0.1578

120.35

< 0.0001

AB

0.0010

1

0.0010

0.7720

0.3955

AC

0.0003

1

0.0003

0.2383

0.6336

BC

0.0741

1

0.0741

56.51

< 0.0001

Residual

0.0170

13

0.0013

Lack of Fit

0.0170

8

0.0021

Pure Error

0.0000

5

0.0000

Cor Total

0.6095

19

Std. Dev.

0.0362

0.9720

Mean

0.8615

Adjusted R²

0.9591

C.V.%

4.20

Predicted R²

0.8720

Adeq Precision

30.2982

Table 10 shows that response surface Two Factor Interaction (2FI) model (F=75.28; P = 0.0001) was significant (P<0.05) and effective in describing the Niacin content of AAJ. The result shows that, blanching time, (P=21.40; P=0.0005), drying time (F = 252.42; P = 0.001) and drying temperature (F=120.35; P=0.0001) and interacton of drying time and drying temperature (F=56.51; P=0.0001) had significant (P<0.05) effects on the niacin content of AAJ.
Effects of independent variables on Niacin content of AAJ
The regression for the effects of blanching time (X1), drying time (X2) and drying temperature (X3) on niacin (Y5) content of AAJ is known in Table 10 and the relationship could be expressed by equation (5).
Y15= +0.8615 – 0.0453X1– 0.1557X2– 0.1075X3– 0.0963X2X3(5)
Table 11. Estimated Regression Coefficients for the niacin content of AAJ.

Factor

Coefficient Estimate

df

Standard Error

95% CI Low

95% CI High

VIF

Intercept

0.8615

1

0.0081

0.8440

0.8790

A-Blanching Time

-0.0453

1

0.0098

-0.0665

-0.0242

1.0000

B-Drying Time

-0.1557

1

0.0098

-0.1769

-0.1345

1.0000

C-Drying Temp

-0.1075

1

0.0098

-0.1287

-0.0863

1.0000

AB

0.0112

1

0.0128

-0.0164

0.0389

1.0000

AC

0.0062

1

0.0128

-0.0214

0.0339

1.0000

BC

-0.0963

1

0.0128

-0.1239

-0.0686

1.0000

These effects were better explained by response surface plots Figure 9.
Figure12: Effect of drying time and blanching time on the niacin content of AAJ.
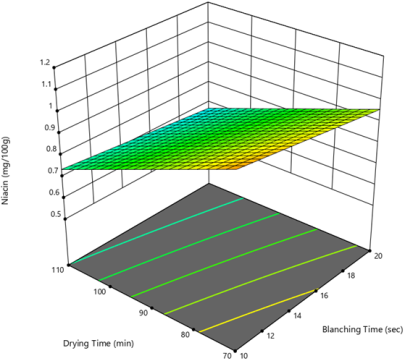
Figure 12. Shows the effect of drying time and blanching time on the niacin content of AAJ.
Increase in drying time and blanching time resulted in decreased niacin content of AAJ.
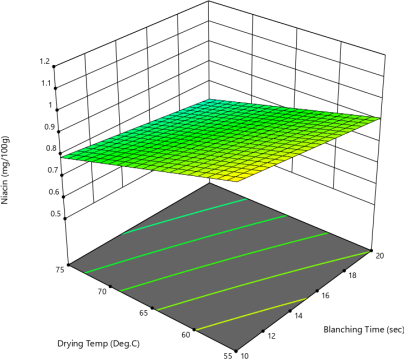
Figure 13. Shows the effect of drying temperature and blanching time on the niacin content of AAJ. Increase in drying temperature and blanching time resulted in decreased niacin content of AAJ.
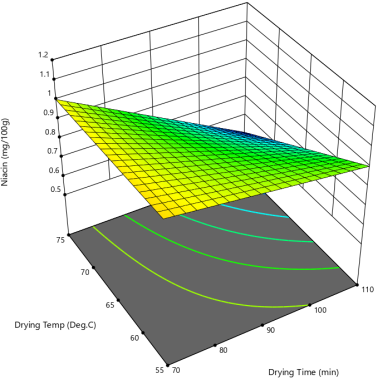
Figure 14. Effect of drying temperature and drying time on the niacin content of AAJ. Increase in drying temperature and drying time resulted in decreased niacin content of AAJ.
5. Discussion of Findings
Descriptive statistics on the vitamins content of AAJ
The vitamin contents of AAJ are presented in Table 3. Results in Table 2 showed that the total Vit. C. content of AAJ ranged from 2.11 – 4.63mg/100g. The least value (2.11mg/100g) was observed during blanching for 15 secs, drying for 123.63min at a drying temperature of 65°c (run 7) while the highest Vit. C (4.63mg/100g) content was obtained during treatment conditions of; 15 sec. blanching time 56.36 min. drying time and 65°c drying temperature (run. 3). In the works of Matilla et al., quoted in , 20mg/100g (DW) of Vitamin C was found in Oyster mushroom. This value is in sharp contrast with that of the present research.
Both the independent variables and responses were fitted to a regression model by performing the analysis of variance (ANOVA) to determine the individual effects on the responses of AAJ.
Response surface linear model for effect of blanching time, drying time and drying temperature on Total Vitamin C content of AAJ.
The experimental data for total vit. C of AAJ was fitted to the response surface linear model. Analysis of variance (Table 4) shows that the linear model (F = 32.72; P: 0.0001) was significant (P<0.05) and effective in describing the total Vit C of AAJ. There was only a 0.01% chance that an F-value this large could occur due to noise. The goodness-of-fit of the mode was ascertained by the coefficient of determination (R2). An R2 value of 0.8598 implies that the model fit the data and 85.98% variations in the observed values of total vit. C were explained by the response surface linear model. Adjusted R2 (0.8336) was in agreement with predicted R2 (0.7428) which indicated excellent correlation between the independent variables. In addition, the model is reproducible (C.V = 7.42%) and can be used to navigate the design space (Adequate precision = 19.0530). (Table 4).
Effect of independent variables on the total vit. C content of AAJ
The estimated regression for the effect of independent variables on total Vit. C content of AAJ is presented in Table 5, and the coded regression equation is given by the equation (6).
Y11 = +3.44 – 0.2579 X1 – 0.5842 X2 – 0.2445X3 (6)
Where; Y11 = total vit C
X1 = blanching time
X2 = drying time
X3 = drying temperature
Blanching time (F = 13.97; P = 0.0018), drying time (F = 71.65; P = 0.0001) and drying temperature (F = 12.55; P = 0.0027) had significant (P<0.05) effects influencing the total vit. C content of AAJ. The negative coefficients indicate antagonistic effects on the response.
The 3 – D plot (chapter 4) shows increase in drying time with blanching time resulting in decreased total vit. C content of AAJ (Figures 1 and 2). Similarly, a decreased total vit C content was observed with increased drying temperature from 55 - 75°C. (Table 5 and Figure 11).
Descriptive statistics on the soluble vitamins content of AAJ
The soluble Vit. C contents of AAJ ranged from 1.05 – 2.31mg/100g. Run 7, having treatment conditions of; 15 sec blanching time, 123.63min drying time and 65°C drying temperature recorded the lowest value of 1.05mg/100g. The highest value (2.31mg/100g) was observed when AAJ was treated at 15 sec. blanching time, 56.36 min drying time and 65°C drying temperature (Run 3). The highest value of vitamin C content of AAJ in this result falls within the range of 2.1-5.5mg/100g of vitamin C content of Agaricus bisporus and pleurotus ostreatus mushroom analysed by Jaworska et al.. (Table 6).
Response surface linear model for effect of blanching time, drying time and drying temperature on Soluble Vitamin C content of AAJ.
Results in Table 6 revealed that the experimental data for soluble vit. C was fitted to the response surface linear model. The ANOVA shows that the linear model (F = 12.42; P = 0.0002) was significant (P<0.05) and effective in describing the effect of independent variables on total soluble Vit. C content of AAJ.
There was only a 0.02% chance that an F-value this large could occur due to noise. An R2 value of 0.7001 indicates fair fit of the model but useful in making predictions. An R2 value lower than 0.8 was reported. They reported that the respective models are useful in making predictions.
The adjusted R2 (0.6438) was in reasonable agreement with the predicted R2 (0.4579) indicating excellent correlation between the independent variables. The results (Table 7) showed good precision and reliability of the model and can be used to navigate the design space (adequate precision = 11.7943). (see Table 7).
Effects of independent variables on soluble vit. C content of AAJ
The estimated regression for the effects of independent variables on the soluble vit. C content of AAJ is presented in Table 5, and the regression equation given in equation (7).
Y12 = +1.74 – 0.2342X2 – 0.1149X3 (7)
Results of ANOVA of soluble Vit. C showed that drying time (F = 26.76; P = 0.0001), and drying temperature (F = 6.44; P = 0.0219) had significant (P<0.05) effect on soluble vit. C content of AAJ. The negative coefficients in the equation indicated that both terms (drying time and temperature) had antagonistic effects on the soluble vit. C content of AAJ.
The effects of blanching time, drying time and drying temperature on soluble vit. The C content of AAJ was better explained using 3-D surface model graphs. Figure 3) shows that an increase in drying time from 70 – 110min resulted in a decrease in the soluble vit. C content of AAJ. Similarly, Figure 4), results show that increase in drying temperature from 55 - 75°C resulted in decreased soluble vit. C. content of AAJ. (See Table 8 and Figure 2).
Descriptive statistics on the Riboflavin content of AAJ
Riboflavin content of AAJ ranged from 0.06 – 1.00mg/100g (table 9). Run 6 recorded the least value (0.04mg/100g) with the following treatment conditions
Blanching time: 20 sec;
Drying time: 70 min,
Drying temperature: 75°C
Run 19 recorded the highest riboflavin content of 1.00mg/100g. The AAJ was treated with the following conditions:
Blanching time: 15 sec
Drying time: 90 min
Drying temperature: 48.18°C
The above range contrasts with the works of Jaworska et al., (2015). In their work, the range of vitamin B2 (riboflavin) in the analysed mushrooms ranges between 35-51 Mg/Kg. (See Table 9).
Response surface linear model for effect of blanching time, drying time and drying temperature on Riboflavin content of AAJ.
The main effects of blanching as well as their interactive effects on the riboflavin content of AAJ was not significant hence these terms were removed from the quadratic model resulting in a reduced quadratic model as presented in Table 2. The analysis of variance (Table 3) shows that the reduced quadratic model (F = 13.00; P = 0.0004) was significant (P<0.05) and effective in describing the effect of blanching time, drying time and drying temperature on the riboflavin content of AAJ.
The R2 value of 0.6047 is an indication that 60.47% of variation in observed values of riboflavin content of AAJ were explained by the reduced quadratic model. Furthermore, the model can be used to navigate the design space (Adequate precision = 11.1998).
There was only a 0.02% chance that an F-value this large could occur due to noise. An R2 value of 0.7001 indicates fair fit of the model but useful in making predictions. An R2 value lower than 0.8 was reported. They reported that the respective models are useful in making predictions.
The adjusted R2 (0.6438) was in reasonable agreement with the predicted R2 (0.4579) indicating excellent correlation between the independent variables. The results (Table 3) showed good precision and reliability of the model and can be used to navigate the design space (adequate precision = 11.7943).
Effect of independent variables on Riboflavin content of AAJ
The estimated regression coefficient for the effect of blanching time (X1) drying time (X2) and drying temperature (X3) on the riboflavin content of AAJ is presented in Table 7. The relationship for these effects could be expressed by the eqn below;
Y13 = + 0.387 – 0.1289X3 + 0.1338X2 (8)
Drying temperature (F = 12.06; P = 0.0029) and quadratic effect of drying temperature (F = 13.94; P = 0.0017) had significant (P<0.05) effect on the riboflavin content of AAJ. However, blanching time, drying time as well as their interactive and quadratic effects were not significant and were removed thus resulting in a reduced regression model that is statistically significant as presented in equation (8).
A negative coefficient shows a negative effect on the riboflavin content of AAJ while a positive coefficient indicates positive effect on the riboflavin content of AAJ. Figure 3 shows that an increase in drying temperature led to decreased riboflavin content of AAJ. The temperature 67.5°c led to a gradual increase in riboflavin content of AAJ. The quadratic effect of drying temperature exerted a positive effect on the response. This is evident as the plot is seen curving at a temperature above 67.5°c. (See Table 3 and Figure 3).
Descriptive statistics on the Thiamin content of AAJ
Table 3 also revealed that the thiamin content of AAJ ranged from 0.11 – 0.25mg/100g. The least thiamin content of 0.11mg/100g was obtained when AAJ was blanched for 15 secs, dried for 123,63min at a drying temperature of 65°C (Run 7) which the highest thiamin content (0.25mg/100g) was obtained when AAJ was treated for 15 secs blanching time, 56.36 min dry time and 65°C drying temperature (Run 3). The range of vitamin B1 (thiamin) in this research falls below the range of thiamin content of A. bisporus in , research which is 6-10 mg/kg. Response surface linear model for effect of blanching time, drying time and drying temperature on Thiamin content of AAJ.
The response surface linear model was effective in describing the effect of blanching time, drying time and drying temperature on the thiamin content of AAJ. Analysis of variance (table 2) shows that the linear model (F = 13.28; P = 0.0001) was significant (P<0.05). There was only a 0.01% chance that an F-value this large could occur due to noise. The coefficient of determination (R2 = 0.7134) which is also known as a degree of fit measurement that is beneficial for measuring the proportion of total variability explained by the model according to Shridhar et al, below 0.8. This implies that only 71.34% of the variations in the observed values of the thiamin content of AAJ were explained by the response surface linear model. The predicted R2 of 0.4692 was in reasonable agreement with the adjusted R2 of 0.6597, because the difference is less than 0.2, which implies that there was excellent correlation between the independent variables. The coefficient of variation (CV) value of 12.44% was above 10%, which implies that the results were less precise but reliable in making predictions. Adequate precision of 13.2129 implies that the model can be used to navigate the design space, because a ratio greater than 4 is desirable.
Effect of independent variables on thiamin content of AAJ
The regression for the effects of blanching time (X1), drying time (X2) and drying temperature (X3) on thiamin (Y14) content of AAJ is presented in Table 3 and the relationship could be expressed by equation (9).
Y14 = + 0.1800 – 0.0210X1 – 0.0216X2 – 0.0235X3 (9)
Blanching time (F = 12.05; P = 0.0032), drying time (F = 12.74; P = 0.0026) and drying temp (F = 15.03; P = 0.0013) were significant (P<0.05), thus, affecting the yield of thiamin content of AAJ.
A negative coefficient indicates negative effect on thiamin content of AAJ. Figure 7 clearly shows that increase in blanching time and drying time resulted in decreased thiamin content of AAJ. Similar observation was obtained in Figure 8. A decreased thiamin content with increased drying temperature.
Descriptive statistics on the Niacin content of AAJ
The niacin content of AAJ ranged from 0.51 to 1.17mg/100g (table 3). The highest niacin content of 1.17mg/100g was obtained when AAJ was treated using the following treatment conditions; blanching time of 15 secs; drying time of 56.36 min and drying temperature of 75°C (run 3) while the least niacin content (0.51mg/100g) was obtained using blanching time of 110 min and drying temperature of 75°C (Run 4). The highest value of vitamin B3 (niacin) in this research varies greatly with that found in Jawoska et al. Research work in which the value of niacin content in A. bisporus was 430mg/1kg both the independent variables and responses were fitted to regression model by performing the analysis of variance (ANOVA) to determine the individual effect on the responses of AAJ.
Both the independent variables and responses were fitted to a regression model by performing the analysis of variance (ANOVA) to determine the individual effects on the responses of AAJ.
Response surface linear model for effect of blanching time, drying time and drying temperature on Niacin content of AAJ.
The response surface 2FI (two factor interaction) model was the highest order model with significant terms when compared with other models. Analysis of variance of the 2FI model (Table 10) showed that the model (F = 75.28; P = 0.0001) was significant (P<0.05) and was effective in explaining the effect of independent variables on niacin content of AAJ. The 2FI model was predictable (R2 = 0.9720), explaining 97.20% variations in the observed values of niacin. Table 11 revealed that there was excellent correlation between the independent variables as predicted R2 of 0.8720 was in reasonable agreement with the adjusted R2 of 0.9591. The low C.V of 4.20% indicates that the experiment was precise and reliable.
Furthermore, adequate precision of 30.2982 indicates an adequate signal. A ratio greater than 4 is desirable; therefore, a ratio of 30.2982 implies that the 2FI model can be used to navigate the design space.
Effects of independent variables on Niacin content of AAJ
The regression for the effects of blanching time (X1), drying time (X2) and drying temperature (X3) on niacin (Y5) content of AAJ is known in Table 11 and the relationship could be expressed by equation (10).
Y15= +0.8615 – 0.0453X1– 0.1557X2– 0.1075X3– 0.0963X2X3(10)
Blanching time (F = 21.40; P = 0.0005), drying time (F = 252.42; P = 0.001), drying temperature (F = 120.35; P = 0.0001) and interaction of drying time and drying temperature (F = 56.51; P = 0.0001) had significant effects on the niacin content of AAJ. However, interactive effects of blanching time and drying time (F = 0.7720; P = 0.3955) and blanching time and dry temperature (F = 0.2382; P = 0.6336) had no significant effects on the niacin content of AAJ.
These effects were better explained by response surface plots. Figure 10 shows that the main effects of blanching time and drying time led to decreased niacin content of AAJ. Figure 11 shows that the main effect of drying temperature led to decreased niacin content of AAJ. The interactive effect of drying time and drying temperature resulted in decreased niacin content of AAJ.
6. Conclusion
Both independent variables and responses were fitted to a regression model by performing the analysis of variance (ANOVA) to determine the individual effects on the responses of AAJ.
The niacin effects of blanching and drying time led to decreased niacin and thiamin content of AAJ. Whereas increasing in drying temperature led to decreased riboflavin and soluble vitamin content of AAJ. This study confirms that the tree ear mushroom (AAJ) contains a good number of vitamins. The vitamin understudied (p>0.05) given the three independent variables; blanching time (X1), drying temperature (X2), and drying time (X3) exhibited significant differences in their concentration.
7. Recommendation
Government should organize the trainers workshop for Agricultural extension officers like those in Agricultural Development Projects (ADP) who are closer to the farmers who will in turn train the farmers on the cultivation and treatment of the mushroom AAJ.
Abbreviations

AAJ

Auricularia Auricula Judae

ADP

Aricultural Development Project

RSM

Response Surface Methodology

Conflicts of Interest
The authors declare no conflicts of interest.
References
[1] Bandoni, R. J. (1984). The Tremellales and Auriculariales: an alternative classification. Transactions of the Mycological Society of Japan. 25: 489-530.
[2] Bernas, E., Jaworska, G., Lisiewska, Z. (2006). Edible Mushrooms as a source of valuable Nutritive Constituents. ACTA Sci. Poly Technol. Aliment. 5(1), 5-20.
[3] Brian, P. L., Joshua, M. B., Brandon, P. M. (2013). Systematics of the genus Auricularia with an emphasis on species from the Sourthern United States; North American Fungi, 8(6): 1-25.
[4] Crosby, W. (2019). How to Preserve Mushrooms: 5 Awesome Methods to Know? Downloaded from
[5] Coskuner, Y., Ozdemir, Y. (2000). Acid and EDTA blanching effects on the essential element cow14, 2074-2076.
[6] Ergomul, GP. G., Akata, L, Kalyoncu, F., Engonnul, B. (2010). Fatty Acid Compoitions of six wild edible Musroom species. Sci. World Journal. 2013, Article ID 163964: 1-4.
[7] Han, P. (2008). Inhibitory effects of chlorosalicylic acid on mushroom tyrosinase and its antimicrobial activities. Food Chemistry, volume 107(2, 15), 797-803.
[8] Harding, P. (2008). Collins Mushroom. Miscellany. Publishers- Collins. 9780007828920: Amazon. Com: Books.
[9] Hou Xu jie, Chen Wei (2007). Optimization of extraction process of crude polysaccharide from Wild edible Bacu mushroom by response surface methodology. Journal of ScienceDirect vol. 72(67-74).
[10] Irina, A. K., Costa, R., Tatiana, K. K., Olga, N. G., Shi, Y. (2015). Chemical composition and nutritional Value of the mushroom Auricularia auIricula judae. Journal of Food Science and Nutrition Research, (8): 8: 478-482.
[11] Izli, N. (2014). Effect of different drying methods on drying characteristics, colour and microstructure properties of mushroom. Journal of Food and Nutrition Research, 53(2): 105–116.
[12] Lama, SC. (2020). 3 Nutritional Benefits of Wood Ear Mushrooms. Downloaded from
[13] Makau, C. (2017). Follow these steps to preserve your mushrooms for five years. Downloaded from
[14] Mohanan, C. (2011). Macro fungi of Kerala, Kerala forest. Research Institute Peechi, Kerala, India, 670. ISBN 81-85041-73-3, Research Gate.
[15] Mutukwa, I. (2014). Drying and Pretreatments Affect the Nutritional and Sensory Quality of Oyster Mushrooms. A Dissertation Submitted to the Graduate Faculty of the North Dakota State University of Agriculture and Applied Science (7-19). Fargo, North Dakota.
[16] Muyanja, C. (2014). Effects of pretreatment and drying methods on chemical composition and Sensory Evaluation of Oyster mushroom (pluerotus oestreatus) powder and soup. Institude of Food Science and Technology. Journal of Food Processing and Preservation. 10(1745-4549).
[17] Nicholls, D and Burroughs, R. (2011). Jelly Ear Fungus-Auricularia Auricula – Judae.
[18] Nwabueze, T. U. (2010). Review article: Basic Steps in Adapting Response Surface Methodology modelling for bioprocess optimization in the food system. International journal of food science and Technology 45(9): 1768-1776.
[19] Patel, S. and Goyal, A. (2012). Recents Developments in Mushrooms as anti-cancer therapeutics: a review; 3 Biotech, 2(1). 1-15.
[20] Panoff, L. (2020). Can You Freeze Mushrooms, and Should You? In Nutrition. Downloaded From
[21] Reis FS, Banos L, Martins A, and Ferreira ICFR. (2012) Chemical Composition and Nutritional Value of the most widely appreciated cultivated mushrooms: an inter- species comparative Study. Food Chem. Toxicol 50(2): 191-197.
[22] Ruhlman, M. (2009). "Blanching, Shocking, Refreshing". Downloaded from
[23] Xiao, H., Zhang, Q. (2017). Recent Developments and Trends in Thermal Blanching – A Comprehensive Review. In Information Processing in Agriculture, 4(2): 101–127.
[24] Zhang, J. J Li, Y, Zhou T. and Xu, D. (2016). Bioactivities and Health Benefits of Mushrooms mainly in China. Research Gate in molecules 21(7): 938.
Cite This Article
  • APA Style

    Michael, I. G., Okwoche, A. S., Mfam, M. E., Edem, C. E., Deg, O. J. D. (2025). The Effect of Independent Variables on the Vitamin Contents of Auricularia Auricula Judae (AAJ) Using Response Surface Methodology. International Journal of Food Engineering and Technology, 9(1), 1-19. https://doi.org/10.11648/j.ijfet.20250901.11

    Copy | Download

    ACS Style

    Michael, I. G.; Okwoche, A. S.; Mfam, M. E.; Edem, C. E.; Deg, O. J. D. The Effect of Independent Variables on the Vitamin Contents of Auricularia Auricula Judae (AAJ) Using Response Surface Methodology. Int. J. Food Eng. Technol. 2025, 9(1), 1-19. doi: 10.11648/j.ijfet.20250901.11

    Copy | Download

    AMA Style

    Michael IG, Okwoche AS, Mfam ME, Edem CE, Deg OJD. The Effect of Independent Variables on the Vitamin Contents of Auricularia Auricula Judae (AAJ) Using Response Surface Methodology. Int J Food Eng Technol. 2025;9(1):1-19. doi: 10.11648/j.ijfet.20250901.11

    Copy | Download

  • @article{10.11648/j.ijfet.20250901.11,
      author = {Inah Grace Michael and Ajoma Simon Okwoche and Mfam Egar Mfam and Ceasar Essien Edem and Otu John Deg Deg},
      title = {The Effect of Independent Variables on the Vitamin Contents of Auricularia Auricula Judae (AAJ) Using Response Surface Methodology},
      journal = {International Journal of Food Engineering and Technology},
      volume = {9},
      number = {1},
      pages = {1-19},
      doi = {10.11648/j.ijfet.20250901.11},
      url = {https://doi.org/10.11648/j.ijfet.20250901.11},
      eprint = {https://article.sciencepublishinggroup.com/pdf/10.11648.j.ijfet.20250901.11},
      abstract = {The study investigated the quality of tree ear mushroom or Auricularia auricula judae (AAJ) as affected by the pre-treatment blanching and drying. This pre-treatment technique was optimized using RSM in which the independent variables blanching time (hot water), drying temperature (hot air oven)), and responses were fitted to a second order regression model by performing the ANOVA to determine the individual effects of the variables on the responses of the AAJ. whereas the method of association of vitamin chemist as described by Kirk and Sawyer was used to determine the vitamin content of the tree ear mushroom riboflavin and thiamine contents were determined using spectrophotometric method while niacin analysis were carried out using the extracting method filter all the analysis The result revealed that the total vitamin content was observed to have the highest concentration, while riboflavin was the lowest with observed peak values of 4.63% and 0.04% respectively. This result strongly suggests that the fungus is rich and healthy which could be explored for beneficial purposes. And it is recommended that incentive should be given to farmers to cultivate much of the mushroom to meet their natural demands.},
     year = {2025}
    }
    

    Copy | Download

  • TY  - JOUR
    T1  - The Effect of Independent Variables on the Vitamin Contents of Auricularia Auricula Judae (AAJ) Using Response Surface Methodology
    AU  - Inah Grace Michael
    AU  - Ajoma Simon Okwoche
    AU  - Mfam Egar Mfam
    AU  - Ceasar Essien Edem
    AU  - Otu John Deg Deg
    Y1  - 2025/03/18
    PY  - 2025
    N1  - https://doi.org/10.11648/j.ijfet.20250901.11
    DO  - 10.11648/j.ijfet.20250901.11
    T2  - International Journal of Food Engineering and Technology
    JF  - International Journal of Food Engineering and Technology
    JO  - International Journal of Food Engineering and Technology
    SP  - 1
    EP  - 19
    PB  - Science Publishing Group
    SN  - 2640-1584
    UR  - https://doi.org/10.11648/j.ijfet.20250901.11
    AB  - The study investigated the quality of tree ear mushroom or Auricularia auricula judae (AAJ) as affected by the pre-treatment blanching and drying. This pre-treatment technique was optimized using RSM in which the independent variables blanching time (hot water), drying temperature (hot air oven)), and responses were fitted to a second order regression model by performing the ANOVA to determine the individual effects of the variables on the responses of the AAJ. whereas the method of association of vitamin chemist as described by Kirk and Sawyer was used to determine the vitamin content of the tree ear mushroom riboflavin and thiamine contents were determined using spectrophotometric method while niacin analysis were carried out using the extracting method filter all the analysis The result revealed that the total vitamin content was observed to have the highest concentration, while riboflavin was the lowest with observed peak values of 4.63% and 0.04% respectively. This result strongly suggests that the fungus is rich and healthy which could be explored for beneficial purposes. And it is recommended that incentive should be given to farmers to cultivate much of the mushroom to meet their natural demands.
    VL  - 9
    IS  - 1
    ER  - 

    Copy | Download

Author Information
  • Abstract
  • Keywords
  • Document Sections

    1. 1. Introduction
    2. 2. Literature Review
    3. 3. Materials and Methods
    4. 4. Data Analysis
    5. 5. Discussion of Findings
    6. 6. Conclusion
    7. 7. Recommendation
    Show Full Outline
  • Abbreviations
  • Conflicts of Interest
  • References
  • Cite This Article
  • Author Information