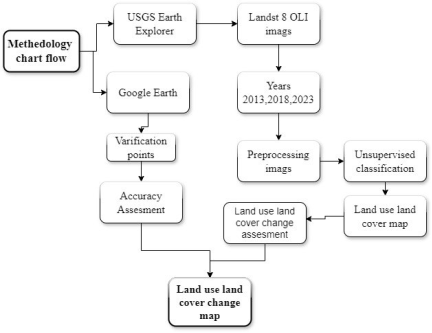
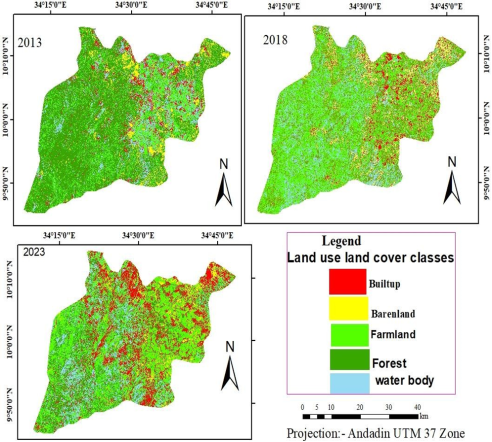
Land, with its intricate blend of geological, topographical, hydrological, and ecological elements, reflects the interplay of natural processes and human activities. In Ethiopia, traditional agricultural practices often lack systematic planning based on land suitability and physical characteristics, hindering agricultural productivity and economic progress. Understanding shifts in land use and cover is crucial for comprehending broader global transformations. Early studies have unveiled significant alterations in land use and cover between 2009 and 2013. Our investigation extends from 2013 to 2023, employing Landsat 8 imagery at three-year intervals (2013, 2018, and 2023) to analyze five key land cover categories: forests, farmland, built-up areas, barren land, and water bodies. Notably, farmland and built-up areas witnessed substantial expansion over these periods, juxtaposed with a significant decline in forest cover. Forests decreased by 27% from 2013 to 2018, with an additional 7% decrease from 2018 to 2023. Conversely, farmland expanded by 19% from 2013 to 2018 and by 2% from 2018 to 2023, while built-up areas saw respective increases of 4% and 10% over the same periods. These trends underscore potential environmental challenges if unaddressed. Effective land management strategies are crucial to mitigate adverse impacts on ecosystems, agricultural productivity, and overall socio-economic stability. By integrating scientific insights with sustainable practices, we can navigate the intricate dynamics of land use, paving the way for a resilient and prosperous future.
| Published in | International Journal of Environmental Protection and Policy (Volume 12, Issue 5) |
| DOI | 10.11648/j.ijepp.20241205.11 |
| Page(s) | 122-128 |
| Creative Commons |
This is an Open Access article, distributed under the terms of the Creative Commons Attribution 4.0 International License (http://creativecommons.org/licenses/by/4.0/), which permits unrestricted use, distribution and reproduction in any medium or format, provided the original work is properly cited. |
| Copyright |
Copyright © The Author(s), 2024. Published by Science Publishing Group |
Land Cover Change, Land Cover Types, Landsat 8, Land Use
LULC type | 2013 Area (hectare) | 2013 Area (%) | 2018 Area (hectare) | 2018 Area (%) | 2023 Area (hectare) | 2023 Area (%) |
|---|---|---|---|---|---|---|
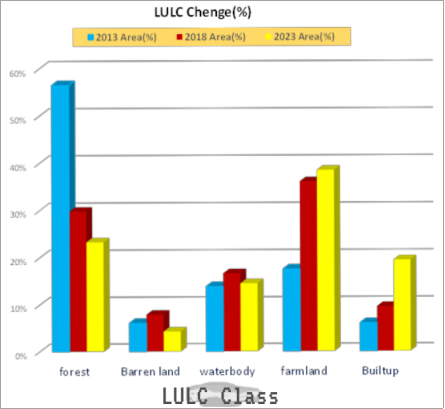
Forest | 116129.7 | 57% | 64182.4 | 30% | 47829.2 | 23% |
Barren land | 8790.07 | 6% | 17003.5 | 8% | 8790 | 4% |
waterbody | 28439.2 | 14% | 35849.2 | 17% | 29785.2 | 15% |
farmland | 35950.9 | 18% | 77698.6 | 36% | 79016.5 | 38% |
Built-up | 12383.3 | 6% | 20604.8 | 10% | 39906.87 | 19% |
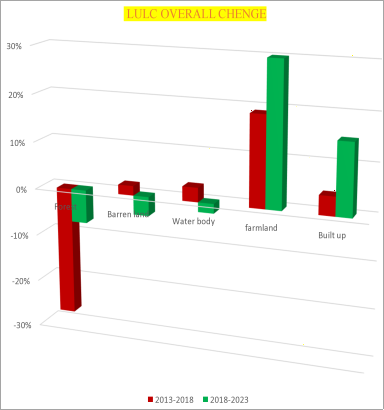
Land use | per (%) change 2013-2018 | per (%) change 2018 -2023 |
|---|---|---|
Forest | -27% | -7% |
Barren land | 2% | -4% |
Waterbody | 3% | -2% |
Farmland | 19% | 30% |
Built-up | 4% | 15% |
GIS | Geographic Information System |
BGRS | Benishangul-Gumuz Regional State |
LULC | Land Use and Land Cover |
masl | Meters Above Sea Level |
RWH | Rainwater Harvesting |
USGS | United States Geological Survey |
| [1] | Sati, V. P. (2014). Land-use/cover changes in the kewer gadhera sub-watershed, Central Himalaya. Impact of global changes on mountains, CRC Press, Taylor & Francis Group, 298-311. |
| [2] | Aynekulu, E., Wubneh, W., Birhane, E., & Begashaw1, N. (2006). Monitoring and evaluating land use/land cover change using Participatory Geographic Information System (PGIS) tools: A case study of Begasheka Watershed, Tigray, Ethiopia. The Electronic Journal of information systems in developing countries, 25(1), 1-10. |
| [3] | Mustard, J. F., Defries, R. S., Fisher, T., & Moran, E. (2012). Land-use and land-cover change pathways and impacts. In Land change science: Observing, monitoring and understanding trajectories of change on the earth’s surface (pp. 411-429). Dordrecht: Springer Netherlands. |
| [4] | Arowolo, A. O., Deng, X., Olatunji, O. A., & Obayelu, A. E. (2018). Assessing changes in the value of ecosystem services in response to land-use/land-cover dynamics in Nigeria. Science of the total Environment, 636, 597-609. |
| [5] | Hassan, Z., Shabbir, R., Ahmad, S. S., Malik, A. H., Aziz, N., Butt, A., & Erum, S. (2016). Dynamics of land use and land cover change (LULCC) using geospatial techniques: a case study of Islamabad Pakistan. SpringerPlus, 5, 1-11. |
| [6] | Goudie, A. S. (2018). Human impact on the natural environment. John Wiley & Sons. |
| [7] | Moran, E. F. (2016). People and nature: An introduction to human ecological relations. John Wiley & Sons. |
| [8] | Bebbington, A. J., Humphreys Bebbington, D., Sauls, L. A., Rogan, J., Agrawal, S., Gamboa, C.,... & Verdum, R. (2018). Resource extraction and infrastructure threaten forest cover and community rights. Proceedings of the National Academy of Sciences, 115(52), 13164-13173. |
| [9] | Mekasha, S. T., Suryabhagavan, K. V., & Gebrehiwot, M. (2020). Geo-spatial approach for land-use and land-cover changes and deforestation mapping: a case study of Ankasha Guagusa, Northwestern, Ethiopia. Tropical Ecology, 61, 550-569. |
| [10] | Barton, A. (2014). Deforestation in Ethiopia. Exploring regional sustainable development issues. Using the case study approach in higher education., 205. |
| [11] | Tesfaye, G., Teketay, D., Fetene, M., & Beck, E. (2010). Regeneration of seven indigenous tree species in a dry Afromontane forest, southern Ethiopia. Flora-Morphology, Distribution, Functional Ecology of Plants, 205(2), 135-143. |
| [12] | Sloan, S., & Sayer, J. A. (2015). Forest Resources Assessment of 2015 shows positive global trends but forest loss and degradation persist in poor tropical countries. Forest Ecology and Management, 352, 134-145. |
| [13] | Zerga, B., Workineh, B., Teketay, D., & Woldetsadik, M. (2019). The Role of Community on Forest Management in Ethiopia: The case of Yotyet/Yewezera Community Forest. IJCN, 2, 10. |
| [14] | Yalew, A. W. (2015). The perplex of deforestation in sub-Saharan Africa. Journal of Tropical Forestry and Environment, 5(1). |
| [15] | Bessie, S., Beyene, F., Hundie, B., Goshu, D., & Mulatu, Y. (2016). Land use/land cover change and its effects on bamboo forest in benishangul gumuz region, Ethiopia. International Journal of Sustainable Development & World Policy, 5(1), 1-11. |
APA Style
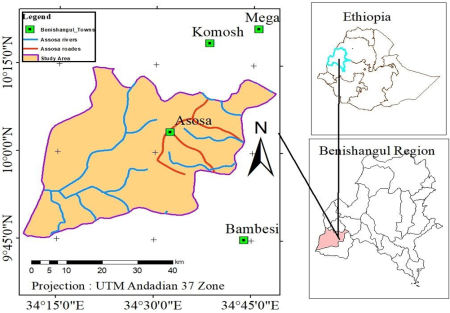
Amsalu, G., Mekonen, Y. (2024). GIS-Based Land Use and Land Cover Change Assessment Around Assosa District, Upper Blue Nile Basin, Ethiopia. International Journal of Environmental Protection and Policy, 12(5), 122-128. https://doi.org/10.11648/j.ijepp.20241205.11
ACS Style
Amsalu, G.; Mekonen, Y. GIS-Based Land Use and Land Cover Change Assessment Around Assosa District, Upper Blue Nile Basin, Ethiopia. Int. J. Environ. Prot. Policy 2024, 12(5), 122-128. doi: 10.11648/j.ijepp.20241205.11
AMA Style
Amsalu G, Mekonen Y. GIS-Based Land Use and Land Cover Change Assessment Around Assosa District, Upper Blue Nile Basin, Ethiopia. Int J Environ Prot Policy. 2024;12(5):122-128. doi: 10.11648/j.ijepp.20241205.11
@article{10.11648/j.ijepp.20241205.11,
  author = {Genet Amsalu and Yimam Mekonen},
  title = {GIS-Based Land Use and Land Cover Change Assessment Around Assosa District, Upper Blue Nile Basin, Ethiopia
},
  journal = {International Journal of Environmental Protection and Policy},
  volume = {12},
  number = {5},
  pages = {122-128},
  doi = {10.11648/j.ijepp.20241205.11},
  url = {https://doi.org/10.11648/j.ijepp.20241205.11},
  eprint = {https://article.sciencepublishinggroup.com/pdf/10.11648.j.ijepp.20241205.11},
  abstract = {Land, with its intricate blend of geological, topographical, hydrological, and ecological elements, reflects the interplay of natural processes and human activities. In Ethiopia, traditional agricultural practices often lack systematic planning based on land suitability and physical characteristics, hindering agricultural productivity and economic progress. Understanding shifts in land use and cover is crucial for comprehending broader global transformations. Early studies have unveiled significant alterations in land use and cover between 2009 and 2013. Our investigation extends from 2013 to 2023, employing Landsat 8 imagery at three-year intervals (2013, 2018, and 2023) to analyze five key land cover categories: forests, farmland, built-up areas, barren land, and water bodies. Notably, farmland and built-up areas witnessed substantial expansion over these periods, juxtaposed with a significant decline in forest cover. Forests decreased by 27% from 2013 to 2018, with an additional 7% decrease from 2018 to 2023. Conversely, farmland expanded by 19% from 2013 to 2018 and by 2% from 2018 to 2023, while built-up areas saw respective increases of 4% and 10% over the same periods. These trends underscore potential environmental challenges if unaddressed. Effective land management strategies are crucial to mitigate adverse impacts on ecosystems, agricultural productivity, and overall socio-economic stability. By integrating scientific insights with sustainable practices, we can navigate the intricate dynamics of land use, paving the way for a resilient and prosperous future.
},
 year = {2024}
}
TY  - JOUR
T1  - GIS-Based Land Use and Land Cover Change Assessment Around Assosa District, Upper Blue Nile Basin, Ethiopia

AU  - Genet Amsalu
AU  - Yimam Mekonen
Y1  - 2024/09/20
PY  - 2024
N1  - https://doi.org/10.11648/j.ijepp.20241205.11
DO  - 10.11648/j.ijepp.20241205.11
T2  - International Journal of Environmental Protection and Policy
JF  - International Journal of Environmental Protection and Policy
JO  - International Journal of Environmental Protection and Policy
SP  - 122
EP  - 128
PB  - Science Publishing Group
SN  - 2330-7536
UR  - https://doi.org/10.11648/j.ijepp.20241205.11
AB  - Land, with its intricate blend of geological, topographical, hydrological, and ecological elements, reflects the interplay of natural processes and human activities. In Ethiopia, traditional agricultural practices often lack systematic planning based on land suitability and physical characteristics, hindering agricultural productivity and economic progress. Understanding shifts in land use and cover is crucial for comprehending broader global transformations. Early studies have unveiled significant alterations in land use and cover between 2009 and 2013. Our investigation extends from 2013 to 2023, employing Landsat 8 imagery at three-year intervals (2013, 2018, and 2023) to analyze five key land cover categories: forests, farmland, built-up areas, barren land, and water bodies. Notably, farmland and built-up areas witnessed substantial expansion over these periods, juxtaposed with a significant decline in forest cover. Forests decreased by 27% from 2013 to 2018, with an additional 7% decrease from 2018 to 2023. Conversely, farmland expanded by 19% from 2013 to 2018 and by 2% from 2018 to 2023, while built-up areas saw respective increases of 4% and 10% over the same periods. These trends underscore potential environmental challenges if unaddressed. Effective land management strategies are crucial to mitigate adverse impacts on ecosystems, agricultural productivity, and overall socio-economic stability. By integrating scientific insights with sustainable practices, we can navigate the intricate dynamics of land use, paving the way for a resilient and prosperous future.

VL  - 12
IS  - 5
ER  -
Department of Geology, College of Natural and Computational Sciences, Assosa University, Assosa, Ethiopia
Department of Soil Resource and Watershed Management, College of Agriculture and Natural Resource, Assosa University, Assosa, Ethiopia
Information