2. Simplified Radiation Concentration Model
A simplified model is usually created in the form of an imaginary object that simulates a real process and allows for an easy way to formulate mathematical equations that describe the process in a quantitative way. Such a radiation concentration model, originally proposed by Petela
| [3] | Petela, R. (2010) Engineering Thermodynamics of Thermal Radiation, for Solar Power Utilization. McGraw Hill. |
[3]
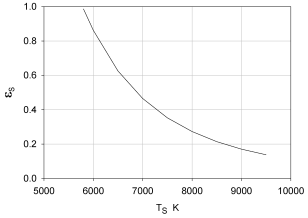
, was here developed here to analyze the concentration of extraterrestrial solar radiation coming from the Sun's surface with a constant temperature of
TS=7134 K, energetic emissivity ԑ=0.431 and exergetic emissivity
ԑB,S=0.426.
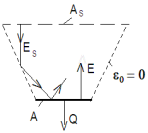
The model consists of the three surfaces shown in
Figure 1.
The first surface, with an area of AS, simulating the surface of the Sun with its properties experienced by the Earth, is a certain imaginary surface that represents the radiation energy ES, coming from the Sun. (The symbol A used for any surface can mean its area and the designation of this surface). The surface AS reflects radiation from surface A at a very small solid angle (like the far Sun), so the energy of these reflections can be ignored.
Figure 1. Scheme of Radiation Concentration.
The second surface of area A simulates the acquisition of usable heat in the concentration process. The surface area ratio AS and A is the concentration ratio, aS = AS/A. Surface A, irradiated only by the surface AS, partially reflects solar radiation, emits its own energy E, and is cooled by the usable heat Q, W. Surface A is gray, with an emissivity of ε. The temperature T of surface A is controlled by cooling at certain heat rate q, W/m2.
The vacuum space between the two surfaces (AS and A) is enclosed by a third surface, simulating a concentration device. This surface is the side of an inverted truncated cone and is perfectly mirror-like (ε0=0) on both sides. Such an assumption means that there is no penetration of radiation from the environment and no escape of radiation from surfaces AS to the environment. The cone should be high enough so that all the radiation of surface AS goes only to the surface A. In practice, for example, the surface AS can represent all mirrors directing solar radiation to a certain surface A, from which heat is used to generate steam for a power plant.
The real energy
where the emission
e, W/m
2, of the Sun’s black surface at temperature
TS, is calculated according to the Stefan-Boltzmann formula
| [3] | Petela, R. (2010) Engineering Thermodynamics of Thermal Radiation, for Solar Power Utilization. McGraw Hill. |
[3]
:
where σ = 5.6693×10⁻⁸ W/(m2 K4) is the Boltzmann constant for black radiation, and TS, in K, is the temperature of the Sun’s surface. The exergy bE of solar radiation reaching the Earth can be calculated using the formula analogous to (1), in which instead of e, the exergy b, W/m2, for a black surface is introduced:
where
b is expressed by the Petela formula
| [3] | Petela, R. (2010) Engineering Thermodynamics of Thermal Radiation, for Solar Power Utilization. McGraw Hill. |
[3]
:
(4)
where T0, K, is the ambient temperature.
In the study of radiation processes, the energy or exergy balance of the radiating surface can be used. In this case, the balanced system is very simple, since it is a layer of infinitesimal volume in which nothing is accumulated and the energy supplied is always equal only to the energy carried out. Thus, the energy balance of surface A considers the solar energy supplied to this surface, which is equal to its reflected part, the energy emitted by surface A and the absorbed heat. Thus:
,(5)
where ԑ and ԑS is the energetic emissivity of surface A and AS, respectively, and q W/m2 is the heat rate at surface A. The total heat Q, W, extracted from surface A:

.
(6) The heat rate
q is an important variable that strongly influences the temperature
T of the surface A and thus controls the utilization of concentrated radiation. The heat rate can be determined by designing the coolant flow rate and the temperature differences in the heat exchanger used as a usable heat source. The heat rate can be designed with a value in a wide range. For example, the coefficient of heat transfer from the surface to the fluid can range from a few to 100,000 W/m
2,
| [16] | Petela R. (1983) Przeplyw Ciepla. PWN, Warsaw. |
[16]
.
The energetic efficiency ηE of solar radiation concentration can be determined as the ratio of the absorbed heat Q to the solar radiation energy reaching the surface A:
.(7)
For comparison, the exergetic efficiency ηB can also be considered based on the following definition:
where the exergy
BQ of the heat absorbed by the surface
A is
| [3] | Petela, R. (2010) Engineering Thermodynamics of Thermal Radiation, for Solar Power Utilization. McGraw Hill. |
[3]
:
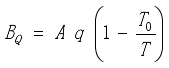
,
(9) and the exergy
BS of solar radiation, based on (
3), is:
,(10)
where the exergetic emissivity of the Sun’s surface
ԑB,S = 0.426,
.
The feasibility of the discussed effect of solar radiation concentration can be evaluated by the calculated value of the sum Π of entropy increments, which consists of positive (generated) entropy of heat, and emission of surface A, as well as negative (disappearing) entropy of absorbed solar radiation:
.(11)
It was assumed that the entropic emissivity
ԑN and
ԑN,S corresponding to the surfaces
A and
AS, is approximately equal to the corresponding energetic emissivity:
ԑN≈
ԑ and
ԑN,S ≈
ԑS, .
The sum of entropy increments given by equation (
11) should be positive (
Π>0). If this sum is not positive (
Π≤0), it means that the concentration of solar radiation is impossible because it goes against the second law of thermodynamics.
4. Examples of Using the Model to Analyze the Parameters of the Concentration process
4.1. Effect of Concentration Ratio of Radiation
The purpose of these calculations is to show the effect of the variable concentration ratio aS on the results of extraterrestrial solar radiation concentration. The greater the ratio, the greater the concentration. But there is a question of what happens, for example, with the absorbed heat, its temperature and the efficiency of the concentration process when the ratio aS increases, and what is the limit of its increase. The calculations use formulas describing the presented model of radiation concentration, assuming an area AS=1 m2 and an ambient temperature T0=300 K.
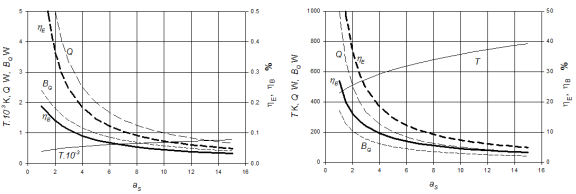
The left part of
Figure 3 shows some concentration effects in the case of relatively mild cooling of the surface
A, (
q= 10 W/m
2K), and emissivity
ԑ=0.8. As the concentration ratio increases (
aS increases from 1 to 15),
1) the temperature T of the surface A increases monotonically from 395 to 776 K,
2) the absorbed heat Q decreases from 10 to 0.7 W,
3) the exergy BQ of this heat decreases from 2.4 W to 0.4 W,
4) accordingly to the Q, the energetic efficiency ηE decreases from 0.73 to 0.05%,
5) and accordingly to BQ, the exergetic efficiency ηB decreases from 0.19 to 0.03%.
For comparison, the right part of
Figure 3 shows the effects in the case of the stronger cooling of surface
A, (
q=1000 W/m
2K) and emissivity
ԑ=0.9. As the concentration ratio increases (
aS increases from 1 to 15),
1) the temperature T of the surface A, is higher and increases monotonically now from 450 K to 786 K,
2) the absorbed heat Q is higher but due to the decreasing surface area A decreases from 1000 W to 67 W,
3) accordingly to the Q, the exergy BQ of this heat decreases from 344 to 42 W,
4) also, accordingly to Q, the energetic efficiency ηE decreases from 73.1 to 4.9%, and
5) accordingly to BQ, the exergetic efficiency ηB, drops from 27 to 3.2%.
Figure 3. Examples of effects of solar radiation concentration, left (q=10 W/m2K, ԑ=0.8) and right (q=1000 W/m2K, ԑ=0.9).
A comparison of the two diagrams in
Figure 3 shows that as the heat rate
q increases (from 10 to 1000 W/m
2K),
1) the temperature T increases because of greater emissivity ԑ of the surface A,
2) the total heat Q also increases,
3) and the exergy BQ of heat Q increases,
4) thus, also the energy efficiency ηE increases, and
5) the exergetic efficiency ηB, increases although it reveals the real estimation of the process and in both cases, it is much lower than the energetic efficiency. In addition, the energy and exergetic efficiency for mild cooling are less than those efficiencies for intensive cooling, respectively, indicating that the considered example of this intensive cooling is more efficient than the considered mild cooling.
In general, the considered comparison shows that the more intense the heat transfer from the surface A, the better the concentration process.
4.2. Entropic Approach to the Radiation Concentration Process
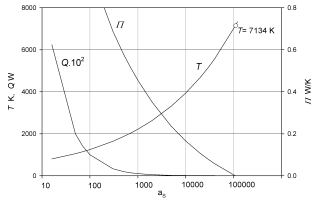
As shown in
Figure 4, the temperature
T of the surface A cannot reach a value higher than the solar radiation temperature of 7134 K. With the increase in the concentration ratio
aS, the sum 𝛱 of entropy increments, calculated by Equation (
11), decreases continuously and for the value of 7134 K becomes equal to zero (𝛱=0) with a concentration ratio of about
aS=107431. A further increase in
aS results in a negative value of the sum of entropy increments, (𝛱 < 0), which means that it would go against the second law of thermodynamics. For example, the impossible temperature
T= 7200 K would require a negative value of 𝛱= -1.876×10
-3 W/K.
Figure 4 shows that as
aS increases, the heat
Q decreases, and as calculations show, for the also unreachable theoretical limit case of 𝛱=0, the total heat rate is only around
Q=0.9 W, due to the very small surface area
A.
Figure 4. Limit concentration for solar radiation (AS=1, ԑ=0.8, q=1000 W/m2K, T0=300 K).
In practice, a certain temperature
T is usually required, and the highest possible emissivity value
ԑ can be arranged by selecting the proper surface material. Therefore, assuming a constant values of temperature
T and emissivity
ԑ, Equation (
11) can be attempted to be used for optimization to find the minimum sum 𝛱
min of entropy increments. Equation (
11) is treated as a function of (
q,
aS), for which 𝛱
min would result from the following conditions:
and,(14)
which, (q = - 4 ԑ σ T4/3, and AS=0) do not indicate the existence of an optimal value of 𝛱min. In such a situation, the concentration process could, for example, be designed by assuming the temperature T, using an absorbing surface with a given emissivity ԑ, and then, by varying the heat transfer intensity (q), determine the acceptable concentration ratio aS and other process parameters, such as total heat or efficiency.
4.3. Energy and Exergy Balances of Radiation Concentration Process
Radiation concentration is a process that can be the subject of thermodynamic analysis
| [2] | Petela, R. (2021) Thermodynamic Analysis of Processes. Solar Co-generation of Electricity and Water, Large Scale Photovoltaic Systems. In: UNESCO-EOLSS Joint Committee, Eds., Encyclopedia of Life Support Systems (EOLSS), EOLSS Publishers, 41 p. http://www.eolss.net |
[2]
using the first and second laws of thermodynamics. This analysis is based on the equations of conservation of energy and exergy. In general, the developing of an energy and exergy balances allows for a better understanding of the process, facilitates its design and control, determines the degree of perfectness and the need for process improvement and optimization, and thus also allows for process motivation. To perform thermodynamic analysis, it is required to define the system under consideration. For the process of radiation concentration, such a system can be a radiating-absorbing surface, which is surface
A in
Figure 1. This system is therefore an infinitely thin layer into which energy and exergy are only delivered or carried out. The energy balance of such a system was expressed by Equation (
5):
.(15)
Equation (
5) shows the radiant energy delivered to the surface
A (the left side of this Equation) as equal to the terms on the right side of this Equation, which are the energy reflected from surface
A, the energy emitted by that surface and the heat transferred from that surface.
The equation of the exergy balance is analogous to the equation of energy (
5), except that on the right side it contains an additional term representing the irreversibility of the phenomenon of concentration, which is determined as the product of the sum 𝛱 of entropy increments (Equation
13), and the ambient temperature:
.(16)
It has been assumed that the exergetic emissivity
ԑB of surface
A is approximately equal to the energetic emissivity of this surface,
ԑB ≈
ԑ,
.
Equations (
5) and (
16) can be illustrated using a band diagram (Sankey diagram).
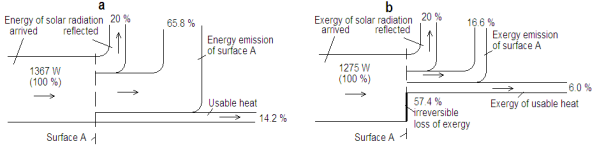
Figure 5 shows the energy balance (part a) and the exergy balance (part b) in the case of mild cooling (left part of
Figure 3). For both diagrams, the situation was chosen at
aS = 3 and
ԑ=0.8, in which the surface A has temperature
T= 494 K. Solar radiation energy of 1367 W, (100%), is delivered to the system, from which the reflected radiation energy of 20%, the emitted radiation energy of 65.8%, and the usable heat of 14.2%, equal to the energetic efficiency, are carried out.
Part b of
Figure 5 shows the solar radiation exergy of 1275 W, (100%), delivered to the system, from which reflected radiation exergy 20%, the emitted radiation exergy 16.6%, and usable heat exergy 6.0%, equal to exergetic efficiency, are carried out. The balance closes with an exergy loss of 57.4% due to the irreversibility of the process. It should be noted that energy consideration does not reveal any losses. Only an exergetic analysis reveals the degradation of solar energy.
Figure 5. Band diagrams for mild cooling, (aS= 3, q=582 W/m2K, T=494 K).
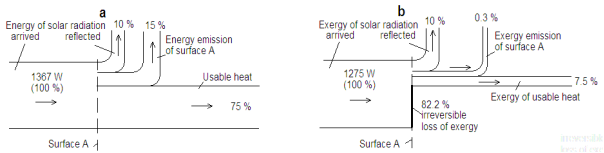
Figure 6. Band diagrams for intensive cooling, (aS=3, q=3100 W/m2K, T=331 K).
Figure 6, analogous to
Figure 5, shows the energy balance (part a) and the exergy balance (part b) for the case of intensive cooling (right part of
Figure 3). For both diagrams, the situation at
aS= 3 and
ԑ=0.9 was chosen, in which the temperature of surface
A is
T= 331 K. The system is delivered with solar radiation energy of 1367 W, (100%), and the reflected radiation energy of 10%, the energy of emitted radiation of 15%, and the usable heat of 75%, equal to the energetic efficiency, are carried out.
Part b of
Figure 6 shows the exergy of solar radiation of 1275 W, (100%), delivered to the system, from which the exergy of reflected radiation 10%, the exergy of the emitted radiation 0.3%, and the exergy of usable heat 7.5%, equal to the exergetic efficiency, are carried out. The balance equation closes with an exergy loss of 82.2% due to the irreversibility of the concentration process. This loss is greater compared to the previous case (
Figure 5), due to the greater degradation of solar radiation, (to a lower temperature 331 K).
The diagrams shown in the two
Figures 5 and 6 compare two very different concentration processes, in which the concentration ratio is the same,
aS=3, but the heat received from the surface
A is different. Different heat transfer intensities were used in these processes. In the first one, the heat transfer was mild,
q=582 W/m
2K, and in the second one, intensive heat transfer was used,
q=3100 W/m
2K. On all diagrams the energy and exergy of the incoming solar radiation do not differ much, and the exergy-to-energy ratio for the surface temperature of the Sun,
TS=7134 K, is 1275/1367= 0.9329. The emission of energy (in W) from the Sun is correspondently greater than the emission of exergy. On the diagrams, these values are assumed to be 100%.
The reflected solar energy is 20 and 10% respectively in
Figures 5 and 6, as is the reflected exergy in these Figures. This is due to the correspondently different emissivity of surface
A, (
ԑ=0.8 and
ԑ=0.9). The energy emission from surface
A is always greater than the exergy emitted.
The emitted energy in
Figure 5 is relatively high and amounts to 65.8%, due to the temperature of this surface,
T=494 K, but the exergy of this emission at such a temperature is only 16.6%. The usable heat is relatively low (14. 2%), due to the mild cooling of the surface
A, (
q=582 W/m
2K), and exergy of this heat is lower (6%), as is equal to this heat multiplied by the Carnot factor, (1-
T0/
T). Process perfectness (
Figure 5) is estimated by the value of exergy loss, (57.4%). Displaying such irreversibility of the process is an advantage of exergetic analysis. The energy diagram does not reveal any energy loss, because the energy has no ability of displaying the degradation of energy.
Figure 6 shows the diagrams of the concentration process at a lower temperature of surface
A, (T=331 K). However, despite the higher energetic emissivity (
ԑ=0.9) of surface
A, the energy emission is lower (15%) and the emission of exergy, (0.3%), is correspondently smaller. Intensive heat transfer (
q=3100 W/m
2) results in a large amount of usable heat, (75%), the practical value of which, however, measured by exergy, is only 7.5%. Obviously, there is no loss of energy, while the exergy balance shows a relatively very large loss of exergy (82.2%) due to the irreversibility of the process caused by the significant degradation of solar radiation from temperature 7134 to 431 K and due to intensive heat transfer.
The portion of solar radiation reflected from surface A has an unchanged spectrum and temperature, and therefore this reflection is a reversible phenomenon that does not cause exergy losses. For the same reason all the reflections from cone surface of the model in
Figure 1, are reversible, not changing solar radiation arriving finally in surface A.
Thus, the irreversibility of the concentration process occurs only due to the other two phenomena. The first, is the absorption of solar radiation into the heat Q’ transferred from surface A, and the second, is the change of the heat Q” into the emission of surface A. The effective heat Q= Q’- Q” is used in the energy balance Equation (5), (Q=A q). Based on the law of energy conservation, heat Q’ is equal to the energy of absorbed solar radiation, and heat Q” is equal to the energy emitted. The values of each of exergy loss (in W) due to irreversibility is calculated by multiplying of the respective increase of entropy by the ambient temperature T0. The respective entropy increments are determined based on the terms of the right side of Equation (11). Exergy loss δB’ due to absorption:
=(17)
and exergy loss δB” due to emission on surface A:
(18)
For example, in the case of mild cooling (
q=582 W/m
2K), Equation (
17) yields δ
B’ ≈ 603 W, (44.3%), and Equation (18) yields δ
B” ≈ 182 W, (13.1%). Similarly, in the case of intensive cooling (
q=3100 W/m
2K), δ
B’ ≈ 1000 W, (78.1%), and δ
B” ≈ 55 W, (4.1%), are obtained. The main irreversibility in the radiation concentration process is due to adsorption of solar radiation and the greater the irreversibility, the lower the temperature
T of the heated surface A.
4.4. Optimal Temperature of the Heated Surface
The introduced mathematical model of radiation concentration can be used in various ways.
Figures 5 and 6, using the band diagrams, show energy and exergy balances of the concentration process for the assumed two values of temperature
T (494 and 331 K) of heated surface
A. However, for example, the items of band diagrams can be shown over a wide range as a function of this temperature
T.
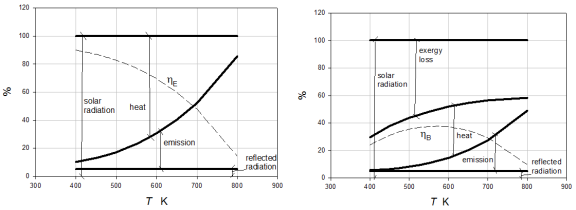
Figure 7 shows the balance items for temperature
T in the range of 400 to 800 K, assuming
ԑ=0.95,
aS=20 and
T0=300. As shown in
Figure 7, only the exergetic balances disclose a certain optimal temperature
Topt. The calculation of this optimal temperature can be based on Equation (8) for exergetic efficiency, in which
BQ is determined by Equation (9),
BS is determined by Equation (10) and
Q is expressed from the energy balance Equation (
5). Then the condition for the occurrence of the optimum is:
,(19)
of which Topt= 562.3 K.
Figure 7. Energetic balances (left) and exergetic balances (right) of the heated surface A.
As can be seen in
Figure 7 (left), as the temperature
T of surface
A increases, the exergy emission of this surface increases, which reduces the heat absorbed by this surface and hence the energetic efficiency
ηE decreases monotonically. High energetic efficiency
ηE= 90%, for
T=400 K, decreases with increasing temperature
T and reaches 14.3% for
T= 800 K.
Figure 7 (right) shows an exergetic interpretation of the concentration process and, above all, its significant imperfectness, manifested by a relatively large loss of exergy, which however, decreases with the increase in temperature
T. Compared to the energetic point of view, the exergy of emission is of lesser importance, and the practical value of the absorbed heat, expressed by the exergy value of this heat, reveals a maximum corresponding to the optimum exergetic efficiency
ηB,opt= 37.7%, (for
T= 575 K).
4.5. Effect of the Emissivity on the Heated Surface
Another example of the application of the presented model may be the determination of the effect of the emissivity
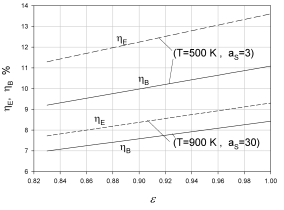
ԑ of the heated surface A on the efficiency of the radiation concentration process. The results of the calculations are shown in
Figure 8.
Figure 8. Example of the effect of emissivity ԑ on energetic efficiency ηE and exergetic efficiency ηB.
Both energetic and exergetic efficiency increase with the increase in emissivity ԑ of surface A. However, these efficiencies decrease with an increase in the required temperature T, and an increase in this temperature T requires an increase in the concentration ratio aS.
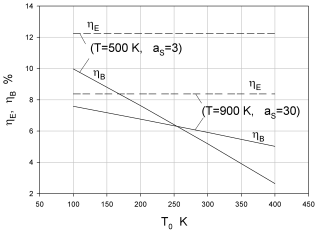
4.6. Effect of Ambient Temperature
The presented model can also be used to determine the influence of the ambient temperature T0 on the radiation concentration process.
Figure 9. Example of the influence of ambient temperature T0 on energetic efficiency ηE and exergetic efficiency ηB, (ԑ=0.9).
Geographical location, weather or season have an impact on the ambient temperature
T0. Based on the calculations,
Figure 9 shows an example of the influence of the ambient temperature
T0 on the energetic efficiency
ηE and exergetic
ηB efficiency, when the emissivity of the surface
A is equal to
ԑ=0.9. Energetic efficiency is insensitive to ambient temperature. However, the exergetic efficiency is the greater the lower is the ambient temperature, and theoretically for
T0=0 it would be equal to the energetic efficiency, because the exergy radiation at such a temperature is equal to energy.
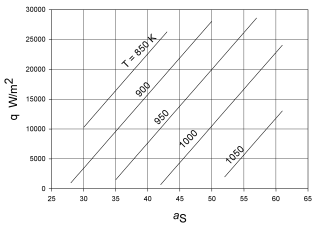
4.7. Temperature of the Heated Surface
The most important goal of the process of concentration of solar radiation seems to be to obtain the required value of temperature
T of the heated surface
A. The presented model allows to determine this temperature as a function of the concentration ratio
aS and heat rate
q, as shown in
Figure 10. To obtain the required temperature
T, a certain minimum concentration ratio of
aS is required, and then the total heat
Q is produced in proportion to the applied heat rate
q.
For example, if a temperature of T=1000 K is needed, then using the concentration ratio aS = 44, a heat rate of q=3112 W/m2 is required to obtain the total heat Q = q/aS = 3112/44 = 70.7 W. This means that solar radiation arriving within a cross-section area of 1 m2, concentrated on the irradiated surface with an area of A=1/44= 0.0227 m2, allows the generation of heat Q= 70.7 W.
However, to obtain the same temperature T= 1000 K, one can use, for example, the concentration ratio aS= 56, and then from the area of A = 1/56 = 0.0179 m2, at q = 17877 W/m2, obtain the heat Q= 17877/56 = 319 W.
Figure 10. The temperature T of the heated surface A, (ԑ=0.9), as a function of concentration ratio aS and heat rate q.
The diagram in
Figure 10, can also be used to determine the required concentration ratio
aS for a given value of
q to obtain the required temperature
T. Another possibility of using the diagram is to predict the temperature
T for the given values of
aS and
q.