This study focuses on the desertification areas of Talatan and Mugetan, located on both sides of the Longyangxia Reservoir in Qinghai Province, China. These areas pose serious threats to the safety of the reservoir due to frequent wind-sand activities. The research aims to provide a scientific basis for effective sand control by deeply analyzing the dynamic change of wind.The wind speed and direction data from Shazhuyu and Guinan meteorological stations in Qinghai Province, China were used to calculate the numerical and directional characteristics of sand-driving wind and sand drift potential.The results indicate that: (1) The number of sand-driving wind at Talatan is about 7 times that at Mugetan, and the maximum and average wind speeds are about 7 m/s larger than those at Mugetan. At Talatan, the primary sand-driving wind direction is exclusively West Northwest (WNW). Conversely, at Mugetan, the sand-driving wind direction remains westward in spring, autumn, and winter, shifting eastward solely in summer. (2) The annual sand drift potential of Talatan and Mugetan is less than 200VU, two sandy areas are both in low wind energy environments; (3) The major causes of the significant differences in sand-driving wind regimes between the Talatan and Mugetan are topography, precipitation, wind direction stability.These conclusions offer valuable insights for developing targeted sand control strategies, thereby mitigating the potential hazards posed by wind-sand activities to the Longyangxia Reservoir and its surrounding ecosystems.
| Published in | International Journal of Environmental Monitoring and Analysis (Volume 12, Issue 4) |
| DOI | 10.11648/j.ijema.20241204.12 |
| Page(s) | 74-87 |
| Creative Commons |
This is an Open Access article, distributed under the terms of the Creative Commons Attribution 4.0 International License (http://creativecommons.org/licenses/by/4.0/), which permits unrestricted use, distribution and reproduction in any medium or format, provided the original work is properly cited. |
| Copyright |
Copyright © The Author(s), 2024. Published by Science Publishing Group |
Sand-Driving Wind, Sand Drift Potential, Wind Regime, The Longyangxia Reservoir
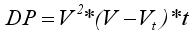 (1)
(1) 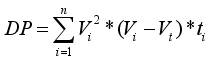 (2)
(2) Shazhuyu | Guinan | |||||||
|---|---|---|---|---|---|---|---|---|
Maximum wind speed | Average wind speed | Number of sand-driving wind events | Sand-driving wind frequency | Maximum wind speed | Average wind speed | Number of sand-driving wind events | Sand-driving wind frequency | |
2019-2020 | 14.3 | 7.9 | 386 | 4.4% | 9.3 | 6.8 | 66 | 0.75% |
2020-2021 | 13.3 | 7.9 | 529 | 6.0% | 9.0 | 6.6 | 73 | 0.83% |
2021-2022 | 14.8 | 7.7 | 487 | 5.6% | 9.8 | 7.1 | 61 | 0.70% |
2019-2022 | 14.8 | 7.83 | 1402 | 5.3% | 9.8 | 6.82 | 200 | 0.76% |
Shazhuyu | Guinan | |||||||
|---|---|---|---|---|---|---|---|---|
DP (VU) | Main sand drift direction | Main sand drift direction DP (VU) | Proportion of DP in the main sand drift direction | DP (VU) | Main sand drift direction | Main sand drift direction DP (VU) | Proportion of DP in the main sand drift direction | |
spring | 29.4 | WNW | 25.6 | 87% | 1.70 | WNW | 0.73 | 43% |
summer | 0.99 | WNW | 0.43 | 43% | 0.25 | E | 0.095 | 38% |
autumn | 11.5 | WNW | 9.3 | 81% | 0.039 | NW | 0.014 | 36% |
winter | 20.5 | WNW | 17.2 | 84% | 0.70 | W | 0.34 | 49% |
Shazhuyu | Guinan | |||||||
|---|---|---|---|---|---|---|---|---|
DP | RDP | RDP /DP | RDD | DP | RDP | RDP /DP | RDD | |
spring | 29.4 | 29.0 | 99% | WNW | 1.70 | 0.32 | 19% | WNW |
summer | 0.99 | 0.78 | 97% | NNW | 0.25 | 0.046 | 18% | SE |
autumn | 11.5 | 11.4 | 99% | WNW | 0.039 | 0.016 | 41% | NW |
winter | 20.5 | 20.3 | 99% | WNW | 0.70 | 0.61 | 87% | W |
All year round | 62.39 | 61.48 | 99% | WNW | 2.689 | 0.89 | 33% | W |
WNW | West Northwest |
N | North |
NNE | North North East |
NE | Northeast |
ENE | East Northeast |
E | East |
ESE | East Southeast |
SE | Southeast |
SSE | South South East |
S | South |
SSW | South South West |
SW | Southwest |
WSW | West Southwest |
W | West |
NW | Northwest |
NNW | North North West |
DP | Sand Drift Potential |
RDP | Resultant Sand Drift Potential |
RDD | Resultant Sand Drift Direction |
VU | Vector Units |
| [1] | Ma, H.; Xiao, F.; Dong, Z., Dynamics and driving factors of land desertification in Gonghe County, Qinghai Province from 2000 to 2020. Journal of Arid Land Resources and Environment 2022, 36, 139-148. |
| [2] | Sha, Z.; Zeng, Y.; Ma, H., Dynamic study on land desertification in Longyangxia reservoir area supported by remote sensing and GIS. Journal of Desert Research 2000, 20, 51-54. |
| [3] | Li, F.; Tang, H.; Su, W., Remote sensing monitoring of desertification in Longyangxia Reservoir Area of Qinghai Province. Journal of Desert Research 2003, 23, 686-690. |
| [4] | Li, S.; Yan, C, Z.; Song, X., Remote sensing monitoring of desertification on the two sides of Longyangxia Reservoir in recent 30 years. Journal of Desert Research, 2011, 31, 836-841. |
| [5] | Duan, Q.; Shi, M.; Wang, B., Present situation of sandstorm in Longyangxia reservoir area and its influence on the reservoir area. Arid Zone Research 1990, 3, 22-29. |
| [6] | Hu, M.; Li, X.; Zuo, H., Dynamics of land desertification in Guinan County, Gonghe Basin from 1989 to 2014. Journal of Desert Research 2018, 38, 30-38. |
| [7] | Shao, M.; Luo, W.; Che, X., Characteristics of sandstorm transport and estimation of potential inflow in Longyangxia reservoir area from 1987 to 2019 based on COSI-CORR technology. Journal of Desert Research 2021, 41, 249-261. |
| [8] | Dong, G.; Gao, S.; Jin, J., Land desertification and its control in Gonghe Basin of Qinghai Province. Journal of Desert Research 1989, 9, 61-75. |
| [9] | Zhang, D., Quantitative analysis of influencing factors of land desertification in Gonghe Basin of Qinghai. Journal of Desert Research 2000, 20, 59-62. |
| [10] | Wu, Z., Wind-blown sand landform and sand control engineering. 2nd ed.; Science Press: Beijing, China, 2003; 385-390. |
| [11] | Li, J.; Su, Z.; Hu, G., Common indexes for judging the intensity of sandstorm activity and their application. Journal of Desert Research 2010, 30, 788-794. |
| [12] | Wang, Z.; Niu, G.; Liu, B., Comparison and applicability analysis of three estimation indexes of sandstorm activity intensity. Journal of Desert Research 2021, 41, 118-126. |
| [13] | Zu, R.; Zhang, K.; Qu, J., Study on wind characteristics in Taklimakan desert. Arid Land Geography 2005, 28, 167-170. |
| [14] | Mao, D.; Cai, F.; Lei, J., Characteristics of aeolian sand activities in the southern margin of Taklimakan Desert in the lower reaches of Qira River in Xinjiang. Journal of Arid Land Resources and Environment 2016, 30, 169-174. |
| [15] | Liu, T.; Yang, X; Dong, J., A preliminary study of relation between megadune shape and wind regime in the Badain Jaran Desert. Journal of Desert Research 2010, 30, 1285-1291. |
| [16] | Pang, Y.; Wu, B.; Jia, X., Characteristics of wind regime and sand drift potential in Mu Us sandy land. Journal of Desert Research 2019, 39, 62-67. |
| [17] | Gu, L.; Lv, P.; Ma, F., Characteristics of wind regime and sand drift potential in Mu Us sandy land under different data sources. Journal of Desert Research 2022, 42, 54-62 |
| [18] | Luo, F.; Gao, J.; Xin, Z., Characteristics of sand-driving wind regime and sediment transport in northeast edge of Ulan Buh Desert [J]. Transactions of the Chinese Society of Agricultural Engineering (Transactions of the CSAE), 2019, 35(4): 145-152. (in Chinese with English abstract) |
| [19] | Yang, Y.; Lv, P.; Ma, F., Influence of wind regime in the southwest of Ulan Buh Desert on the formation of dome dunes. Journal of Desert Research 2021, 41, 19-26. |
| [20] | Chen, Z.; Dong, Z.; Wang, Q., Characteristics of wind regime and sand drift potential in Qaidam Basin. Journal of Desert Research, 2020, 40, 195-203. |
| [21] | Hu, G.; Dong, Z.; Zhang, Z., Characteristics of wind regime and sand transport potential in Zoige Basin. Journal of Desert Research 2020, 40, 20-24. |
| [22] | Chen, Z.; Dong, Z.; Wang, Q. Wind regime and aeolian landform in Gonghe Basin, Qinghai. Journal of Desert Research 2018, 38, 492-499. |
| [23] | Chen, Z.; Dong, Z.; E, C., Characteristics and changing trend of wind regime in Gonghe Basin from 1971 to 2015. Journal of Lanzhou University (Natural Science Edition) 2020, 56, 224-231. |
| [24] | Li, J.; Han, L.; Zhao, Y., Wind regime and sand drift potential in desertification areas in northern Shanxi. Journal of Desert Research 2016, 36, 911-917. |
| [25] | Liang, X.; Niu, Q.; An, Z., Characteristics of sand wind and sand transport potential in Yadan landform area south of Suoyang City, Guazhou, Gansu Province. Journal of Desert Research 2019, 39, 48-55. |
| [26] | Zhang, L.; Zhang, D.;Wang, H., Characteristics of sand-driving wind regime and sand drift potential in windy season in the east sandy area of Qinghai Lake. Journal of Desert Research 2023, 37, 91-977. |
| [27] | Amy, L. E.; Leslie, D. M.; Joseph. A. M.; Shannon. A. M, Late Quaternary Soil Development Enhances Aeolian Landform Stability, Moenkopi Plateau, Southern Colorado Plateau, USA. Geosciences 2018, 8, 146-164. |
| [28] | Xie, S.; Qu, J.; Han, Q.; Pang, Y., Wind dynamic environment and wind tunnel simulation experiment of bridge sand damage in Xierong section of Lhasa–Linzhi Railway. Sustainability 2020, 12, 5689. |
| [29] | Rahdari, M. R.; Rodríguez-Seijo, A. Monitoring Sand Drift Potential and Sand Dune Mobility over the Last Three Decades (Khartouran Erg, Sabzevar, NE Iran). Sustainability 2021, 13, 9050. |
| [30] | Fryberger, S. G.; Dean, G. Dune forms and wind regime. In: McKee, E. D. (Ed.), A study of global sandy seas. Washington: United States Government Printing Office, 1979; 137-169. |
| [31] | Sun, X.; Fang, Y.; Zhao, J., Temporal and spatial distribution characteristics of sand drift potential in Taklimakan Desert. Arid Land Geography 2020, 43, 38-46. |
| [32] | Fang, Y.; Zhao, J.; Guo, Y., Fryberger's calculation method of sand drift potential and deviation analysis of its estimated value - taking Taklimakan desert as an example. Arid Land Geography 2015, 38, 95-102. |
| [33] | Bullard, J. E., A note on the use of the "Fryberger method" for evaluating potential sandy transport by wind. Journal of Sediment Research 1997, 67, 499-501. |
| [34] | Zhang, D.; Ga, S.; Shi, M., Land desertification and its control in Qinghai Plateau. 1st ed.; Science Press: Beijing, China, 2009; 39-96. |
| [35] | Xu, S.; Xu D.; Shi S., Aeolian sand accumulation in Gonghe Basin, Qinghai Province. Journal of Desert Research 1982, 2, 1-8. |
| [36] | Liu, J.; Chen, B.; Xu, D., Study on formation mechanism of wind energy resources in Gonghe Basin, Qinghai Province. Northwest Hydropower. 2022, 6, 144-149. |
| [37] | Souza Ferreira, G. W.; Reboita, M. S.; Ribeiro, J. G. M.; Carvalho, V. S. B.; Santiago, M. E. V.; Silva, P.; Baldoni, T. C.; de Souza, C. A., Assessment of the Wind Power Density over South America Simulated by CMIP6 Models in the Present and Future Climate. Climate 2023, 62, 1729–1763. |
| [38] | ElSayed, H.; Omar, A.; Abdullah, A.; Abdoul, J, N., Characterisation of Sand Accumulations in Wadi Fatmah and Wadi Ash Shumaysi, KSA, Using Multi-Source Remote Sensing Imagery. Remote Sensing 2019, 11, 2824-2841. |
| [39] | Ma, X.; Li, Y.; Li, Z., The Projection of Canadian Wind Energy Potential in Future Scenarios Using a Convection-Permitting Regional Climate Model. Energy 2022, 8, 7176–7187. |
| [40] | Rusu, E., An Evaluation of the Wind Energy Dynamics in the Baltic Sea, Past and Future Projections. Energy 2020, 160, 350–362. |
| [41] | Rusu, E., Assessment of the Wind Power Dynamics in the North Sea under Climate Change Conditions. Energy 2022, 195, 466–475. |
| [42] | Yang, Y.; Javanroodi, K.; Nik, V. M., Climate Change and Renewable Energy Generation in Europe—Long-Term Impact Assessmenton Solar and Wind Energy Using High-Resolution Future Climate Data and Considering Climate Uncertainties. Energy 2022, 15, 302. |
| [43] | Costoya, X.; Castro, M.; Carvalho, D.; Feng, Z.; Gómez-Gesteira, M., Climate Change Impacts on the Future Offshore Wind Energy Resource in China. Energy 2021, 175, 731–747. |
APA Style
Zhang, L., Zhang, D., Xu, G., Dong, F., Tuo, W. (2024). Characteristics of Sand-Driving Wind Regime and Sand Drift Potential in Sandy Areas on Both Sides of Longyangxia Reservoir in China. International Journal of Environmental Monitoring and Analysis, 12(4), 74-87. https://doi.org/10.11648/j.ijema.20241204.12
ACS Style
Zhang, L.; Zhang, D.; Xu, G.; Dong, F.; Tuo, W. Characteristics of Sand-Driving Wind Regime and Sand Drift Potential in Sandy Areas on Both Sides of Longyangxia Reservoir in China. Int. J. Environ. Monit. Anal. 2024, 12(4), 74-87. doi: 10.11648/j.ijema.20241204.12
AMA Style
Zhang L, Zhang D, Xu G, Dong F, Tuo W. Characteristics of Sand-Driving Wind Regime and Sand Drift Potential in Sandy Areas on Both Sides of Longyangxia Reservoir in China. Int J Environ Monit Anal. 2024;12(4):74-87. doi: 10.11648/j.ijema.20241204.12
@article{10.11648/j.ijema.20241204.12,
  author = {Lechun Zhang and Dengshan Zhang and Guoyuan Xu and Fengling Dong and Wanbing Tuo},
  title = {Characteristics of Sand-Driving Wind Regime and Sand Drift Potential in Sandy Areas on Both Sides of Longyangxia Reservoir in China
},
  journal = {International Journal of Environmental Monitoring and Analysis},
  volume = {12},
  number = {4},
  pages = {74-87},
  doi = {10.11648/j.ijema.20241204.12},
  url = {https://doi.org/10.11648/j.ijema.20241204.12},
  eprint = {https://article.sciencepublishinggroup.com/pdf/10.11648.j.ijema.20241204.12},
  abstract = {This study focuses on the desertification areas of Talatan and Mugetan, located on both sides of the Longyangxia Reservoir in Qinghai Province, China. These areas pose serious threats to the safety of the reservoir due to frequent wind-sand activities. The research aims to provide a scientific basis for effective sand control by deeply analyzing the dynamic change of wind.The wind speed and direction data from Shazhuyu and Guinan meteorological stations in Qinghai Province, China were used to calculate the numerical and directional characteristics of sand-driving wind and sand drift potential.The results indicate that: (1) The number of sand-driving wind at Talatan is about 7 times that at Mugetan, and the maximum and average wind speeds are about 7 m/s larger than those at Mugetan. At Talatan, the primary sand-driving wind direction is exclusively West Northwest (WNW). Conversely, at Mugetan, the sand-driving wind direction remains westward in spring, autumn, and winter, shifting eastward solely in summer. (2) The annual sand drift potential of Talatan and Mugetan is less than 200VU, two sandy areas are both in low wind energy environments; (3) The major causes of the significant differences in sand-driving wind regimes between the Talatan and Mugetan are topography, precipitation, wind direction stability.These conclusions offer valuable insights for developing targeted sand control strategies, thereby mitigating the potential hazards posed by wind-sand activities to the Longyangxia Reservoir and its surrounding ecosystems.
},
 year = {2024}
}
TY  - JOUR
T1  - Characteristics of Sand-Driving Wind Regime and Sand Drift Potential in Sandy Areas on Both Sides of Longyangxia Reservoir in China

AU  - Lechun Zhang
AU  - Dengshan Zhang
AU  - Guoyuan Xu
AU  - Fengling Dong
AU  - Wanbing Tuo
Y1  - 2024/08/15
PY  - 2024
N1  - https://doi.org/10.11648/j.ijema.20241204.12
DO  - 10.11648/j.ijema.20241204.12
T2  - International Journal of Environmental Monitoring and Analysis
JF  - International Journal of Environmental Monitoring and Analysis
JO  - International Journal of Environmental Monitoring and Analysis
SP  - 74
EP  - 87
PB  - Science Publishing Group
SN  - 2328-7667
UR  - https://doi.org/10.11648/j.ijema.20241204.12
AB  - This study focuses on the desertification areas of Talatan and Mugetan, located on both sides of the Longyangxia Reservoir in Qinghai Province, China. These areas pose serious threats to the safety of the reservoir due to frequent wind-sand activities. The research aims to provide a scientific basis for effective sand control by deeply analyzing the dynamic change of wind.The wind speed and direction data from Shazhuyu and Guinan meteorological stations in Qinghai Province, China were used to calculate the numerical and directional characteristics of sand-driving wind and sand drift potential.The results indicate that: (1) The number of sand-driving wind at Talatan is about 7 times that at Mugetan, and the maximum and average wind speeds are about 7 m/s larger than those at Mugetan. At Talatan, the primary sand-driving wind direction is exclusively West Northwest (WNW). Conversely, at Mugetan, the sand-driving wind direction remains westward in spring, autumn, and winter, shifting eastward solely in summer. (2) The annual sand drift potential of Talatan and Mugetan is less than 200VU, two sandy areas are both in low wind energy environments; (3) The major causes of the significant differences in sand-driving wind regimes between the Talatan and Mugetan are topography, precipitation, wind direction stability.These conclusions offer valuable insights for developing targeted sand control strategies, thereby mitigating the potential hazards posed by wind-sand activities to the Longyangxia Reservoir and its surrounding ecosystems.

VL  - 12
IS  - 4
ER  -
School of Geological Engineering, Qinghai University, Xining, China
Biography: Lechun Zhang obtained his master's degree in Geodesy and Surveying Engineering from China University of Geosciences (Beijing) in 2008. From then to 2024, he has been working as a teacher in Qinghai University. Now he is also pursuing his doctorate degree at Qinghai University. He has participated in multiple domestic research projects, and moreover, he holds a certificate as a registered surveyor.
Research Fields: Geodesy, Surveying Engineering, Remoting Sence, Ecological Environment Research in Arid Areas, Combating Desertification

Academy of Agriculture and Forestry Sciences, Qinghai University, Xining, China
Meteorological Information Center of Qinghai Province, Xining, China
Geomatics Technology and Application Key Laboratory of Qinghai Province, Xining, China
College of Engineering, Qinghai Institute of Technology, Xining, China
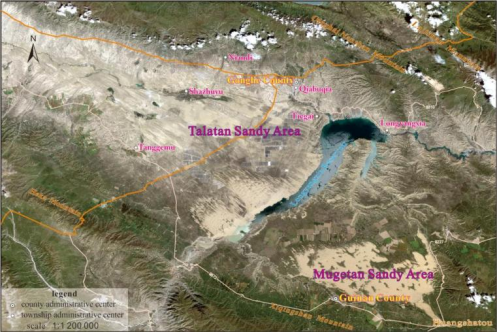
Figure 1. Topographic map of the sandy areas on both sides of Longyangxia Reservoir.
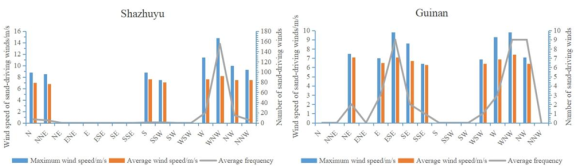
Figure 2. Maximum wind speed, average wind speed and annual frequency of sand-driving wind at each position in spring.
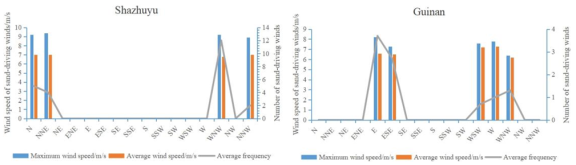
Figure 3. Maximum wind speed, average wind speed and annual frequency of sand-driving wind at each position in summer.
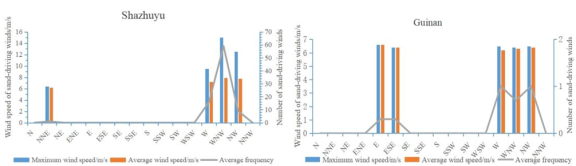
Figure 4. Maximum wind speed, average wind speed and annual frequency of sand-driving wind at each position in autumn.
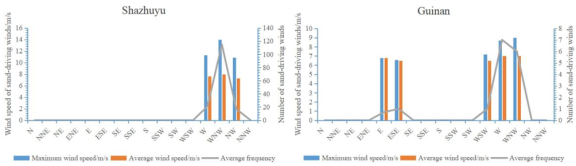
Figure 5. Maximum wind speed, average wind speed and annual frequency of sand-driving wind at each position in winter.
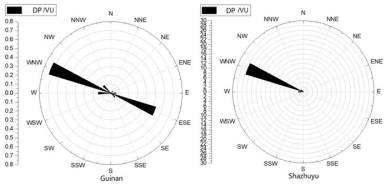
Figure 6. Rose plots of sand drift potentiall at each position in spring in Shazhuyu and Guinan.
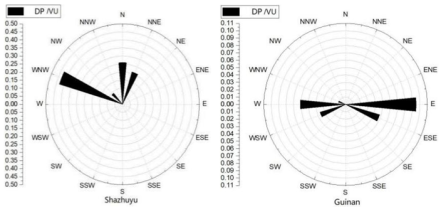
Figure 7. Rose plots of sand drift potentiall at each position in summer in Shazhuyu and Guinan.
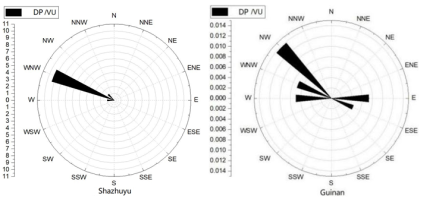
Figure 8. Rose plots of sand drift potentiall at each position in autumn in Shazhuyu and Guinan.
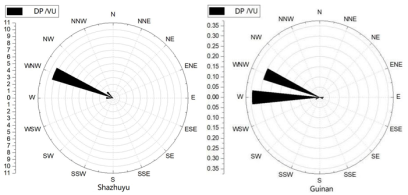
Figure 9. Rose plots of sand drift potentiall at each position in winter in Shazhuyu and Guinan.
Information

