Review Article | | Peer-Reviewed

A Brief Review of Investigations into Earth’s Temperature Since the Year 1800

Received: 14 July 2024     Accepted: 12 August 2024     Published: 27 August 2024
Views:       Downloads:
Abstract

For billions of years, natural processes alone, often working over millennia, drove Earth’s temperature and climate. For the last several centuries, human activities are a new driving force that is acting on a very short time scale. Knowing history helps chart necessary future actions with greater confidence. Since the end of the 17th century, investigations relating to Earth’s temperature and its climate have evolved from only scientific interest to also include practical concerns triggered by global warming. The early studies were relatively episodic with gaps of a decade or more common until the mid 20th century when they burgeoned starting with the International Geophysical Year. From the early to mid 1800s, to the early to mid 20th century, the investigations were at the initiation of the individual researchers. Starting in the mid 1950s, the investigations became more extensive, comprehensive and interrelated. Early researchers inferred that the atmosphere played a role in Earth’s temperature, and as far back as the 1850s it was concluded that higher CO2 concentrations in the atmosphere could result in warming Earth. Later investigations provided information on the mechanism which established that atmospheric CO2 concentration and its absorption and re-emitting of infrared radiation was a major factor in Earth’s temperature. Further, its increasing atmospheric concentration is a major driver of a warming globe at a rate far surpassing those detected in the geologic record. This paper traces the history of those researches based on the premise that knowing how we arrived at our current knowledge helps in supporting future research and actions to address the consequences of Earth’s warming.

Published in International Journal of Environmental Monitoring and Analysis (Volume 12, Issue 4)
DOI 10.11648/j.ijema.20241204.13
Page(s) 88-97
Creative Commons

This is an Open Access article, distributed under the terms of the Creative Commons Attribution 4.0 International License (http://creativecommons.org/licenses/by/4.0/), which permits unrestricted use, distribution and reproduction in any medium or format, provided the original work is properly cited.

Copyright

Copyright © The Author(s), 2024. Published by Science Publishing Group

Keywords

Earth’s Temperature, Early Climate Studies, Summary of Early Climate Studies, Foundational Studies of Earth’s Temperature

1. Introduction
For billions of years, natural factors including Sun’s intensity, Earth’s orbit as well as Earth bound ones, especially volcanic activity, have affected Earth’s temperature and climate. Now there is a new and unprecedentedly strong and short time frame factor: human activity. For the last several centuries, human activities have become an increasingly significant driving force. Understanding the natural forces is important. Understanding recent human driven rapid effects on Earth’s temperature and therefore its climate is essential for providing a framework for necessary remedial actions.
The purpose of this paper is to remind those who may have forgotten and those who are unaware of historical research related to Earth’s temperature when it was strictly a matter of intellectual curiosity. The research, which dates from the early 19th century, provides the technical foundation and support for modern investigations long before Earth’s temperature and its warming became a topic of concern and potential or even needed remedial actions. As such, the early researches cannot be charged with having any political agenda and therefore stand on the footing of science based results. This manuscript highlights many early pertinent, signal but uncoordinated and independent efforts related to understanding why Earth has the temperature it does and the implications for Earth’s climate.
2. The Researchers and Their Research
It was scientific interest that an early investigator, Jean Baptist Joseph Fourier explored the question of Earth’s temperature. Fourier was politically active to the point of nearly losing his head in the French Revolution. He accepted Napoleon’s request to aid in scientific activities in Egypt where he helped found the Cairo Museum. Once back in France, he was jailed during restoration of the French Monarchy, but freed by the efforts of influential friends. He later was an administrator in southern France during which time he met Champollion to whom he introduced a copy of the Rosetta Stone. Champollion then played a major role in deciphering it.
Fourier’s question: why does Earth have the temperature it does? This is a question that intrigued him. Although he is best known for his development of a mathematical technique eponymously named Fourier analysis, he also is known for his investigation of heat flow. In the 1820s, this interest led Fourier to explore factors affecting Earth’s temperature in a paper which is available in French . English versions are also available and can be compared for consistency in the translations.
Fourier considered three driving factors:
1. heat from the Earth’s core
2. starlight radiation and
3. the Sun’s radiation.
Although he considered each source in detail, his ultimate conclusion was that the Sun’s radiation was the driver of Earth’s temperature. While Fourier does not present the calculations in his paper, he concludes Earth would have a much lower temperature than it does without moderating factors. Fourier concluded that Earth’s atmosphere was a major factor in determining the planet’s temperature. The mechanism involved was not entirely clear to him but he attributed it to an effect similar to a blanket. The following excerpts frame his thoughts.
“From these various remarks we conclude, and principally from the mathematical examination of the question, that there must be a physical cause which is always present, which moderates the temperatures of the surface of the globe, and which gives this planet a fundamental heat independent of the action of the Sun and of the primitive heat retained in the interior of the planet. This fixed temperature which the Earth receives from space differs little from that which one measures at the Earth’s poles.”
While Fourier delves into many aspects of Earth’s temperature, he is explicit in noting the influence of Earth’s atmosphere on its temperature even if he can identify its role only in a qualitative way as noted in the following quotes:
“The temperature is very different, even in the mean, from that which an isolated thermometer placed at the location of the planet would measure, for the solidity of the planet, its great size and doubtless also the presence of the atmosphere and the nature of the surface act together to determine the mean temperature.”
“It is difficult to know just to what extent the atmosphere affects the mean temperature of the globe, and here the guidance of rigorous mathematical theory ceases.”
“The reduction of heat in elevated regions of the air does not fail to take place; it is thus that the temperature is augmented by the interposition of the atmosphere, because the heat has less trouble penetrating the air when it is in the form of light, than it has exiting back through the air after it has been converted to dark heat.”
“All the terrestrial effects of the Sun’s heat are modified by the interposition of the atmosphere and by the presence of the waters. The grand movements of these fluids renders the temperature distribution more uniform. The transparency of the waters and that of the air act together to augment the degree of heat acquired, because incident luminous heat penetrates easily to the interior of the mass, but the dark heat exits with more difficulty when following the contrary route.”
In 1838, Pouillet developed an instrument to measure the Sun’s radiation reaching Earth. His measurement of 1265 watts/m2 is impressively close to the current estimate of 1360 watts/m2. Part of the discrepancy was due to his measuring only direct radiation which does not include reflected rays and also the crudeness of his instrument. If Fourier had still been alive, it would have been interesting to see his use of Pouillet’s data.
In the 1850s, experimental work concerning sunlight’s effect on various gases provided some direct information to complement theoretical considerations of Earth’s temperature. In upstate New York a researcher named Eunice Newton Foote, trained at the Troy Academy also in upstate New York, conducted investigations of sunlight’s impact on different gases contained in sealed glass tubes fitted with thermometers . Her work was retrieved from obscurity in the early 2000s by Sorensen . Foote found that the tubes of gas exposed to the sun’s radiation increased in temperature. While dry air, hydrogen and oxygen increased modestly in temperature compared to vials of the respective gases kept in the shade the temperature in the one containing carbon dioxide increased substantially. She noted that the temperature of vials containing moist air also increased substantially compared to its dry air counterpart. Foote’s results showed that certain gases, in this case carbon dioxide and water vapor, interacted with the sun’s radiation to increase temperature of the gases in the vials beyond that of simply being confined in a closed glass container (i.e., a true greenhouse effect since there is no mixing with cooler ambient air around the vessel). The mechanism for the larger than expected heating was unknown as also noted by Fourier. Foote’s entire article of one page in length was presented at the 1856 meeting of the American Association for the Advancement of Science (AAAS) in Albany, N. Y. (Actually read for her by the Chair of the meeting, president of the Smithsonian Institution, since it was unusual for a woman to do so herself.) Foote the mother of two daughters and a participant in the first women’s rights conference in Seneca Falls, N. Y. (1848), noted in her paper the implications of her experimental results regarding carbon dioxide:
“An atmosphere of that gas would give to our earth a high temperature; and if, as some suppose, at one period of its history, the air had mixed with it a larger proportion than at present, an increased temperature from its own action as well as from increased weight must have necessarily resulted.”
In 1861, the results of far more extensive experiments on the interaction of heat radiation and many gases were presented by the distinguished Irish scientist John Tyndall . After screening several sources of heat radiation, Tyndall chose boiling water as the most consistent and reliable source. His experimental apparatus was elaborate including the ability to dry a gas under investigation and to keep it a specific pressure. The gas being exposed to the heat radiation was confined in a tube with clear rock salt lenses at either end ensuring free passage of the radiation. The detection device was a galvanometer with two opposing currents that balanced the galvanometer at zero based on the presence of boiling water containers (Leslie cubes) at either end of the tube containing the gas being tested. When the tube was void of gas or when the gas did not absorb any radiation, the galvanometer was in electrical balance and its dial remained at zero. If a gas absorbed radiation, an electrical imbalance occurred and the galvanometer’s needle would be deflected in proportion to the amount of radiation absorbed.
Tyndall tested both inorganic and organic gases. The organic gases were generally much more absorbent of the radiant radiation. Of the inorganic gases tested, air, nitrogen, oxygen, and hydrogen exhibited minor or no absorption, while carbon monoxide, carbon dioxide and nitrous oxide absorbed in that order. In addition, ambient air with both water vapor and carbon dioxide exhibited strong absorption, presumably mostly due to the water vapor. For comparison, oliphant (ethylene) gas absorbed more than any of the inorganic gases.
Tyndall notes that while the mechanism of absorption and emission was yet to be established,
“Now if, as the above experiments indicate, the chief influence be exercised by the aqueous vapour, every variation of this constituent must produce a change of climate. Similar remarks would apply to the carbonic acid diffused through the air; while an almost inappreciable admixture of any of the hydrocarbon vapours (one might think methane, a gas Tyndall did not investigate) would produce great effects on the terrestrial rays and produce corresponding changes of climate.”
While Tyndall did not cite Foote’s work for unknown reasons, it is notable that the results of both investigators were consistent in whether and to what degree radiant heat (infra-red radiation) was absorbed. Both observed that dry air, oxygen and hydrogen did not absorb but, moist air and carbon dioxide did. That is, their results agreed for all the gases their investigations had in common. So, even though Foote’s experiments were conducted in a much less sophisticated setting than Tyndall’s, her findings were verified by Tyndall’s as presented in the following table.
Table 1. Comparison of heat absorption in Foote’s and Tyndal’s results for the gases they investigate in common.

GAS

HEAT RADIATION ABSORBED?

FOOTE

TYNDALL

DRY AIR

NO

NO

HYDROGEN

NO

NO

OXYGEN

NO

NO

CARBON DIOXIDE

YES

YES

MOIST AIR

YES

YES

After another few decades of limited interest, Svante Arrhenius questioned whether changes of CO2 in the atmosphere could account for the Ice Ages . While he did not and could not conduct the extensive experiments needed himself, he did an enormous number of calculations based on data from Langley’s work on the atmosphere’s absorption of moonlight. Arrhenius states:
“Fortunately, there are other researches by Langley in his work on “The Temperature of the Moon”, with the aid of which it seems not impossible to determine the absorption of heat by aqueous water vapor and by carbonic acid in precisely the conditions which occur in our atmosphere.”
Since moonlight is reflected sunlight, it has a similar spectrum but at its maximum (i.e., a full moon), by one account, only about 0.0002% of its intensity . Arrhenius used Langley’s data as a template to assess the effect of the atmospheric CO2 concentrations on Earth’s temperature for every 10o of latitude between 60o N and 60o S . These data were projected for 0.67, 1.5, 2 and 3 times the CO2 concentration extant in 1895 (about 295 ppm). His calculations were the first quantitative model of Earth’s temperature as influenced by varying concentrations of atmospheric CO2 by averaging his calculations for each relative concentration of CO2 over all the latitudes between 60o N and 60o S at 10 deg intervals. All these calculations consumed several months of his time. His temperature projections are larger than current models predict; they were of a little over a factor of 2. In fact, according to NASA , Earth’s temperature rose about 1.1°C between 1880 and 2022 with the majority of the increase since 1975. Interpolating Arrhenius’ temperature predictions for CO2 concentration increasing from ~300 ppm in 1900 to ~ 400 ppm in 2022, results in a predicted increase of about 2.6 °K. Arrhenius’ effort was extraordinary and remarkable.
Again, several decades passed before additional insights were gained on the factors influencing Earth’s temperature. In the 1930s, E. O. Hurlbut calculated that doubling or tripling the atmospheric concentration of CO2 would cause the temperature of the ocean to rise by 4 and 7 degrees K respectively .
G. S. Callendar, A British engineer and while not a professional meteorologist but a great enthusiast for understanding climate, in 1938 calculated that the rate of temperature rise over the previous 50 years to be 0.003 deg C /year. Based on 50 years of data from 200 meteorological station across the globe, the rate of rise was 0.005 deg C/yr. . While the calculated and observed rate of increase were quantitatively close, more observations would be required to provide confidence in the agreement. Based on a constant yearly discharge to the atmosphere of 4,300 million tons of CO2 from human activity, mainly the burning of fossil fuel, Callendar projected less than 0.5 deg C rise in Earth’s global temperature over the next 200 years. The projections also were done using a fixed concentration of water vapor in the atmosphere. Both the constant CO2 loading and set water vapor concentration minimize the temperature projections Callendar made. In any event, in 1938 any warming of the climate was considered either benign or perhaps beneficial.
Callendar presented his paper at a meeting of the (British) Royal Meteorological Society, so there were questions and comments following his talk. While some questioners appreciated the massive amount of work involved, they expressed several concerns including the reliability of the temperature data used, the effect on temperature distribution of atmospheric dynamics and the estimate of CO2 entering the ocean from the atmosphere. Someone said he would have liked Callender’s calculations to have been included. Callendar responded to these concerns and stated that data collected during the next 20 years would help better define the situation. He also said that his calculations were twice as many pages as his manuscript, so he did not include them. So, the whole issue of a rising of the average temperature of the globe had the air of a complex and interesting academic pursuit. In fact, Callendar’s conclusions suggested there might be salubrious effects of Earth’s rising temperature: to wit, moving the growing season further north and as a barrier against another ice age.
In 1939, and based in part on his 1938 paper, Callendar presented a note showing the average temperature in several mid and northern European cities was increasing slightly. As Callendar notes:
“From the best laboratory observations it appears that the principal result of increasing atmospheric carbon dioxide, apart from a slight speeding up of rock weathering and plant growth, would be a gradual increase in the mean temperature of the colder regions of the earth.”
After a hiatus due to WWII (although a great deal of meteorological data were collected worldwide during that conflict), interest and research in climate increased dramatically. For instance,
Callendar then published several additional articles related to atmospheric CO2 and climate as cited by Fleming .
Plass noted the theory that CO2 in the atmosphere played a major role in Earth’s climate over geological time—especially cycles of glaciation. He argued that many aspects of climate change could be explained by the CO2 concentration in the atmosphere and ocean. This argument was essentially based on the Occam razor principle which says choose the simplest explanation that explains most or all of the information. CO2 concentration in the atmosphere fit that principle.
In the early 1950s, Benedict and Plyler made measurements and better defined the wavelengths of IR absorbed by CO2. An animation of vibrations in the CO2 and H2O molecules that account for IR absorption is presented which also mentions that the way molecules like O2 and N2 rotate and vibrate preclude their absorbing IR radiation. The IR radiation absorbed by a molecule increases its energy and the natural process is to release that absorbed energy to return to its stable energy (called ground) state. This re-emitting is in all directions and therefore some radiation returns to Earth thus warming it until, over a long period of time, an equilibrium is achieved for a given atmospheric CO2 concentration and a constant (more or less) temperature is maintained. While greenhouse gases like methane have stronger greenhouse effects because their molecules absorb and re-radiate more energy on a molecule to molecule basis, CO2’s higher concentration in the atmosphere makes it the primary gas driving climate warming.
Water vapor is the greatest factor in climate warming but is a result and not an initiator. Carbon dioxide along with other greenhouse gases cause Earth’s temperature increase which allows more water vapor to enter the atmosphere. Were the CO2 concentration in the atmosphere to plummet, water vapor would condense and fall as rain and then snow so that it is likely that a period of glaciation would ensue as Arrhenius theorized.
An extensive account of early climate related theories and science has been presented by Fleming . The one major figure he does not mention is Eunice Newton Foote whose work was rediscovered by Sorensen after Fleming’s book was published. Fleming recounts a history of researches through a series of “...interrelated essays on elite and popular understanding of climate change.” He describes prominent points in the long history of science that slowly lead to a better understanding of climate and climate change. Fleming notes beliefs in environmental determinism (societies are what they are because of the climate they inhabit) that travel from ancient Greek philosophers through more relatively recent philosophers such as Montesquieu and Hume and including Thomas Jefferson. Fleming then traces many of the scientific inquiries over the last 200 years that relate both to climate itself and academic studies of the physics and chemistry of gases some of which also are present in the atmosphere, CO2 and water vapor being the most prominent among those affecting climate.
While Fleming was writing in the late 1990s, he concluded his historical review as the International Geophysical Year (IGY) was underway in the late 1950s. He explained his goal was to provide an overview of the material that provided the foundation for the burgeoning research on climate that was beginning in the late 1950s, “...not to replicate the recent literature” between then and the late 1990s. Mason also provides an overview of climate science since 1800. While this summary is much briefer than Fleming’s, it is more comprehensive in that it covers work to 2020 and includes Foote’s research.
The following summary is based primarily on a short overview of climate science in the 1950s by Weart . Roger Revelle was an accomplished scientist, a dynamic administrator of the Scripps Institute of Oceanography, and influential in scientific circles . In homage to Callander’s work, Revelle often referred to the connection of increased CO2 loading to the atmosphere and the warming of the globe as the “Callendar Effect.” Had Revelle known about Foote’s work, he might have used the term “Foote-Callendar” effect. In the 1950s, interest of CO2 in the atmosphere was moving from just intellectual interest to include possible practical consequences. There was limited understanding of the geochemistry of CO2. Many thought much of the anthropogenic CO2 added to the atmosphere would quickly dissolve in the oceans (apparently without considering what the impacts of that might be). Revelle, with information based on many others made preliminary estimates of CO2 being removed from the atmosphere by its dissolution into the oceans. By the mid-1950s, estimates were made of the residence time of a molecule of CO2 in the atmosphere, in some cases using C14. Revelle and Suess, Craig, and Anderson and Arnold published companion papers in the same journal at the same time each with their own estimates. The average of their estimates was about a decade. What is remembered most from those articles is Revelle’s statement about a global experiment:
"Human beings are now carrying out a large scale geophysical experiment of a kind that could not have happened in the past nor be reproduced in the future."
Weart argues that the statement was more of a scientific one rather than one of a dire warning as some have suggested, but Revelle’s comment may turn out to be more of an inadvertent warning than Revelle realized.
In the late 1950s, a postdoctoral researcher the California Institute of Technology, Charles Keeling, began investigating the geochemistry of atmospheric CO2 and its solid phases like limestone (CaCO3 mainly). The effort quickly evolved into an effort to accurately measure CO2 in the atmosphere which measurements to that date indicated high variability. Keeling’s change to focus exclusively on atmospheric CO2 was accompanied by his move to the Scripps Institute of Oceanography as he relates in his brief biography . Keeling was very adept at developing procedures and instrumentation to measure atmospheric CO2 very accurately.
Revelle, among others, supported Keeling’s efforts to monitor CO2 in the atmosphere. Keeling gained support from Henry Wexler, then head of the U. S. Weather Bureau, which is now within the National Oceanic and Atmospheric Administration (NOAA), in part because Keeling had developed very accurate monitoring protocols and instrumentation and the fact that his efforts coincided with the Bureau’s plan to do extensive monitoring of atmospheric CO2 during the International Geophysical Year (IGY). Keeling gained access to the Bureau’s new monitoring station near the summit of Mauna Loa which in spite of its being an active volcano enjoyed air unaffected by local sources. However, the monitoring station was closed temporarily during an eruption of Mauna Loa recently. It is now on line again. The monitoring took on life of its own generating the widely recognized saw toothed plot of atmospheric CO2 concentrations reflecting the growing and senescent seasons in the Northern Hemisphere. That plot is known the Keeling Curve and tracks not only the seasonal variation of CO2 but also its increasing concentration in the atmosphere. In his biography, Keeling relates the decades-long effort to keep funding for his efforts. On the funding side, the vagaries of federal agency budgets were problematic while on the scientific side, the view that his work had become monitoring rather than a scientific investigation made the efforts to keep his work going a constant challenge.
The value of long-term monitoring often is not recognized as a scientific endeavor, but it is the only way natural processes and change really can be documented. Eventually, Keeling received numerous awards for his work including the Medal of Science in 2001 and the plot of CO2 concentrations at Mauna Loa being universally referred to as the Keeling Curve.
The flowering of research begun following the IGY continues apace today.
Recent estimates are that about 44% of the new CO2 added to the atmosphere will dissolve in the ocean by the Intergovernmental Panel on Climate Change (IPCC) , as plotted in the following figure, with the remainder adding to the concentration in the atmosphere at least for the immediate future until deep ocean circulation has time to play its role as part of the storage and equilibrium mechanism.
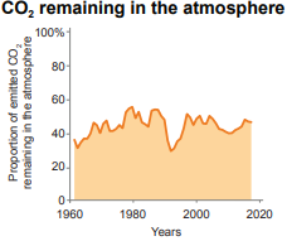
Figure 1. Percentage of emitted CO2 remaining in the Atmosphere 1980-2020. (26).
The discharge of CO2 to the atmosphere and the increased concentration of CO2 in the atmosphere along with the characteristic seasonal variability are reflected in the following figures
The question arises as to whether there are any consequences from the increasing concentration of CO2 in the atmosphere as revealed by the data from Mauna Loa which is representative of a world-wide phenomenon? As far back as Foote’s simple but elegant experiments, the higher temperature of the tubes containing CO2 exposed to sunlight compared to other gases produced a difference that she actually could have sensed had she touched the tubes. As noted, later experiments by others such as Tyndall showed CO2 could absorbed heat radiation and eventually the mechanism involved was identified. So, it is not much of a step to infer that CO2 in the atmosphere increases Earth’s temperature from what it would be otherwise. Hence the pattern depicted in the following plot is not just correlation, but cause and effect.
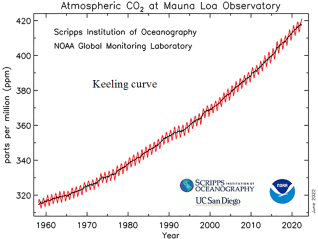
Figure 2. Atmospheric CO2 measured at the Mauna Loa Monitoring station showing annual increases and seasonal pattern in the Northern Hemisphere .
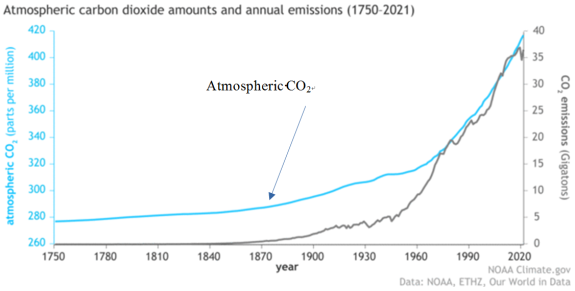
Figure 3. CO2 emissions and atmospheric CO2 concentrations 1750-2020 .
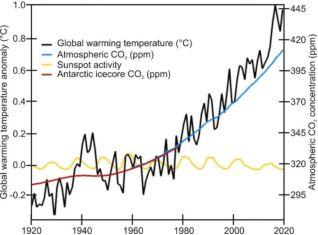
Figure 4. Annual average Earth’s temperature and atmospheric CO2 concentration 1920-2020 .
As more worldwide data were collected and computers appeared on the scene, more and more complex climate models assessing CO2’s and other climate driving factors’ impacts on the climate have become available with their ability to estimate future conditions under various scenarios.
George Box, a British statistician made the famous or infamous statement: “All models are wrong. Some are useful” . My own view is that all models are approximations and some are better approximations than others but all are useful so long as one appreciates their limitations.
A very simple model of Earth’s temperature is a heat balance which ignores the influence of the atmosphere. Albedo is a factor representing the portion of the earth, mainly light colored continents and ice, that reflect rather than absorb sunlight radiation. Reflection diminishes the amount of radiation that the earth absorbs. The darker areas absorb Sun’s radiation (mostly in the visible light part of the electromagnetic spectrum) and coverts this to longer wavelength infra red radiation (i.e., heat) and re-emits that radiation to the atmosphere. The infra-red radiation can be absorbed by certain gases in the atmosphere, especially CO2. Using an albedo (i.e., reflectivity) of 0.3 for the Earth, the temperature is calculated through the following equation
Te=1-α*S4σ4
Te = resulting equilibrium temperature in deg K
α = Earth’s albedo (taken as 0.3)
σ = Stefan-Boltzman law = 5.67 x 10⁻⁸ watts/(m2/deg K4)
S = Solar radiation reaching Earth’s surface (watts/m2)
The calculation inside the radical (square root symbol) is then taken as the fourth root or to the 0.25 power as indicated by the 4 outside the radical.
The equation takes into account the area of Earth receiving the radiation, i.e., that portion or area facing the sun.
As noted previously, Pouilett’s measurement of solar radiation (1265 watts/m2) is about 100 watts/m2 less than the modern value of 1360 watts/m2 or about 93 percent. Pouilett’s measurement yields a temperature for Earth about five degrees colder than the more accurate current value (~250 deg K, or -23 deg C vs 255 deg K, or -18 deg C). Both fall short by about 30 deg C of the current global average of 288 deg K, or 15 deg C because the substantial effect of Earth’s atmosphere owing exclusively to its greenhouse gases, especially CO2, is ignored.
As an intellectual point of interest, moon light is about 0.0002% of sunlight intensity or 0.3 watts/m2 which, keeping the albedo value of 0.3, yields a temperature prediction of 31 deg K (minus 241 deg C) or about 257 deg K lower than Earth’s actual temperature. Again, the influence of any atmosphere on the Earth’s temperature at this cold value is probably nil.
A general and helpful overview of climate models is presented by the U. S. Department of Agriculture (USDA) . Climate models have many of the components of weather models, but much longer simulation periods; years rather than days. The main points included in the USDA overview are:
1. Global climate models are computer programs that consist of several hundred thousand lines of code. They calculate the interactions between the ocean, atmosphere and land using factors such as water vapor, carbon dioxide, heat, and the Earth’s rotation as inputs.
2. Climate models project climate (the average weather over a long period of time, e.g., a 30-year period), not weather (what an area experiences on an hourly or daily basis). Climate model outputs are very coarse, or low resolution. To see outputs at a more local scale, you must look at the down-scaled version of the model.
3. Models help us understand how our actions can affect the future climate. They allow modelers to look at different scenarios of increased greenhouse gas emissions and see how those increases may affect the planet.
Another site for exploring a simple model is presented by the University Corporation for Atmospheric Research (UCAR) . The site provides an interactive means for changing carbon dioxide loads to the atmosphere and then seeing the impact on atmospheric CO2 concentration and Earth’s projected temperature.
An example cited in the IPCC report shows the range of temperature changes predicted by multiple runs of over a dozen climate models along with the mean of those model results compared to the global mean temperature measurements along with volcanic eruptions noted which can produce aerosols and particulates to block some of the sun’s energy from reaching Earth’s surface . Note that trends in the observed data and simulations from 2000 on (to about 2007 where the plot ends). All the models and runs predict close to a 0.5 degree rise in temperature or greater above the 1901-1950 mean.
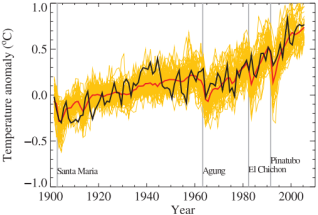
Figure 5. Global mean near-surface temperatures over the 20th century from observations (black) and as obtained from 58 simulations produced by 14 different climate models driven by both natural and human-caused factors that influence climate (yellow). The mean of all these runs is also shown (thick red line). Temperature anomalies are shown relative to the 1901 to 1950 mean. Vertical grey lines indicate the timing of major volcanic eruptions .
Ornes reports on the various approaches climate modelers use to assess the probability that extreme events such as drought or the intensity of hurricanes is influenced by Earth’s current warmed climate. While assessments of a warming climate’s influence on any particular event may be debatable, the overall picture is one of various impacts. For instance, flow records at a United States Geological Survey (USGS) stream gauge may become even less accurate in predicting low probability events such as floods or droughts as precipitation patterns changes in a watershed caused by a changing climate.
Another example is the difficulty of setting insurance rates for natural disasters which often are based on historical statistics for frequency, location, and severity if those statistics no longer represent current probabilities. No one is more aware of these challenges than the insurance industry itself .
3. Discussion
Various independent research efforts on factors affecting Earth’s temperature in the 1800s and early to mid 1900s were based solely on scientific interest. Eventually these studies provided a foundation for more focused investigations of the atmosphere’s role in Earth’s temperature and global warming.
Investigations of factors affecting climate including the role of CO2 in climate change have burgeoned since the 1950s and 1960s. With an understanding of CO2’s (and other greenhouse gases’) absorbing and re-emitting infra-red (heat) radiation, the relationship reflects causation and not just correlation. Sophisticated mathematical models provide reasonable estimates, but only estimates, of the climate impacts likely to occur as Earth warms. Other models examine the changes that are likely to occur in ecology and in migration of both wildlife and humans as Earth’s climate changes.
4. Conclusion
Many do not realize investigations concerning the impact of certain gases in the atmosphere date from the mid 19th century. This means there may be a lack of understanding and appreciation about the scientific foundations of Earth’s temperature and climate studies that were conducted mainly as intellectual endeavors from the early 19th century to the mid 20th century. These studies were not aimed at policy issues but simply science. The importance of these studies lies in their technical observations and conclusions that certain gases in the atmosphere play a major role in Earth’s temperature and consequently in Earth’s climate. The studies from the 1950s on, while scientifically more advanced, carry the added burden of being seen through the lens of impact on policy decisions affecting Earth’s temperature and climate. The early studies which were done solely from intellectual interest provide assurance that arguing that certain gases in the atmosphere play a role in Earth’s temperature and thus its climate is on a solid foundation. At this point, the scientific argument that CO2 in the atmosphere affects Earth’s temperature and climate is as settled as it can be. While technical studies continue, the major issue now is mainly which policies and actions will address climate impacts most efficiently.
The preponderance of evidence suggests that Foote’s succinct observation while oriented towards the geologic past was prescient for her time and our future; she was first to say in regard to CO2):
“An atmosphere of that gas would give to our earth a high temperature; and if, as some suppose, at one period of its history, the air had mixed with it a larger proportion than at present, an increased temperature from its own action as well as from increased weight must have necessarily resulted.”
Abbreviations

AAAS

American Association for the Advancement of Science

AIP

American Institute of Physics

IGY

International Geophysical Year

IPCC

Intergovernmental Panel on Climate Change

NAP

National Academy of Sciences

NOAA

National Oceanographic and Atmospheric Administration

UCAR

University Corporation for Atmospheric Research, Center for Science Education

USDA

United States Department of Agriculture

USGS

United States Geological Survey

Acknowledgments
The author thanks L. Gilman for reviewing this manuscript for clarity and coherence.
Research Impact Statement
Researchers as far back as the mid 1800s understood, even if only qualitatively, that not only the atmosphere but certain gases in the atmosphere play a major role in Earth’s temperature. Had this history been more fully known and appreciated, it is likely fewer questions would have been raised about the reality of human impacts on Earth’s temperature and the resulting influence on climate.
Disclaimer
Any faults in this manuscript are strictly the author’s.
Conflicts of Interest
The author declares no conflicts of interest.
References
[1] Fourier, J.B.J., Mémoire sur les températures su globe terrestre et des espaces planétaires par Joseph Fourier at: (academie-sciences.fr) (in French) available from:
[2] Fourier, J. B. J., On the Temperatures of the Terrestrial Sphere and Interplanetary Space translated by R. T. Pierrehumbert (2004) Chicago, IL, USA available from:
[3] Burgess, E., 1837, "General Remarks on the Temperature of the Terrestrial Globe and the Planetary Spaces; by Baron Fourier.", American Journal of Science, Vol 32, pp. 1-20. Translation from the French, available from:
[4] Pouillet, C. S., Memoir on solar heat, the radiative effects of the atmosphere, and the temperature of space, by Richard Taylor. Scientific Memoirs 4. (1846) London. Taylor and Francis. Pgs 44-90. English translation. available from:
[5] Foote, E., Circumstances affecting heat from the Sun’s rays, American Journal of Science and Arts, 2nd Series, v. XXII/no. LXVI, November 1856, p. 382-383. available from:
[6] Sorenson, R. P., 2011. Eunice Foote’s pioneering research on CO2 and climate warming: Search and Discovery Article # 70092 5 p., (2011) available from:
[7] Tyndall, J., THE BAKERIAN LECTURE.-On the Absorption and Radiation of IHeat by Gases and Vapours, and on the Physical Connexion of Radiation, Absorption, and Conduction, Philosophical Transactions of the Royal Society of London, Vol. 151, pp. 1-36, (1861). available from:
[8] Arrhenius, S., On the Influence of Carbonic Acid in the Air on the Temperature on the Ground, Philosophical Magazine and Journal of Science, Series 5, Volume 41,, pages 237-276. photo copy prepared by R.A. Rohde for Global Warming Art (April 1996). available from: Royal Society of Chemistry
[9] Langley, S. P., "The Temperature of the Moon," Mem. of the National Academy of Sciences, vol. iv, 9th mem.(440 pages) (1890). available from:
[10] Breitler, J. C. et al., Full Moonlight-Induced Circadian Clock Entrainment in Coffea arabica. BMC Plant Biology. 20, 24 (2020).
[11] Bond, G. P., Comparison of the Light of the Sun and Moon, Memoirs of the American Academy of Arts and Sciences, New Series, Vol. 8, No. 1, pp. 287-298, (1861) available from:
[12] National Aeronautical and Space Administration (NASA), World of change: World of Change: Global Temperatures (nasa.gov) available from:
[13] Hurlbut, E. O., The Temperature of the Lower Atmosphere of the Earth, Phys. Rev. 38, 1876, Published (15 November 1931). Abstract available from:
[14] Callendar, G. S., The Artificial Production of Carbon Dioxide and Its Influence of Temperature. Quarterly Journal of the Royal Meteorological Society, 64, 223-240 (1938). available from:
[15] Callendar G. S. On the Amount of Carbon Dioxide in the Atmosphere, Tellus, 10: 2, 243-248, (1958) abstract available from:
[16] Fleming, J. R., Historical Perspectives on Climate Change, Oxford University Press, 194 p, (1998)
[17] Plass, G. N., The Carbon Dioxide Theory of Climate Change, Tellus, 8: 140-154. (1956). available from:
[18] Benedict, W. S. and Plyler, E. K. Absorption Spectra of Water Vapor and Carbon Dioxide in the Region of 2-7 Microns, Journal of Research of the National Bureau of Standards Vol. 46, No. 3, Research Paper 2194 (March 1951). available from:
[19] Chemistry Libre Texts, Infrared Spectroscopy, available from:
[20] Mason, J., The History of Climate Science. available from:
[21] American Institue of Physics (AIP), Weart, S., The Discovery of Global Warming, summary based on an article by Weart, S. R. (1997). "Global Warming, Cold War, and the Evolution of Research Plans." Historical Studies in the Physical and Biological Sciences 27(2): 319-56. (August 2021). available from:
[22] Revelle, R. and H. E. Su (1957). "Carbon Dioxide Exchange between Atmosphere and Ocean and the Question of an Increase of Atmospheric CO2 During the Past Decades." Tellus 9: 18-27. available from:
[23] Craig, H., "The Natural Distribution of Radiocarbon and the Exchange Times of CO2 between Atmosphere and Sea." Tellus 9: 1-17 (1957) available from:
[24] Anderson, E. C. and Arnold J. R., "The Distribution of Carbon-14 in Nature." Tellus 9: 28-32 (1957) available from:
[25] Keeling, C. D., Rewards and Penalties of Monitoring the Earth, Annu. Rev. Energy Environ. 23:25–82, (1998). available from:
[26] Randall, D. A., et al. Climate Models and Their Evaluation. In: Climate Change 2007: The Physical Science Basis. Contribution of Working Group I to the Fourth Assessment Report of the Intergovernmental Panel on Climate Change [Solomon, S., D. Qin, M. Manning, Z. Chen, M. Marquis, K. B. Averyt, M. Tignor and H. L. Miller (eds.)]. Cambridge University Press, Cambridge, United Kingdom and New York, NY, USA. (2007) available from:
[27] National Oceanic and Atmospheric Administration (NOAA), Carbon Dioxide now 50% higher than pre-industrial levels. available from:
[28] National Oceanic and Atmospheric Administration (NOAA) Climate Change: Atmospheric Carbon Dioxide. available from:
[29] Moore, D. Heilweck, M., Petros, P. Saving the planet with appropriate biotechnology: 1. Diagnosing the problems. Mexican Journal of Biotechnology. 6. 1-30. (2021) available from:
[30] Box, G., All Models are Wrong, available from: all models are wrong - Google Search: (accessed 4 August 24)
[31] Physics in a Nutshell, Surface Temperature of the Earth, available from:
[32] United States Department of Agriculture (USDA) Climate Hub, USDA Basics of Global Climate Models | USDA Climate Hubs. available from:
[33] University Corporation for Atmospheric Research, Center for Science Education, (UNCAR) The Very Simple Climate Model | Center for Science Education (ucar.edu) available from:
[34] National Academy of Sciences (NAS) Ornes, S., How does climate change influence extreme weather? Impact attribution research seeks answers (pnas.org) available from:
[35] Center for American Progress, American Progress Fredman, A., Regulators Should Identify and Mitigate Climate Risks in the Insurance Industry, Center for American Progress available from:
Cite This Article
  • APA Style

    Isaac, R. A. (2024). A Brief Review of Investigations into Earth’s Temperature Since the Year 1800. International Journal of Environmental Monitoring and Analysis, 12(4), 88-97. https://doi.org/10.11648/j.ijema.20241204.13

    Copy | Download

    ACS Style

    Isaac, R. A. A Brief Review of Investigations into Earth’s Temperature Since the Year 1800. Int. J. Environ. Monit. Anal. 2024, 12(4), 88-97. doi: 10.11648/j.ijema.20241204.13

    Copy | Download

    AMA Style

    Isaac RA. A Brief Review of Investigations into Earth’s Temperature Since the Year 1800. Int J Environ Monit Anal. 2024;12(4):88-97. doi: 10.11648/j.ijema.20241204.13

    Copy | Download

  • @article{10.11648/j.ijema.20241204.13,
      author = {Russell Anthony Isaac},
      title = {A Brief Review of Investigations into Earth’s Temperature Since the Year 1800
    },
      journal = {International Journal of Environmental Monitoring and Analysis},
      volume = {12},
      number = {4},
      pages = {88-97},
      doi = {10.11648/j.ijema.20241204.13},
      url = {https://doi.org/10.11648/j.ijema.20241204.13},
      eprint = {https://article.sciencepublishinggroup.com/pdf/10.11648.j.ijema.20241204.13},
      abstract = {For billions of years, natural processes alone, often working over millennia, drove Earth’s temperature and climate. For the last several centuries, human activities are a new driving force that is acting on a very short time scale. Knowing history helps chart necessary future actions with greater confidence. Since the end of the 17th century, investigations relating to Earth’s temperature and its climate have evolved from only scientific interest to also include practical concerns triggered by global warming. The early studies were relatively episodic with gaps of a decade or more common until the mid 20th century when they burgeoned starting with the International Geophysical Year. From the early to mid 1800s, to the early to mid 20th century, the investigations were at the initiation of the individual researchers. Starting in the mid 1950s, the investigations became more extensive, comprehensive and interrelated. Early researchers inferred that the atmosphere played a role in Earth’s temperature, and as far back as the 1850s it was concluded that higher CO2 concentrations in the atmosphere could result in warming Earth. Later investigations provided information on the mechanism which established that atmospheric CO2 concentration and its absorption and re-emitting of infrared radiation was a major factor in Earth’s temperature. Further, its increasing atmospheric concentration is a major driver of a warming globe at a rate far surpassing those detected in the geologic record. This paper traces the history of those researches based on the premise that knowing how we arrived at our current knowledge helps in supporting future research and actions to address the consequences of Earth’s warming.
    },
     year = {2024}
    }
    

    Copy | Download

  • TY  - JOUR
    T1  - A Brief Review of Investigations into Earth’s Temperature Since the Year 1800
    
    AU  - Russell Anthony Isaac
    Y1  - 2024/08/27
    PY  - 2024
    N1  - https://doi.org/10.11648/j.ijema.20241204.13
    DO  - 10.11648/j.ijema.20241204.13
    T2  - International Journal of Environmental Monitoring and Analysis
    JF  - International Journal of Environmental Monitoring and Analysis
    JO  - International Journal of Environmental Monitoring and Analysis
    SP  - 88
    EP  - 97
    PB  - Science Publishing Group
    SN  - 2328-7667
    UR  - https://doi.org/10.11648/j.ijema.20241204.13
    AB  - For billions of years, natural processes alone, often working over millennia, drove Earth’s temperature and climate. For the last several centuries, human activities are a new driving force that is acting on a very short time scale. Knowing history helps chart necessary future actions with greater confidence. Since the end of the 17th century, investigations relating to Earth’s temperature and its climate have evolved from only scientific interest to also include practical concerns triggered by global warming. The early studies were relatively episodic with gaps of a decade or more common until the mid 20th century when they burgeoned starting with the International Geophysical Year. From the early to mid 1800s, to the early to mid 20th century, the investigations were at the initiation of the individual researchers. Starting in the mid 1950s, the investigations became more extensive, comprehensive and interrelated. Early researchers inferred that the atmosphere played a role in Earth’s temperature, and as far back as the 1850s it was concluded that higher CO2 concentrations in the atmosphere could result in warming Earth. Later investigations provided information on the mechanism which established that atmospheric CO2 concentration and its absorption and re-emitting of infrared radiation was a major factor in Earth’s temperature. Further, its increasing atmospheric concentration is a major driver of a warming globe at a rate far surpassing those detected in the geologic record. This paper traces the history of those researches based on the premise that knowing how we arrived at our current knowledge helps in supporting future research and actions to address the consequences of Earth’s warming.
    
    VL  - 12
    IS  - 4
    ER  - 

    Copy | Download

Author Information