Research Article | | Peer-Reviewed

Anthropogenic Drivers of Spatial Trends in Groundwater Quality in the Upper Athi River Basin of Kenya, East Africa

Received: 26 June 2024     Accepted: 10 July 2024     Published: 23 July 2024
Views:       Downloads:
Abstract

Rapid urbanization and population growth in the upper Athi River basin in Kenya have increased the strain on the sub catchments water supply and sanitation situation. Due to increasing demand, inadequate supply of drinking water and lack of sanitation facilities, people in the sub-catchment are increasingly reliant on groundwater as a primary or supplementary water source. However, the use of on-site wastewater systems and agricultural pollution, mainly from runoff containing fertilizers, pesticides, herbicides, and faeces, pose a threat to groundwater in the sub catchment. Subsequently, the current study was conducted in the Thiririka sub catchment, Kiambu County, Kenya, to determine the safety of groundwater sources and to examine the factors influencing groundwater quality in the catchment area. This study assessed the influence of anthropogenic activities on the physical, chemical, and bacteriological quality of groundwater in the Upper Athi River basin of Kenya between April and June 2022. Twenty variables were analyzed and compared with water quality standards to determine hydro chemical characteristics, evidence of contamination, and suitability of groundwater. Shallow wells (SW) had higher concentrations of major ions and key parameters than boreholes (BH), such as alkalinity (7%), turbidity (96%), nitrates (92%), sulfates (48%), phosphates (93%), chlorides (77%), potassium (84%), sodium (30%) and fecal coliforms (99%) significant at p < 0.01. Concentrations of eleven water quality variables however were comparable in both systems. Farming, animal husbandry, and pit latrines were negatively but significantly correlated with the water quality of SW explaining substantial amounts of variation (≤ 45%) in concentrations of water quality variables. Ionic and coliform levels increased with decreasing distance and vice versa. IDW interpolation maps were generated in ArcGIS software to determine the spatial variability of groundwater quality in the basin. Anthropogenic activities such as pit latrines and animal husbandry impaired the quality of groundwater which in most cases was not potable.

Published in International Journal of Environmental Monitoring and Analysis (Volume 12, Issue 4)
DOI 10.11648/j.ijema.20241204.11
Page(s) 58-73
Creative Commons

This is an Open Access article, distributed under the terms of the Creative Commons Attribution 4.0 International License (http://creativecommons.org/licenses/by/4.0/), which permits unrestricted use, distribution and reproduction in any medium or format, provided the original work is properly cited.

Copyright

Copyright © The Author(s), 2024. Published by Science Publishing Group

Keywords

Boreholes, Fecal Coliforms, IDW Interpolation, Groundwater Quality, Shallow Well, Upper Athi River Basin

1. Introduction
Groundwater is a life-sustaining resource that provides water to many people and influences the health of many ecosystems . However, it is part of an extremely small fraction of freshwater available for human use. Only 3% of global water resources are freshwater which is largely held in polar ice caps and glaciers (69%) and groundwater (30%). It is projected that by 2030, the total demand for freshwater resources in some developing areas of the world will outstrip supply by 50% because of human-driven factors that will potentially alter the spatial and temporal distribution of freshwater quantity and quality . Groundwater provides one of the realistic water supply options for meeting rural demand as alternative water resources can be unreliable and expensive to develop particularly when surface water systems in most developing countries suffer from heavy pollution . Groundwater quality is affected by both natural and anthropogenic factors and degradation in developing countries is increasingly becoming a threat to the sustainability of these natural water resources .
In Kenya, future projections show that increased consumption of freshwater resources resulting from population growth will drive per capita available water downward from 650m3/year in 2012 to 359m3/year by 2020 . Approximately 42% of the residents in rural areas and 88% of city dwellers have pure drinking water but the deficit is supplemented by shallow wells and boreholes to meet water demand for domestic purposes . Most of the population of Kenya’s two major cities, Nairobi and Mombasa depend on BH, SW, rivers, and water supply vendors to meet their water needs . Pollution by organic, inorganic, and microbial matter is a major threat to the sustainability of the already scarce water resources of Kenya . The presence of pollutants in groundwater and surface water systems is driven by hydrological factors, topography, and human activities . Groundwater contamination is driven by unplanned urban developments, urban sprawl, poor sanitary infrastructure (pit latrines), open defecation by both humans and livestock and waste dumps .
The Upper Athi is a major river basin in Kenya and has been cited as the only basin in Kenya to have a water deficit . Major anthropogenic activities in the basin include slaughterhouses, tanneries, fishing industries, petrochemical industries, and agro-processing plants . Industrial effluents contribute to heavy metal pollution in water bodies in the catchment . The spatial variability of water quality parameters in groundwater and the extent of its use in the Athi basin have been documented . These studies have revealed high fecal contamination of groundwater in the Athi basin reducing its suitability for domestic use however about 50% of BH and SW close to coastal areas contain hard and saline water evident of saltwater intrusion .
This study aimed to collect one of the most comprehensive datasets on groundwater quality by determining the water quality characteristics of groundwater comprising boreholes (BH) and shallow wells (SW) in the Upper Athi Basin of Kenya. We also assess how various human activities impact groundwater quality. The results will provide a baseline for water quality management, decision-making by policymakers, and monitoring of long-term trends in groundwater quality in the basin. The results are compared to the National Environmental Management Authority (NEMA) Kenya, the United States Environmental Protection Agency (USEPA), and World Health Organization (WHO) standards.
2. Material and Methods
2.1. Study Area
The Upper Athi River Basin is in the Gatundu South Constituency within the Kiambu County of Kenya and comprises three sub catchments, Theta, Thiririka, and Rwabura. The jurisdiction is made up of four administrative provinces of central Nairobi and Eastern Rift Valley (Figure 1) extending from the Ngong Hills and parts of Aberdares in the Northwest and lies between Latitudes 0° 5122.00 and 1° 9 25.00 south of the equator and longitude 36° 34 48.00 and 37° 2 10.00 east of the equator. The drainage basin occupies approximately an area of 165 km2 and reaches an altitude of 1500 m to 2600 m above mean sea level, abutting the Rift Valley to the west, the Yatta Plateau to the east, and the Indian Ocean to the southeast.
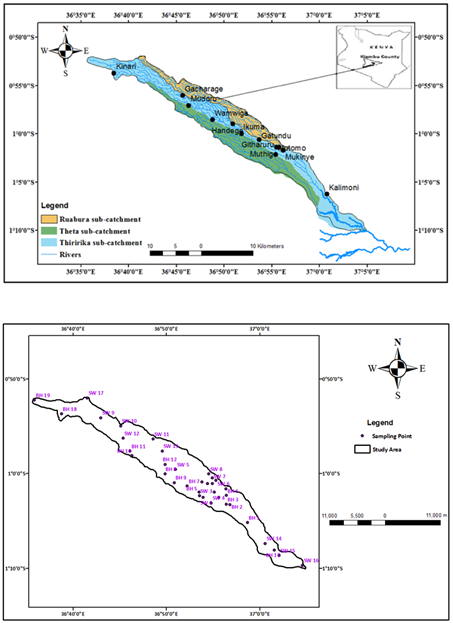
Figure 1. Map of the Upper Athi drainage basin and its location in Kenya (upper panel) and groundwater sampling stations in the Upper Athi drainage basin (lower panel).
The topography of the area is varied as well as the climate that fluctuates across the catchment, typically being sub-humid in the upper zone. There are two distinct rainy seasons in the catchment; March-May and October-November. The daily temperatures range from 18°C in the upper zone of the region to over 29°C. The primary sources of water for the main Athi River originate from the Ondiri Springs, the Tigoni Falls, the Kikuyu escarpment, and the Kabete and Karura forests. The upper Athi catchment area is drained by the main Athi River with the Koma, Ndaragu, Ruiru, Ruaraka, and Mathare. The catchment is characterized by significant economic activity, principally in the large urban centers of Nairobi, Machakos, and Thika, however, there are many other significant urban centers in the catchment. The drainage basin is characterized by several tributaries, the main ones being the Nairobi River, Ruiru, Thirika and Ndarugu Rivers containing significantly large aquifers. The upper zone, which is predominantly volcanic, has relatively good aquifers of considerable value for domestic, community, and commercial water supply.
2.2. Groundwater Sampling
Boreholes and shallow wells possess similar morphometric features but differ mainly in their depth. Boreholes are simply deep-constructed mechanical wells meant to locate groundwater, typically in arid areas where access to good quality surface water is lacking. We classified boreholes as characteristically deep, tube wells ~ 15 m deep compared to the more superficial shallow wells of ≤ 5 m. Duplicate monthly samples were collected at monthly intervals between April and June 2022. Nineteen BH and seventeen SW were randomly selected and marked with a GARMIN etrex 10 GPS device for their spatial location. SW are poorly constructed, superficial, open systems embedded within intense farming and animal husbandry activities and proximal to pit latrines (septic systems). By contrast, BH are properly engineered systems detached from human activities and thus have an expected lower risk of contamination. Groundwater was sampled for analysis of twenty physicochemical and microbial parameters (Table 1). Sampling followed standard procedures described by APHA . The sampling bottles were acid-washed and rinsed with distilled water and allowed to air dry overnight before use.
Glass bottles for collecting microbial samples were sterilized by autoclaving. In the field, BH and SW were purged a few minutes before sampling. All sampling equipment were calibrated and cleaned with 1% Alconox™ detergent followed by rinsing with 400 L of distilled water. Samples were filtered with 142 mm filter paper of 0.45 µm pore size. Water quality variables were measured with various instrumentation and techniques. pH and turbidity were measured in situ using the portable PHS-25 pH meter and AL 250T-IR Turbidimeter. Similarly, electrical conductivity (EC) and total dissolved solids (TDS) were measured using Portable OakTon 510 Series electrical conductivity meter. Samples for laboratory analysis were freeze-stored in an ice cooler at a temperature of 4°C and transported to the laboratory for further analysis. In the laboratory, samples were analyzed for major ions, trace metals, and microbial parameters within 6-24 hours following sampling.
2.3. Laboratory Analysis
Laboratory analyses of all water quality parameters followed standard test procedures. Before analysis, samples were acidified to pH < 2 with 10% analytical grade HNO3. Hardness was determined through Ethylenediaminetetraacetic acid (EDTA) titration. Chloride (Cl-) was analyzed by Argentometric titration while sodium (Na+) and potassium (K+) were cations measured with a flame photometer (Sherwood Model 140 Flame Photometer). Phenol disulfonic, SPADNS spectrophotometry, and nephelometric methods were used to measure the concentrations of nitrates, fluoride, and sulfate anions . For analysis of calcium, iron, magnesium, and zinc cations, aliquots were digested in HNO3, appropriately diluted, and aspirated. A blank solution was similarly prepared. Iron analyses were performed using an Atomic Absorption Spectrophotometer (AAS) (Buck Scientific Mode 240 VGP) using acetylene gas fuel and air oxidizer.
Calibration curves were prepared separately for analysis of all the metals by running suitable concentrations of the standard solutions. The digested samples were aspirated into the fuel-rich air-acetylene flame and the concentrations of the metal ions were determined from the calibration curves. Average values of three replicates were taken for each determination. The absorbance of the blank was taken before the analysis of the samples . The membrane filtration technique was used to enumerate fecal coliform levels of the sampled water within 6-24 hours after sampling. The sample was filtered through the membrane filter after which the filters were placed onto modified fecal coliform agar (mFc) and cultured at 41°C for 24 hours. After incubation, typical colonies were identified and counted. A colony counter was used to record values in triplicates. The concentration of fecal coliform bacteria was expressed as colony-forming units (CFUs) per 100 mL (cfu/100 mL). Fecal coliforms were detected as blue colonies on the mFc agar. Values of physicochemical and microbiological parameters analyzed were compared with reference guideline/action levels prescribed by the (Table 1).
2.4. Statistical Analysis
Statistical analysis was carried out with SYSTAT 10 (Systat Inc) software to derive means and standard deviation of measured parameters for SW and BH. SW was categorized according to the dominant land use or human activity that was closely associated with it. Pollution sources and their effects on groundwater were quantified in terms of distance from the recipient groundwater system. The mean distance from the pollution source was correlated with the concentrations of each parameter in the SW to determine the extent to which water quality parameters could best be explained by specific pollution sources using Pearson pairwise correlation at p< 0.01 significance level.
2.5. Mapping of Ground Water Quality
The topographic sheet of 1:50,000 scales obtained from the Survey of Kenya (SOK) was georeferenced in ArcGIS software to generate base maps for analysis. The sample IDs used were coded in ArcGIS software and converted into a raster dataset.
The spatial and the non-spatial databases formed were integrated for the generation of spatial distribution (thematic) maps of each of the analyzed water quality parameters through spatial interpolation.
Table 1. Water quality parameters and recommended reference guideline values; National Environment Management Authority, Kenya (NEMA), Guidelines on Drinking Water Quality and Effluent Monitoring (2008), United States Environment Protection Agency (USEPA), 2012 Edition of the Drinking Water Standards and Health Advisories (2012), World Health Organization (WHO), Guidelines for Drinking Water Quality, Fourth Edition, (2017).

Parameter

NEMA (2007)

USEPA (2014)

WHO (2017)

pH

6.5 - 8.5

6.5 - 8.5

6.5 - 8.5

EC (uS/cm)

1200

500

1000

TDS (mg/l)

-

500

1500

Hardness

-

-

200

Alkalinity

-

-

500

Turbidity (NTU)

-

5

4

Nitrate (mg/l)

10

10

50

Sulphate (mg/l)

250

250

250

Zinc (mg/l)

1.5

4

4

Phosphate (mg/l)

30

30

30

Chloride (mg/l)

250

250

250

Fluoride (mg/l)

1.5

2.0

1.5

Iron (mg/l)

0.3

0.3

0.3

Potassium (mg/l)

200

200

200

Sodium

200

200

200

Manganese (mg/l)

-

0.4

0.4

Calcium

200

200

200

Magnesium (mg/l)

100

-

150

Microbial parameter

0 cfu/100ml

0 cfu/100ml

cfu/100ml

The Inverse Distance Weighted (IDW) interpolation methodology of ArcGIS software was used to generate the spatial distribution maps of the analyzed physicochemical parameters. IDW is a type of deterministic method for multivariate interpolation. It assumes that the value of an attribute ‘z’ (physicochemical) at some unvisited point is a distance-weighted average of data points occurring within a neighborhood surrounding the unvisited point. The unknown value is estimated by Equation 1. The weighting of the sampled location usually depends on the power parameter ρ. A power of two (2) is adopted for IDW implying that when the distance increases, the weight decreases exponentially.
Z(So) =i=1niZ(Si)(1)
where,
Z (Si) = the measured value at the ith location.
λi = an unknown weight for the measured value at the ith location.
So = the prediction location.
n = the number of measured values.
The weight λi is calculated as follows:
λi =dio-pt=0ndio-p(2)
where,
dio is the distance between the predictions
So, and each of the measured locations Si
t=0n1=1  (3)
3. Results
3.1. Spatial Distribution of Groundwater Systems in the Basin
Sampled BH and SW were evenly distributed within the basin (Figure 1). SW was in areas of intense human activity near farms, cattle kraals, and pit latrines. The mean distance of SW from pit latrines, cattle kraal, and farms was 8.73 m, 7.36 m, and 9.42 m.
3.2. Water Quality Characteristics of Boreholes
Nineteen boreholes were studied for physicochemical and biological characteristics and were used as a control because they were isolated from human activities and generally had lower anion and cation content (Table 2). The water was slightly acidic, with low turbidity and increased hardness. Concentrations of most water quality variables were like their counterparts in the SW except for fecal coliforms that were present in BH at low but highly variable levels (Table 2). Electrical conductivity and TDS were high but the content of the following anions: nitrate, sulfate, phosphate, and chloride were low in comparison with SW. The groundwater in the basin showed wide variations in chemical composition. The most significant finding from this study is the high content of anions and cations in groundwater and the presence of fecal coliform contamination of BH and SW with excessively high amounts in SW. Iron, manganese, electrical conductivity, and hardness were above the threshold levels for potability in both BH and SW but nitrates phosphates, chloride, and turbidity were excessively high in SW well above the WHO standards. Groundwater systems were particularly deficient in calcium and magnesium.
3.3. General Water Quality Characteristics of SW
Shallow wells by contrast contained more acidic, highly turbid, and hard water and had higher cationic content compared to BH (Tables 2 and 3). They were also contaminated with extremely high levels of fecal coliforms (Tables 2 and 3). The number of dissolved constituents seems to be high as reflected in the high electrical conductivity and TDS measurements, but equally high concentrations were observed in the BH (Table 2). Similar trends were observed for temperature, pH, hardness, fluoride, iron, manganese, calcium, magnesium, and zinc (Table 1).
3.3.1. Contrasted Water Quality Patterns in BH and SW
Both BH and SW contained a large range of cationic and anionic elements. Among the cationic elements, sodium, potassium, and iron were low in BH but high in SW. Manganese, magnesium, zinc, and calcium had similar values in both systems. Concerning ionic content, nitrates, sulfate, phosphate, chloride, and fluoride were consistently higher in SW than in BH. SW differed from BH by having higher levels of alkalinity (7%), turbidity (96%), nitrates (92%), sulfates (48%), phosphates (93%), chlorides (77%), potassium (84%), sodium (30%) and fecal coliforms (99%) (Table 2). The differences were significant at the p < 0.05 probability level. Furthermore, there were marked differences in the range and variability of the water quality parameters (Table 2). Among SW, there was greater range and variability in the concentration of anions than cations (Table 2). Similar trends were observed in the levels of fecal coliforms measured. Besides the highly contrasted ionic composition of groundwater systems, common patterns could be observed. Similarly, conductivity, hardness, TDS, turbidity, potassium, manganese, zinc, fluoride, and pH showed similar degrees of variation in both SW and BH (Table 3).
Table 2. Water quality parameters in boreholes and shallow wells of this study compared with groundwater quality reference guideline values of the World Health Organization (WHO) 2017 fourth edition. Values above WHO standards are indicated in bold.

Parameter

BH

SW

WHO (2017)

pH

4.87 - 7.92

4.4 - 7.0

6.5 - 8.5

EC (uS/cm)

483.0 - 1330.0

477.0 - 1250.0

1000

TDS (mg/l)

309.6 - 850.0

302.0 - 789.9

1500

Hardness

214.2 - 310.5

22.0 - 423.3

200

Alkalinity

98.9 - 176.5

106.2 - 201.4

500

Turbidity (NTU)

0.9 - 8.8

6.0 - 381.3

4

Nitrate (mg/l)

0.27 - 3.6

4.6 - 71.1

50

Sulphate (mg/l)

20.7 - 47.2

45.1 - 125.4

250

Zinc (mg/l)

0.98-3.13

1.1- 3.2

4

Phosphate (mg/l)

0.84 - 2.05

10.1- 50.3

30

Chloride (mg/l)

37.40 - 163.00

139.6 - 500.0

250

Fluoride (mg/l)

-0.52

0.02-0.76

1.5

Iron (mg/l)

3.03 - 9.04

3.8 - 21.7

0.3

Potassium (mg/l)

0.68 - 6.01

5.1 - 30.4

200

Sodium

14.50 - 31.78

14.7 - 49.0

200

Manganese (mg/l)

0.39-2.58

0.08 - 1.91

0.4

Calcium

31.06-48.84

23.2 - 49.1

200

Magnesium (mg/l)

26.50-47.22

27.1 - 43.2

150

Microbial parameter

3.00 - 51.00

106.0 - 342.0

cfu/100ml

3.3.2. Relationship Between SW Water Quality and Pollution Sources
Most sources of pollution examined exhibited negative but significant statistical relationships with the chemical constituents in the SW (Table 4). Consequently, many water quality variables were negatively and significantly correlated with the distance of the pollution sources (Table 4). Ionic content and coliform levels in the SW were highly variable concerning the proximity of pollution sources close to the SW. Pollution points located at shorter distances were correlated with increasing concentrations of water quality variables in SW. Turbidity and water hardness were considerably high in SW even though alkalinity, chlorides, magnesium, and fluorides were also significant at p < 0.01. Less than 45% of the variation in all these variables could be explained by farm sources (Table 4). However, the covariation of farms with phosphates and sulfates were weakly correlated and nitrates showed a positive correlation with farms.
Hardness was the major water quality variable that showed a significantly high but negative correlation with cattle kraals (r = - 0.62, p < 0.01) as were turbidity (r = - 0.31, p < 0.01) and magnesium (r = - 0.34, p < 0.01). The remaining water quality variables in the SW were not affected by cattle kraals. Cattle kraals also showed a significant relationship with moderate levels of fecal coliform levels present in the SW (r = - 0.31, p < 0.01). The statistical relationships examined between cattle kraals and water quality variables did not yield adequate significant effects to explain the low levels and variation in most of the water quality variables measured in SW.
Though nitrates and sodium were positively and significantly correlated with farm activities, the latter could not account for most of the variations in nitrates and sodium. Phosphates, manganese, magnesium, turbidity, and alkalinity all showed significant negative correlations with farms. Farms could only explain less than 50% of the variation in concentrations of these parameters in the SW.
Pit latrines accounted for 62% of the variation in fecal coliforms in the SW but variations in zinc (42%), p < 0.01), calcium (51%, p < 0.01), turbidity (47%, p < 0.01) and alkalinity (35%, p < 0.01) though positively correlated with distance, showed decreasing concentrations with increasing distance from SW Anionic constituents such as nitrates and chlorides increased significantly in the SW with increased proximity to pit latrines. Similar trends were observed with cations magnesium and potassium with the latter significant at p < 0.05.
3.4. GIS Concentration Maps for Water Quality
The generated thematic maps for the anions (NO3 -, SO4 2-, PO4 3-, F-, Cl-) as illustrated (Figures 2 and 3), revealed a general increase towards the main flow direction from north to south across the basin. The generated concentration maps for the cations (Ca2+, K+, Na+, Fe3+, Mn2+, Mg2+, and Zn +) in the study area showed a general increase from the north to the southern portions of the area with the highest values recorded in the north-eastern portions and middle parts of the sub catchments (Figures 3 and 4).
Table 3. Mean, standard deviation (sd.±), range (min. and max.) of water quality parameters in Boreholes (BH) and Shallow Wells (SW) and statistical significance of the means of each water quality parameter between BH and SW systems. Sample size (n) = 17.

Parameter

BH

SW

BH vrs SW

Range

Mean ± sd

Range

Mean ± sd

5% Significance

Temp.

20.3 - 24.9

23.1 ± 0.9

21.4 - 25.6

23.1 ± 1.0

p = 0.982

Conductivity

483.0 - 1330.0

736.3 ± 195.3

477.0 - 1250.0

703.0 ± 192.3

p = 0.440

TDS

309.6 - 850.0

481.7 ± 132.7

302.0 - 789.9

449.7 ± 123.3

p = 0.268

pH

4.87 - 7.92

6.5 ± 0.7

4.4 - 7.0

5.7 ± 0.6

p = 0.001

Hardness

214.2 - 310.5

254.0 ± 22.9

22.0 - 423.3

250.5 ± 53.5

p = 0.727

Alkalinity

98.9 - 176.5

144.8 ± 22.6

106.2 - 201.4

156.3 ± 26.7

p = 0.053

Turbidity

0.9 - 8.8

2.7 ± 2.2

6.0 - 381.3

66.9 ± 106.2

p = 0.002

Nitrates

0.27 - 3.6

1.7 ± 1.0

4.6 - 71.1

21.6 ± 18.7

p = 0.001

Sulfates

20.7 - 47.2

34.5 ± 6.6

45.1 - 125.4

66.7 ± 18.9

p = 0.001

Phosphates

0.84 - 2.05

1.2 ± 0.2

10.1- 50.3

16.3 ± 8.3

p = 0.001

Chlorides

37.40 - 163.00

72.1 ± 38.7

139.6 - 500.0

314.8 ± 108.1

p = 0.001

Fluorides

- 0.52

0.2 ± 0.1

-0.76

0.28 ± 0.2

p = 0.013

Iron

3.03 - 9.04

5.0 ± 1.7

3.8 - 21.7

8.0±4.5

p = 0.001

Potassium

0.68 - 6.01

2.3 ± 1.5

5.1 - 30.4

14.3±5.4

p = 0.001

Sodium

14.50 - 31.78

21.6 ± 5.5

14.7 - 49.0

31.0±10.2

p = 0.001

Manganese

0.39-2.58

0.9 ± 0.6

0.08 - 1.91

0.8±0.4

p = 0.078

Calcium

31.06-48.84

41.9 ± 4.0

23.2 - 49.1

40.6±4.9

p = 0.337

Magnesium

26.50-47.22

36.3 ± 5.1

27.1 - 43.2

36.2±4.3

p = 0.920

Zinc

0.98-3.13

± 0.6

1.1- 3.2

1.6±0.6

p = 0.580

Fecal Coliforms

3.00 - 51.00

12.3 ± 11.8

106.0 - 342.0

194.5±62.2

p = 0.001

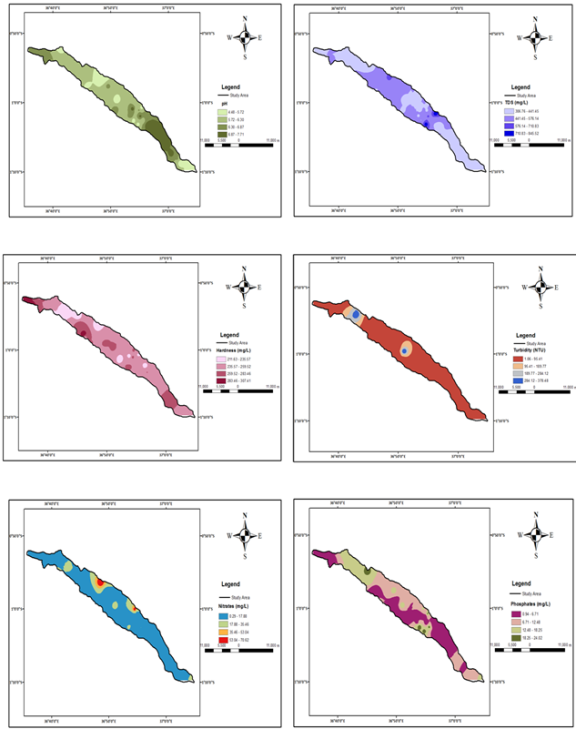
Figure 2. Water quality concentrations of pH, TDS, hardness, turbidity, nitrates and phosphates in shallow wells and boreholes in the basin.
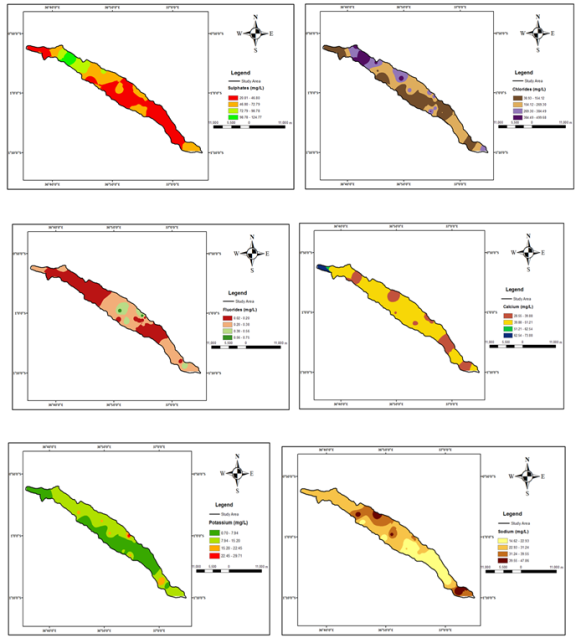
Figure 3. Spatial water quality concentrations of sulfates, chlorides, fluoride, calcium, potassium and sodium in shallow wells and boreholes in the basin.
Table 4. Correlation coefficients and statistical significance between the location of pollution sources (cattle kraals, pit latrines, farms) and concentration of each water quality parameter in shallow wells.

Parameter

Farms

Cattle Kraals

Pit Latrines

r

p < 0.01

R

p < 0.01

r

p < 0.01

Temp.

0.019

p = 0.001

-0.202

p = 0.001

0.320

p = 0.001

EC (uS/cm)

0.086

p = 0.001

0.007

p = 0.001

0.320

p = 0.001

TDS (mg/L)

0.088

p = 0.001

0.008

p = 0.001

-0.077

p = 0.001

pH

-0.205

p = 0.036

-0.018

p = 0.001

-0.070

p = 0.001

Hardness (mg/L)

-0.432

p = 0.001

-0.602

p = 0.001

-0.008

p = 0.001

Alkalinity (mg/L)

-0.314

p = 0.001

-0.219

p = 0.001

0.346

p = 0.001

Turbidity (NTU)

-0.407

p = 0.044

-0.311

p = 0.048

0.467

p = 0.052

Nitrates (mg/L)

0.260

p = 0.006

-0.011

p = 0.015

-0.431

p = 0.014

Sulphates (mg/L)

-0.063

p = 0.001

0.009

p = 0.001

-0.193

p = 0.001

Phosphates (mg/L)

-0.129

p = 0.001

0.252

p = 0.001

-0.174

p = 0.008

Chlorides (mg/L)

-0.331

p = 0.001

-0.076

p = 0.001

-0.435

p = 0.001

Fluorides (mg/L)

-0.238

p = 0.001

-0.208

p = 0.001

-0.210

p = 0.001

Iron (mg/L)

0.010

p = 0.680

0.409

p = 0.447

-0.053

p = 0.383

Potassium (mg/L)

-0.059

p = 0.001

-0.165

p = 0.005

-0.227

p = 0.035

Sodium (mg/L)

0.275

p = 0.001

-0.117

p = 0.001

0.208

p = 0.001

Manganese (mg/L)

-0.224

p = 0.001

-0.217

p = 0.001

0.095

p = 0.001

Calcium (mg/L)

-0.118

p = 0.001

0.206

p = 0.001

0.505

p = 0.001

Magnesium (mg/L)

-0.354

p = 0.001

-0.340

p = 0.001

-0.279

p = 0.001

Zinc (mg/L)

0.449

p = 0.001

-0.201

p = 0.001

0.415

p = 0.001

Faecal Coliforms cfu/100ml

-0.048

p = 0.001

-0.381

p = 0.001

-0.620

p = 0.001

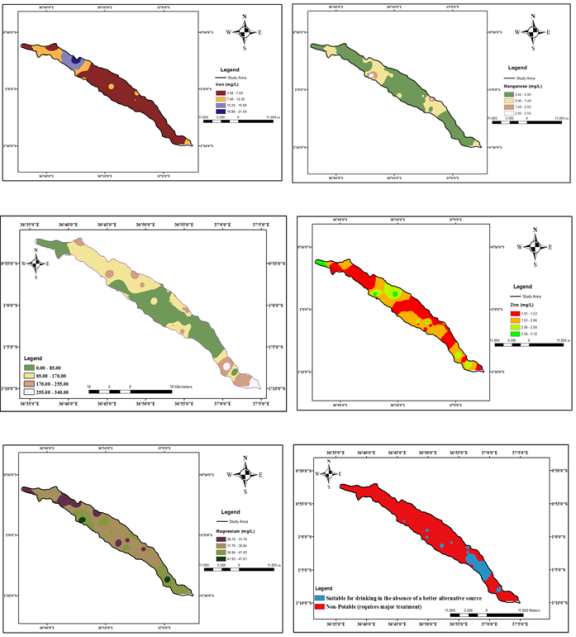
Figure 4. Spatial water quality concentrations of iron, magnesium, manganese, zinc and ground water quality zone map showing the suitable and non-suitable zone of ground water in the study area.
4. Discussion
Boreholes and shallow wells showed similarities in chemical composition but also a high degree of chemical and bacteriological differences. These ranges of concentrations of the various parameters suggest that both natural and anthropogenic factors may significantly affect water quality in the groundwater systems. The close association with human activities could potentially impact quality characteristics. The short distances of BH and SW to human activities suggest the potential for high contamination and pollution.
Boreholes showed generally better water quality than shallow wells however both contained levels of fecal coliforms not permitted in drinking water based on WHO water quality standard which sets zero microbial loads for acceptable water quality. The patterns of water chemistry observed in shallow wells and boreholes are like results obtained by who conducted similar investigations in Kiambu County, Kenya. Major cations groups tested in the BH were below the threshold recommended values by WHO . Cations (Zn, Mg, K) were detected in lower levels in ranges. Although these are not directly related to any significant health hazards, however, the presence of their salts sometimes imparts a bad taste on water. Anions (Cl-, F-, S, NO3- and PO43-) were also lower than recommended limit values across all monitored boreholes. The tested turbidity was high in most of the boreholes which were above the recommended threshold limits . Turbidity in water is caused by total suspended particles, colloidal matter, or the presence of microbial contamination that obstructs light transmission through water or a combination of the two . The high level of turbidity may be attributed to poor well construction which allows surface debris from run-off to enter the well, over-drawing, or large water level changes associated with sediment flux in the well and may cause water to become turbid. Iron was detected at high concentrations across all monitored boreholes above the recommended standard of 0.3 mg/l . Dissolved Fe and Mn are secondary chemical contaminants and a limitation to the extent of utilizing groundwater drinking water as a drinking water source . The levels of Fe in boreholes can be attributed to the overtime dissolution of metallic boreholes, hand pump components, oxidation-reduction potential, and bacterial metabolic activity . Igneous rocks minerals containing high iron content such as pyroxenes, amphiboles, biotite magnetite, and nesosilicate olivine rock types are characteristics of the Upper Athi basin and may potentially influence high Fe content in boreholes . Manganese levels recorded across the monitoring borehole stations ranged from 0.39 - 2.58 mg/L occurring above threshold concentrations of 0.4 mg/L prescribed by WHO . Manganese behavior shows increased similarity to Fe characteristics in boreholes at levels exceeding 0.1 mg/L causing undesirable taste and staining of sanitary and laundry wares . High Fe and Mn levels can also be due to natural hydrogeologic processes that generate unconsolidated deposits and dissolution of the underlying bedrock of the earth . The highly variable acidic content of boreholes can be attributed to the geological characteristics of the study area which falls within the pH range for naturally occurring water between 6 - 9 . Most of the boreholes were above this limit as well as the 8.5 prescribed by APHA and WHO . The types of dissolved constituents in groundwater can influence pH levels particularly dissolved carbon dioxide (CO2) which forms carbonic acid in water and acts as an important control on the pH of natural waters . Electrical conductivity and TDS were higher than the prescribed levels for drinking water determined by the WHO . The high TDS levels may be explained based on the high solubility of different minerals that are in contact with water. Water in contact with highly soluble minerals contains higher TDS levels than water in contact with less soluble minerals . Ion exchange in clays also increases TDS levels due to electrical exchange and balance between two monovalent sodium or potassium ions that must enter the solution for each divalent ion to be absorbed . The presence of high levels of fecal coliforms in boreholes suggested that they were highly contaminated and unsuitable for human use based on all the referenced water quality standards . Fecal coliform counts were higher in ranges of 3.0 - 51.00 cfu/100ml than the prescribed standard limits of WHO and APHA for drinking water quality . Although boreholes are constructed to have a stick-up above-the-ground surface, the potential for microbial contamination may be high through the activities of community end users. High TDS, pH, and EC have been shown to have a major influence on bacterial population growth in groundwater . Elevated levels of TDS and EC are an indication/high probability of bacterial contamination which is the case in the observed boreholes .
Water hardness was determined at high levels in the ranges of 214.2-310.5 mg/L which was above the levels recommended by the APHA and WHO . "Hardness" relates to concentrations of particularly magnesium and calcium in water and is usually expressed as an equivalent concentration of dissolved calcite (CaCO3). The classification scheme for water hardness is described as follows; soft water - 0 to 60 mg/L (as CaCO3); moderately hard water - 61 to120 mg/L; hard water - 121 to 180 mg/L; very hard water - over 180 mg/L . A hardness level of about 100 mg/L or less is generally not a problem in waters used for ordinary domestic purposes . Lower hardness levels, however, may be required for waters used for other purposes. This scheme suggested that the water in the boreholes was very hardwater which may have implications for drinking and other domestic uses. The low contribution of calcium to water hardness may be indicative of relatively low amounts of calcium-bearing rock minerals from the underlying aquifer. The high hardness values may be due to the introduction of polyvalent cations in the groundwater system . Though hard water is not considered a health hazard, its occurrence can be a nuisance for both domestic and industrial purposes .
The superficial depth and structure of shallow wells may readily expose them to environmental pollution from both natural and anthropogenic sources. Shallow wells were highly polluted due to exceedingly high coliform levels and increased turbidity, cations, and dissolved constituents and may not be suitable for drinking purposes. Most of the chemical parameters examined had concentrations below WHO standards for drinking water, however, iron, nitrates, phosphates, turbidity, and coliform concentrations were above permissible levels for potable water . Nitrates and phosphates naturally occur in groundwater, but excessive concentrations are associated with animal and human waste as well as agricultural practices which are prevalent in the basin . Lack of potability particularly about fecal coliforms in shallow wells has been reported in Kenya and the results reveal that lack of proper construction accounts for increased susceptibility to contamination by exposing the shallow wells to run-off containing high concentrations of dissolved and suspended substances and fecal coliforms .
Anthropogenic factors namely agricultural activities, animal husbandry, and sewage systems influenced the quality of groundwater in SW by increasing chemical content and transmission of fecal coliforms. Many of the quality indices analyzed showed that the human activities investigated had compromised the quality of groundwater either by increasing chemical content or elevating fecal coliforms. Our results revealed that the vulnerability of SW to contamination from sources of pollution was enhanced by the short intervals potential contaminants had to travel between the points of release to the recipient systems. The rate of transmission of environmental contaminants in the basin may be enhanced by a range of factors such as hydrology, soil characteristics filtration capacity, and climate change . These factors are known to facilitate or impede the diffusion of contaminants in groundwater . Furthermore, the anthropogenic variables could account for the elevated levels of cation, anion, and fecal coliforms in SW probably above the natural hydro chemical background levels. The similar proportions of most anions and cations in both SW and BH could reflect the natural geochemical background of bedrock and soil as the chemical signature of water quality of groundwater is known to be affected by rock type and mechanism of weathering . We hypothesized that the well-engineered and mechanized BH could be well-protected from pollution due to the predicted limited pathways of exposure to contaminants from point and non-point sources. However, our study found high levels of fecal coliforms in BH suggesting that our assumed water quality integrity of BH was not supported by our data. It is therefore apparent that both groundwater systems may be at risk of sewage pollution from human activities in the catchment which further renders them unsuitable and unsafe for human use without treatment. Water hardness, alkalinity, turbidity, chlorides, magnesium, and fluorides were collectively influenced by farming activities in the catchment to a significant degree. The common agriculturally driven anions in surface and groundwater such as nitrates, phosphates, and sulfates originated from chemical fertilizer applications on farms and were however not found to be connected to farming activities because of their weak statistical relationship. This may indicate low application rates of inorganic fertilizers containing nitrates, phosphates, and sulfates in agricultural activities in the basin. Similarities in concentrations and ranges of eleven water quality variables in both SW and BH namely temperature, electrical conductivity, total dissolved solids, pH, hardness, fluorides, iron, manganese, calcium, magnesium, and zinc indicate that both groundwater systems are impacted by the same mechanisms of anthropogenic impacts or that they could reflect the natural background geochemical characteristics of the catchment. This assertion may be supported by the evidence of fecal coliform contamination of BH. This means that both natural and anthropogenic factors may be playing significant roles in the water quality properties of groundwater systems in the catchment as reported in other studies . The bacteriological quality of both shallow wells and boreholes in the catchment was extremely poor suggesting that groundwater was highly vulnerable to pollution from sewage systems. Poor water sanitation and hygiene have been identified as the foremost factor that affects groundwater quality in developing countries . Pit latrines and animal husbandry contributed significantly to high coliform levels in SW. Human-originated sewage was responsible for 62% of the variation of fecal coliforms in SW.
5. Conclusions
The quality of groundwater in three sub catchments in the Upper Athi River Basin in Kenya was assessed in the current study. The assessment was done by determining the levels of the different physical, and chemical (heavy metals, cations, and anions) parameters in the shallow wells and boreholes. The assessment was done by determining the levels of the different physical, chemical (heavy metals, cations, and anions), and geographic information systems techniques to evaluate the quality of groundwater obtained from three sub catchments in Kenya to determine the degree of water quality and its suitability for consumption and other purposes. The study revealed that groundwater contained in boreholes and shallow wells showed varying degrees of water quality either below, above, or within the range of key water quality reference guidelines. Boreholes and shallow wells were significantly influenced by natural and anthropogenic factors affecting groundwater characteristics in the basin. The chemical content of both systems showed evidence of the geology of the basin dictating the water chemistry. Human activities such as farming, animal husbandry practices, and sanitary systems also contributed significantly to the water chemistry and bacterial loads which were excessively high. The findings of this research conclude that groundwater sourced from the three sub catchments should be treated before utilization for human consumption.
Abbreviations

AAS

Atomic Absorption Spectrophotometer

APHA

American Public Health Association

AWWA

American Water works Association

EC

Electrical Conductivity

EDTA

Ethylenediaminetetraacetic

BH

Boreholes

CFU

Colony-Forming Units

GIS

Geographic Information Systems

IDW

Inverse Distance Weighted

NEMA

National Environmental Management Authority

SOK

Survey of Kenya

SW

Shallow wells

TDS

Total Dissolved Solids

USEPA

United States Environmental Protection Agency

WEF

Water Environment Federation

WHO

World Health Organization

Author Contributions
Ebenezer Ashun: Conceptualization, Data curation, Formal Analysis, Investigation, Resources, Writing – original draft.
Naa Dedei Tagoe: Formal Analysis, Methodology, Software, Validation, Visualization, Writing – review & editing.
Data Availability Statement
The data is available from the corresponding author upon reasonable request.
Conflicts of Interest
The authors declare no conflicts of interest.
References
[1] M. Saccò, S. Mammola, F. Altermatt, R. Alther, R. Bolpagni, A. Brancelj, D. Brankovits, C. Fišer, V. Gerovasileiou, C. Griebler, S. Guareschi, G. C. Hose, K. Korbel, E. Lictevout, F. Malard, A. Martínez, M. L. Niemiller, A. Robertson, K. C. Tanalgo, M. E. Bichuette, Š. Borko, T. Brad, M. A. Campbell, P. Cardoso, F. Celico, S. J. B. Cooper, D. Culver, T. Di Lorenzo, D. M. P. Galassi, M. T. Guzik, A. Hartland, W. F. Humphreys, R. L. Ferreira, E. Lunghi, D. Nizzoli, G. Perina, R. Raghavan, Z. Richards, A. S. P. S. Reboleira, M. M. Rohde, D. S. Fernández, S. I. Schmidt, M. van der Heyde, L. Weaver, N. E. White, M. Zagmajster, I. Hogg, A. Ruhi, M. M. Gagnon, M. E. Allentoft, R. Reinecke, Groundwater is a hidden global keystone ecosystem, Glob Chang Biol 30 (2024) e17066.
[2] I. J. Harrison, P. A. Green, T. A. Farrell, D. Juffe-Bignoli, L. Sáenz, C. J. Vörösmarty, Protected areas and freshwater provisioning: a global assessment of freshwater provision, threats and management strategies to support human water security, Aquat Conserv 26 (2016) 103–120.
[3] M. Velis, K. I. Conti, F. Biermann, Groundwater and human development: synergies and trade-offs within the context of the sustainable development goals, Sustain Sci 12 (2017) 1007–1017.
[4] P. Van Tuan, Y. Jiang, T. Stigter, Y. Zhou, Understanding groundwater use and vulnerability of rural communities in the Mekong Delta: The case of Tra Vinh province, Vietnam, Groundw Sustain Dev 25 (2024) 101095.
[5] N. Khatri, S. Tyagi, Influences of natural and anthropogenic factors on surface and groundwater quality in rural and urban areas, Front Life Sci 8 (2015) 23–39.
[6] S. M. Kithiia, S. M. Kithiia, Water Quality Degradation Trends in Kenya over the Last Decade, Water Quality Monitoring and Assessment (2012).
[7] S. M. Kithiia, G. S. Ongwenyi, Some problems of water quality degradation in the Nairobi River sub-basins in Kenya, Freshwater Contamination (Proceedings of Rabat Symposium S4, (1997). IAHS Publ. no. 243, 1997
[8] F. Genter Id, G. Lestari, P. Id, E. Suleeman, L. Darmajanti, C. Priadi, T. Foster, J. Willetts, Understanding household self-supply use and management using a mixed-methods approach in urban Indonesia, PLOS Water 2 (2023) e0000070.
[9] K. Fankhauser, D. Macharia, J. Coyle, S. Kathuni, A. McNally, K. Slinski, E. Thomas, Estimating groundwater use and demand in arid Kenya through assimilation of satellite data and in-situ sensors with machine learning toward drought early action, Science of The Total Environment 831 (2022) 154453.
[10] D. A. Ondigo, A. M. Kavoo, J. Kebwaro, D. A. Ondigo, A. M. Kavoo, J. Kebwaro, Water Resources and Management under Increasing Urban Demography: A Kenyan Perspective—A Review, J Water Resour Prot 10 (2018) 919–938.
[11] V. Balaram, L. Copia, U. S. Kumar, J. Miller, S. Chidambaram, Pollution of water resources and application of ICP-MS techniques for monitoring and management—A comprehensive review, Geosystems and Geoenvironment 2 (2023) 100210.
[12] [O. Al-Hashimi, K. Hashim, E. Loffill, T. Marolt Čebašek, I. Nakouti, A. A. H. Faisal, N. Al-Ansari, A Comprehensive Review for Groundwater Contamination and Remediation: Occurrence, Migration and Adsorption Modelling, Molecules 26 (2021).
[13] A. E. Onyango, M. W. Okoth, C. N. Kunyanga, B. O. Aliwa, Microbiological Quality and Contamination Level of Water Sources in Isiolo County in Kenya, J Environ Public Health 2018 (2018).
[14] R. K. Mishra, S. S. Mentha, Y. Misra, N. Dwivedi, Emerging pollutants of severe environmental concern in water and wastewater: A comprehensive review on current developments and future research, Water-Energy Nexus 6 (2023) 74–95.
[15] S. K. Abanyie, O. B. Apea, S. A. Abagale, E. E. Y. Amuah, E. D. Sunkari, Sources and factors influencing groundwater quality and associated health implications: A review, Emerg Contam 9 (2023) 100207.
[16] N. Akhtar, M. I. Syakir Ishak, S. A. Bhawani, K. Umar, Various Natural and Anthropogenic Factors Responsible for Water Quality Degradation: A Review, Water 2021, Vol. 13, Page 2660 13 (2021) 2660.
[17] D. J. Lapworth, D. C. W. Nkhuwa, J. Okotto-Okotto, S. Pedley, M. E. Stuart, M. N. Tijani, J. Wright, Urban groundwater quality in sub-Saharan Africa: current status and implications for water security and public health, Hydrogeol J 25 (2017) 1093–1116.
[18] Mogaka, H., Gichere, S., Davis, R. and Hirji, R. (2005) Climate Variability and Water Resources Degradation in Kenya: Improving Water Resources Development and Management. The World Bank, London.
[19] F. Mulwa, Z. Li, F. F. Fangninou, F. Mulwa, Z. Li, F. F. Fangninou, Water Scarcity in Kenya: Current Status, Challenges and Future Solutions, Open Access Library Journal 8 (2021) 1–15.
[20] S. M. Kithiia, S. M. Kithiia, A Critical Analysis of the Water Quality Impacts on Water Resources in the Athi River Drainage Basin, Kenya, Water Quality - Factors and Impacts (2021).
[21] S. O. Wandiga, Use and distribution of organochlorine pesticides. The future in Africa, Pure and Applied Chemistry 73 (2001) 1147–1155.
[22] O. R. Olonga, E. Ndunda, M. Makokha, Seasonal variations of physico-chemical and microbiological characteristics of groundwater quality in Ruiru, Kiambu county, Kenya, International Journal of Scientific and Research Publications 5 (2014).
[23] N. Alfarrah, K. Walraevens, Groundwater Overexploitation and Seawater Intrusion in Coastal Areas of Arid and Semi-Arid Regions, Water 2018, Vol. 10, Page 143 10 (2018) 143.
[24] J. O. Okullo, W. N. Moturi, G. M. Ogendi, Open Defaecation and Its Effects on the Bacteriological Quality of Drinking Water Sources in Isiolo County, Kenya, Environ Health Insights 11 (2017).
[25] S. M. Kithiia, Land use changes and their effects on sediment transport and soil erosion within the Athi drainage basin, Kenya, Human Impact on Erosion and Sedimentation (1997).
[26] APHA; AWWA and WEF, Standard Methods for the Examination of Water and Wastewater, American Public Works Association (2017) 1469.
[27] WHO, Guidelines for drinking-water quality, 4th edition, incorporating the 1st addendum. Geneva: World Health Organization. Geneva, Switzerland, World Health Organization (2017).
[28] H. H. Oyem, I. M. Oyem, A. I. Usese, Iron, manganese, cadmium, chromium, zinc and arsenic groundwater contents of Agbor and Owa communities of Nigeria, Springerplus 4 (2015) 1–10.
[29] C. T. Fader, Retrofitting Boreholes Contaminated With Iron In Rural Uganda, (2011).
[30] H. J. Smith, A. J. Zelaya, K. B. De León, R. Chakraborty, D. A. Elias, T. C. Hazen, A. P. Arkin, A. B. Cunningham, M. W. Fields, Impact of hydrologic boundaries on microbial planktonic and biofilm communities in shallow terrestrial subsurface environments, FEMS Microbiol Ecol 94 (2018) 191.
[31] K. Robey, G. Tredoux, L. Chevallier, Preventing Production Borehole Clogging by In-situ Iron Removal in South African Aquifer Systems Report to the WATER RESEARCH COMMISSION Obtainable from, (2014).
[32] E. K. Ahialey, Y. Serfoh-Armah, B. K. Kortatsi, Hydrochemical Analysis of Groundwater in the Lower Pra Basin of Ghana, J. Water Resource and Protection 2 (2010) 864–871.
[33] D. U. Ophori, J. Tóth, Patterns of Ground-Water Chemistry, Ross Creek Basin, Alberta, Canada, Groundwater 27 (1989) 20–26.
[34] M. O. Awoyemi, O. D. Ajama, S. A. Adekola, A. B. Arogundade, C. D. Fashina, G. O. Akinlade, J. A. O. Oyekunle, Water and sub-soil contamination in the coastal aquifers of Arogbo, Ondo State, Nigeria, J Hydrol Reg Stud 38 (2021) 100944.
[35] A. V. Kulinkina, J. D. Plummer, K. K. H. Chui, K. C. Kosinski, T. Adomako-Adjei, A. I. Egorov, E. N. Naumova, Physicochemical parameters affecting the perception of borehole water quality in Ghana, Int J Hyg Environ Health 220 (2017) 990.
[36] M. S. Islam, M. G. Mostafa, Occurrence, Source, and Mobilization of Iron, Manganese, and Arsenic Pollution in Shallow Aquifer, Geofluids 2023 (2023).
[37] M. Owor, A. Muwanga, C. Tindimugaya, R. G. Taylor, Hydrogeochemical processes in groundwater in Uganda: a national-scale analysis, Journal of African Earth Sciences 175 (2021) 104113.
[38] R. Bondu, V. Cloutier, E. Rosa, Occurrence of geogenic contaminants in private wells from a crystalline bedrock aquifer in western Quebec, Canada: Geochemical sources and health risks, J Hydrol (Amst) 559 (2018) 627–637.
[39] Y. Zhai, X. Cao, X. Xia, B. Wang, Y. Teng, X. Li, Elevated fe and mn concentrations in groundwater in the songnen plain, northeast china, and the factors and mechanisms involved, Agronomy 11 (2021) 2392.
[40] J. D. Hem, Study and interpretation of the chemical characteristics of natural water, Water Supply Paper (1985).
[41] F. A. Armah, Relationship Between Coliform Bacteria and Water Chemistry in Groundwater Within Gold Mining Environments in Ghana, Water Qual Expo Health 5 (2014) 183–195.
[42] C. Onyancha, Z. Getenga, Geochemistry of Groundwater in the Volcanic Rocks of Nairobi City, Type : Double Blind Peer Reviewed International Research Journal Publisher: Global Journals Inc 13 (2013).
[43] A. A. G. D. Amarasooriya, T. Kawakami, Removal of fluoride, hardness and alkalinity from groundwater by electrolysis, Groundw Sustain Dev 9 (2019) 100231.
[44] Y. Wang, R. Li, X. Wu, Y. Yan, C. Wei, M. Luo, Y. Xiao, Y. Zhang, Evaluation of Groundwater Quality for Drinking and Irrigation Purposes Using GIS-Based IWQI, EWQI and HHR Model, Water 2023, Vol. 15, Page 2233 15 (2023) 2233.
[45] V. Narasaiah, B. V. Rao, Groundwater quality of an hard rock aquifer in the Subledu Basin of Khammam district, India, Appl Water Sci 11 (2021) 1–21.
[46] M. C. Mangayayam, V. Alonso-de-Linaje, K. Dideriksen, D. J. Tobler, Effects of common groundwater ions on the transformation and reactivity of sulfidized nanoscale zerovalent iron, Chemosphere 249 (2020) 126137.
[47] K. G. Gebresilasie, G. G. Berhe, A. H. Tesfay, S. E. Gebre, Assessment of Some Physicochemical Parameters and Heavy Metals in Hand-Dug Well Water Samples of Kafta Humera Woreda, Tigray, Ethiopia, Int J Anal Chem 2021 (2021).
[48] B. O. Isiuku, C. E. Enyoh, Pollution and health risks assessment of nitrate and phosphate concentrations in water bodies in South Eastern, Nigeria, Environmental Advances 2 (2020) 100018.
[49] M. Zendehbad, M. Mostaghelchi, M. Mojganfar, P. Cepuder, W. Loiskandl, Nitrate in groundwater and agricultural products: intake and risk assessment in northeastern Iran, Environ Sci Pollut Res Int 29 (2022) 78603.
[50] Bijay-Singh, E. Craswell, Fertilizers and nitrate pollution of surface and ground water: an increasingly pervasive global problem, SN Applied Sciences 2021 3: 43(2021) 1–24.
[51] E. Abascal, L. Gómez-Coma, I. Ortiz, A. Ortiz, Global diagnosis of nitrate pollution in groundwater and review of removal technologies, Science of The Total Environment 810 (2022) 152233.
[52] P. K. Mbaka, J. K. Mwangi, C. K. Kiptum, Assessment of water quality in selected shallow wells of Keiyo Highlands, Kenya, African Journal of Science, Technology, Innovation and Development 9 (2017) 329–338.
[53] M. Abbas, L. Zhao, Y. Wang, Perspective Impact on Water Environment and Hydrological Regime Owing to Climate Change: A Review, Hydrology 2022, Vol. 9, Page 203 9 (2022) 203.
[54] P. U. Dao, A. G. Heuzard, T. X. H. Le, J. Zhao, R. Yin, C. Shang, C. Fan, The impacts of climate change on groundwater quality: A review, Science of The Total Environment 912 (2024) 169241.
[55] S. Bolan, L. P. Padhye, T. Jasemizad, M. Govarthanan, N. Karmegam, H. Wijesekara, D. Amarasiri, D. Hou, P. Zhou, B. K. Biswal, R. Balasubramanian, H. Wang, K. H. M. Siddique, J. Rinklebe, M. B. Kirkham, N. Bolan, Impacts of climate change on the fate of contaminants through extreme weather events, Science of The Total Environment 909 (2024) 168388.
[56] S. A. Aram, B. M. Saalidong, P. O. Lartey, Comparative assessment of the relationship between coliform bacteria and water geochemistry in surface and ground water systems, PLoS One 16 (2021).
[57] M. N. Welguś, T. Abiye, Surface water and groundwater interaction in the Vredefort Dome, South Africa, (2021).
[58] M. O. Dinka, W. Loiskandl, J. M. Ndambuki, Hydrochemical characterization of various surface water and groundwater resources available in Matahara areas, Fantalle Woreda of Oromiya region, J Hydrol Reg Stud 3 (2015) 444–456.
[59] G. Lutterodt, M. K. Miyittah, B. Addy, E. D. O. Ansa, M. Takase, Groundwater pollution assessment in a coastal aquifer in Cape Coast, Ghana, Heliyon 7 (2021) e06751.
[60] G. Lutterodt, J. van de Vossenberg, Y. Hoiting, A. K. Kamara, S. Oduro-Kwarteng, J. W. A. Foppen, Microbial Groundwater Quality Status of Hand-Dug Wells and Boreholes in the Dodowa Area of Ghana, Int J Environ Res Public Health 15 (2018).
Cite This Article
  • APA Style

    Ashun, E., Tagoe, N. D. (2024). Anthropogenic Drivers of Spatial Trends in Groundwater Quality in the Upper Athi River Basin of Kenya, East Africa. International Journal of Environmental Monitoring and Analysis, 12(4), 58-73. https://doi.org/10.11648/j.ijema.20241204.11

    Copy | Download

    ACS Style

    Ashun, E.; Tagoe, N. D. Anthropogenic Drivers of Spatial Trends in Groundwater Quality in the Upper Athi River Basin of Kenya, East Africa. Int. J. Environ. Monit. Anal. 2024, 12(4), 58-73. doi: 10.11648/j.ijema.20241204.11

    Copy | Download

    AMA Style

    Ashun E, Tagoe ND. Anthropogenic Drivers of Spatial Trends in Groundwater Quality in the Upper Athi River Basin of Kenya, East Africa. Int J Environ Monit Anal. 2024;12(4):58-73. doi: 10.11648/j.ijema.20241204.11

    Copy | Download

  • @article{10.11648/j.ijema.20241204.11,
      author = {Ebenezer Ashun and Naa Dedei Tagoe},
      title = {Anthropogenic Drivers of Spatial Trends in Groundwater Quality in the Upper Athi River Basin of Kenya, East Africa
    },
      journal = {International Journal of Environmental Monitoring and Analysis},
      volume = {12},
      number = {4},
      pages = {58-73},
      doi = {10.11648/j.ijema.20241204.11},
      url = {https://doi.org/10.11648/j.ijema.20241204.11},
      eprint = {https://article.sciencepublishinggroup.com/pdf/10.11648.j.ijema.20241204.11},
      abstract = {Rapid urbanization and population growth in the upper Athi River basin in Kenya have increased the strain on the sub catchments water supply and sanitation situation. Due to increasing demand, inadequate supply of drinking water and lack of sanitation facilities, people in the sub-catchment are increasingly reliant on groundwater as a primary or supplementary water source. However, the use of on-site wastewater systems and agricultural pollution, mainly from runoff containing fertilizers, pesticides, herbicides, and faeces, pose a threat to groundwater in the sub catchment. Subsequently, the current study was conducted in the Thiririka sub catchment, Kiambu County, Kenya, to determine the safety of groundwater sources and to examine the factors influencing groundwater quality in the catchment area. This study assessed the influence of anthropogenic activities on the physical, chemical, and bacteriological quality of groundwater in the Upper Athi River basin of Kenya between April and June 2022. Twenty variables were analyzed and compared with water quality standards to determine hydro chemical characteristics, evidence of contamination, and suitability of groundwater. Shallow wells (SW) had higher concentrations of major ions and key parameters than boreholes (BH), such as alkalinity (7%), turbidity (96%), nitrates (92%), sulfates (48%), phosphates (93%), chlorides (77%), potassium (84%), sodium (30%) and fecal coliforms (99%) significant at p < 0.01. Concentrations of eleven water quality variables however were comparable in both systems. Farming, animal husbandry, and pit latrines were negatively but significantly correlated with the water quality of SW explaining substantial amounts of variation (≤ 45%) in concentrations of water quality variables. Ionic and coliform levels increased with decreasing distance and vice versa. IDW interpolation maps were generated in ArcGIS software to determine the spatial variability of groundwater quality in the basin. Anthropogenic activities such as pit latrines and animal husbandry impaired the quality of groundwater which in most cases was not potable.
    },
     year = {2024}
    }
    

    Copy | Download

  • TY  - JOUR
    T1  - Anthropogenic Drivers of Spatial Trends in Groundwater Quality in the Upper Athi River Basin of Kenya, East Africa
    
    AU  - Ebenezer Ashun
    AU  - Naa Dedei Tagoe
    Y1  - 2024/07/23
    PY  - 2024
    N1  - https://doi.org/10.11648/j.ijema.20241204.11
    DO  - 10.11648/j.ijema.20241204.11
    T2  - International Journal of Environmental Monitoring and Analysis
    JF  - International Journal of Environmental Monitoring and Analysis
    JO  - International Journal of Environmental Monitoring and Analysis
    SP  - 58
    EP  - 73
    PB  - Science Publishing Group
    SN  - 2328-7667
    UR  - https://doi.org/10.11648/j.ijema.20241204.11
    AB  - Rapid urbanization and population growth in the upper Athi River basin in Kenya have increased the strain on the sub catchments water supply and sanitation situation. Due to increasing demand, inadequate supply of drinking water and lack of sanitation facilities, people in the sub-catchment are increasingly reliant on groundwater as a primary or supplementary water source. However, the use of on-site wastewater systems and agricultural pollution, mainly from runoff containing fertilizers, pesticides, herbicides, and faeces, pose a threat to groundwater in the sub catchment. Subsequently, the current study was conducted in the Thiririka sub catchment, Kiambu County, Kenya, to determine the safety of groundwater sources and to examine the factors influencing groundwater quality in the catchment area. This study assessed the influence of anthropogenic activities on the physical, chemical, and bacteriological quality of groundwater in the Upper Athi River basin of Kenya between April and June 2022. Twenty variables were analyzed and compared with water quality standards to determine hydro chemical characteristics, evidence of contamination, and suitability of groundwater. Shallow wells (SW) had higher concentrations of major ions and key parameters than boreholes (BH), such as alkalinity (7%), turbidity (96%), nitrates (92%), sulfates (48%), phosphates (93%), chlorides (77%), potassium (84%), sodium (30%) and fecal coliforms (99%) significant at p < 0.01. Concentrations of eleven water quality variables however were comparable in both systems. Farming, animal husbandry, and pit latrines were negatively but significantly correlated with the water quality of SW explaining substantial amounts of variation (≤ 45%) in concentrations of water quality variables. Ionic and coliform levels increased with decreasing distance and vice versa. IDW interpolation maps were generated in ArcGIS software to determine the spatial variability of groundwater quality in the basin. Anthropogenic activities such as pit latrines and animal husbandry impaired the quality of groundwater which in most cases was not potable.
    
    VL  - 12
    IS  - 4
    ER  - 

    Copy | Download

Author Information
  • Department of Environmental and Safety Engineering, University of Mines and Technology, Tarkwa, Ghana

    Biography: Ebenezer Ashun is a Lecturer in the Department of Environmental and Safety Engineering at the University of Mines and Technology (UMaT). He also holds a PhD in Environmental Science and Engineering from Kangwon National University in the Republic of Korea and an MSc in Water Resources and Environmental Management, from Kenyatta University in Kenya. His research interests include environmental contamination and risk assessment from persistent organic pollutants (POPs), pesticides, pharmaceutical and personal care products (PPCPs), toxic metals, and other xenobiotics. He has conducted extensive work on monitoring and remediating these pollutants in air, water, and soil media. Additionally, he specializes in environmental quality monitoring, environmental auditing, water balance modelling, environmental and safety management systems.

    Research Fields: Environmental Quality Monitoring, Bioremediation, Risks Assessments, and Contaminant Behavior Analysis and Modelling.

  • Department of Geomatic Engineering, University of Mines and Technology, Tarkwa, Ghana

    Biography: Naa Dedei Tagoe is a Senior Lecturer in the Department of Geomatic Engineering at the University of Mines and Technology (UMaT). She completed her PhD studies in Geomatic at the University of Cape Town, South Africa and her Master's degree at the Stuttgart University of Applied Sciences, Germany. Her research interests include the application of geospatial tools and technologies, namely Photogrammetry, GIS, Remote Sensing, GeoAI, and Digital Twin, for environmental monitoring and climate change to promote environmental sustainability. Additionally, she focuses on the intersection between gender and climate vulnerability, as well as heritage documentation and preservation.

    Research Fields: Geospatial Tools and Technologies, Environmental Monitoring and Climate Change, Gender and Climate, Vulnerability, Heritage Documentation and Preservation.

  • Abstract
  • Keywords
  • Document Sections

    1. 1. Introduction
    2. 2. Material and Methods
    3. 3. Results
    4. 4. Discussion
    5. 5. Conclusions
    Show Full Outline
  • Abbreviations
  • Author Contributions
  • Data Availability Statement
  • Conflicts of Interest
  • References
  • Cite This Article
  • Author Information