Research Article | | Peer-Reviewed

Climate Change Impact on Rain-Fed Maize Yield Cultivated with Small-Scale Landowners in Wolaita Zone, Ethiopia

Received: 27 May 2024     Accepted: 15 June 2024     Published: 8 July 2024
Views:       Downloads:
Abstract

Ethiopia is a country that heavily relies on rainfall-aided cultivation which is carried out by small-scale landowners, leaving it very vulnerable to climate change and fluctuation. The primary goal of this research is to investigate how climate change affects maize yield in Wolaita zone of Ethiopia. The authors were employed a linear regression method to evaluate the relationship between climate parameters and maize yield. Sen's slope magnitude estimator and the Mann-Kendal trend test were used to assess the significance of climate change. The outcome demonstrated that the temperature extreme indices of warm days and the length of warm days were considerably higher by 37.5% and 3.7% of days per year, however, cold days and cold spells were significantly decreased. Over the 1981-2021 periods, there was a significant upward pattern in TXx and TNn at an average of 0.033°C and 0.034°C. There was a considerable decline of 2.3% in the simple daily precipitation intensity index and 33% decreased in extremely heavy precipitation, respectively. The correlation analysis's findings indicated that growing period precipitation and maize outputs were positively correlated, but negatively correlated with maximum and minimum temperatures. Extreme temperature and precipitation were more explained a maize yield than average climate patterns. 12.4%, 14.76%, 13.08%, and 7.95% of maize output variability was attributed by the growing season mean climate conditions, which include precipitation, mean, minimum, and maximum temperature. The variability of maize output was explained by combined impact of precipitation and temperature extremes were 67.7% and 45.0%, respectively. Therefore, livelihood diversification and relevant policy formulation are suggested to adapt inevitable climate change by implementing irrigation and resistant varieties to improve maize yield production.

Published in International Journal of Energy and Environmental Science (Volume 9, Issue 2)
DOI 10.11648/j.ijees.20240902.11
Page(s) 20-37
Creative Commons

This is an Open Access article, distributed under the terms of the Creative Commons Attribution 4.0 International License (http://creativecommons.org/licenses/by/4.0/), which permits unrestricted use, distribution and reproduction in any medium or format, provided the original work is properly cited.

Copyright

Copyright © The Author(s), 2024. Published by Science Publishing Group

Keywords

Agriculture, Climate Change, Correlation, Maize Yield, Regression, Wolaita Zone

1. Introduction
Changes in radiative forcing caused the earth's climate to warm because of a rise in the amount of radiative active gases in the atmosphere . Because increasing tendency by radiative greenhouse gasses (GHG) within the atmosphere through the beginning of the industrial revolution, climate change has become among the utmost important worldwide issues . The most potentially radiative driving GHG is carbon dioxide (CO2). From 2003 to 2017, the average worldwide radiative forcing of CO2 was +1.89 watt per square meter (W m-2) relative to 1750, increasing by 18% every ten years . According to the Intergovernmental Panel on Climate Change assessment report six (IPCC, AR6), several changes in extremes are a direct result of increased radiative forcing both globally and, to some extent, regionally. Due to this, the water gripping capability of the air parcel increases, causing changes in vertical stability and meridional temperature gradients that influences on climate dynamics . The issue is especially serious small-scale cultivators, which depends significantly on seasonal circulation. Smallholder farmers in underdeveloped nations are particularly exposed to the influence of climate change .
Recent studies, on how agricultural productivity is associated with climate change showed that the worldwide agricultural productivity is now influenced by rising global temperature . Even though, several initiatives to minimize food insecurity, the fleshly consequences remain with protracted problem in developing countries . Changes in climate have a greater influence on the agricultural segment in African nations, where rainfall-aided farming is essential for everyday subsistence . Previous studies showed that agriculture is still under threat for various reasons, the most important is the inevitable and surprising climate shock . Precipitation and temperature are the two most significant climatic factors that influence crop growth, development, and productivity; changes and fluctuations in these factors can influence on agricultural yield productivity both directly and indirectly . Extreme precipitation poses a significant risk to smallholder farmers . Crop growing suffers from unpredictable precipitation . In rain-fed agriculture, excessive precipitation also causes soil nutrients to be lost through weathering, which has an impact on crop productivity . Study by other author indicated that reduced crop output due to extreme precipitation event could ultimately result in dietary scarcity, unemployment, displacement of population and migration . On the other hand, the result of extreme temperature is an alteration of plant morphological, anatomical, physiological, and biochemical that impact crop productivity, declining or total failing crop yield . Decreased temperature also obstructs growth and development by comprising imbalances in metabolism, interrupting/preventing procreative progress . Physiological damage in crop yield occur due to decreased temperature such as freezing and chilling, decreased temperature not only retard germination, emergence, and vegetative growth, but also affect morphogenesis .
Ethiopia and other African nations have significant socio-political challenges related to food security, which is also reliant on the prosperity of agriculture. The African Development Bank (ADB) reported that Ethiopia, with 115 million people as of 2021 population census, and an annual growth rate of 2.5 percent, is the second most populous nation in Africa next to Nigeria. Ethiopia's economy and way of life are still largely dependent on agriculture, because of this, the agricultural sector is highly exposed to climate change and shocks . According to the Central Statistical Agency (CSA) of Ethiopia, cereal crops cultivated across a country includes Teff, Maize, Wheat, Barley, Sorghum, Finer millet, Oats and Rice . Maize is cultivated throughout a country, and one of the important cereal food crops, together with Teff and wheat. Moreover, maize is broadly familiar as the key crop for guaranteeing food security in a country. In Ethiopia, Teff ranks the first in coverage then, maize is second but it is the first in terms of productivity contributing 95 percent of the national maize production .
Small-scale farmers' livelihoods are directly obstructed by precipitation and temperature extremes. Consequently, crop production is facing a serious threat . Hence, getting balanced diet is uncertain, because of the increasing demand and rapidly growing population. The typical productivity of maize in Ethiopia is 3 metrics tons per hectare which is small related to the global normal (5.6 metrics ton’s ha-1), because of declining of soil fertility, ineffective farming practice and climatic factors . Studies in different areas of Ethiopia indicated that temperature and precipitation inconsistency has negatively impacted maize production and productivity . Climate change is adversely affecting agricultural yields cultivated by smallholder farmers, where crop production is heavily relying on rain-fed agriculture. Nevertheless, little studies have been conducted on how the dynamics of climate factor may affect the crops that smallholder farmers growing . Therefore, producing meaningful and locally appropriate climate change evidence is critical precondition to make wise decision and improve cultivars .
The relationships among climatic factors and maize yield are analyzed using Pearson correlation coefficient, and the influence of climate extremes are evaluated by means of multi-variate linear regression method. Maize is the widely produced crop by smallholder farmers in Wolaita . This investigation is important to evaluate climatic factors influence on maize yield and to determine possible options for adjustment . But there are very limited local studies of the changing climate impact on yields of maize in Wolaita zone in particular and Ethiopia in general. Thus, this research was aimed to bridge this gap through evaluating the significance of climate change and its impact on corn yield grown in the southern Ethiopian, Wolaita, cultivated by peasant farmers. In this regards, the fundamental purpose of the study is to explore the effect of climate change on maize productivity in study area answering the subsequent investigation inquiries:
What is the influence of changes in climate extremes on rain-fed maize yield?
What are the relationships between climate extremes and maize yield?
The results of this study therefore support sustainable development goals (SDGs) of the United Nations (UN) which call for action for prosperity. The study contributes to guaranteeing the availability of sustenance and promoting viable agricultural progress by qualitatively analysing how the study area's corn productivity is affected by climate dynamic.
2. Methodology
2.1. Description of the Study Area
The study area is found in Southern Ethiopia, geographically, it is positioned within 6.40 to 7.10 N latitude and 37.40 to 38.20 E longitudes, respectively (Figure 1). The Wolaita zone covers the total land mass of 4,511 Km2. There are three agro-ecological zones inside the study area named as mid-latitude which covers about 56%, low altitude which covers about 35% and high altitude which covers 9% of the area .
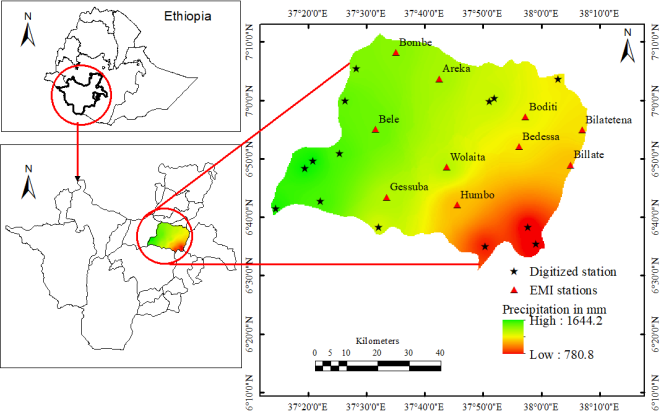
Figure 1. Study area map with annual precipitation distribution and location of meteorological stations. The asterisks indicate digitized stations and the red colored triangles indicate Ethiopian Meteorology Institute stations.
Altitude ranges between 810 and 1986 meters higher and average yearly precipitation is 780.8 mm to 1644.2 mm per year (Figure 1). The timing of precipitation is characterized as bi-modal, two wet and one dry season. The primary wet timing is from June to end of September, known locally as Kiremt while the second rainy time is from February through May which is referred as Belg . Regarding temperature, minimum temperature per year ranges 15.1°C to 25.1°C while the yearly maximum temperature ranges 17.1°C to 29.7°C, respectively .
In Wolaita zone, agriculture is the primary means of subsistence. Geographically speaking, the zone is divided into three main livelihood zones based on where people have similar access to food and marketplaces. Maize and root crop livelihood zone (Damot Gale and Damot Fulasa), ginger and coffee livelihood zone (Boloso Sore and Boloso Bombey), and barley and wheat livelihood zone (Sodo zuria), respectively . The CSA report showed that a range of crops are grown by peasants during the two rainy seasons. Among cereal crops, all peasants grow corn as their primary food crop, both for their own use and the market. While wheat and barley are the main crops farmed in the highland region, haricot beans are frequently inter-planted within maize fields in the midland for both personal use and profit. Teff is mostly derived for cash by many rural household . Root crops like Taro/Godere and Sweet potatoes play an important role in filling the gap in household food requirement particularly during the dry season .
2.2. Research Design and Data Sources
To ascertain the impact of climate change on maize yield, using a cross-sectional descriptive research design was utilized in this investigation. Regarding dataset, a daily time series of precipitation, maximum, minimum temperature dataset for 10 gauges are acquired since Ethiopian Meteorology Institute (EMI) on behalf of temporal coverage of 1981-2021 periods. The quantity of missing data gap was in the range of 1.9% to 96.1% (precipitation), 5.3% to 96.9% (maximum temperature, Tmax) and 6.3% to 97.1% (minimum temperature, Tmin), respectively (Table A1). Since the gauge dataset has missing, the study used global energy resource prediction made by the National Aeronautics and Space Administration (NASA) satellite based reanalysis product dataset to fill missing in observation. This dataset is an appropriate substitute used by many scholars over African countries and formed by NASA's Global Modeling and Assimilation Office (GMAO) by means of reanalysis models . The dataset is downloaded via https://power.larc.nasa.gov/data-access-viewer/ and obtained by entering the target location's latitude and longitude and transferred to a netCDF or CSV format. Regarding crop dataset, maize yields are obtained from CSA of Ethiopia, reported in quantal per hectare (qt ha-1) for the period 2003–2015. According to the research finding, maize yield data are relatively consistent . The yield data are presented at the national level, and also the Wolaita Zone zonal level, respectively.
2.3. Data Quality
2.3.1. Homogeneity Test
When all of the variations in a time series of dataset is accurately represented the variability and change of the climatic factor, the climate dataset is said to be homogenous . The Standard Normal Homogeneity Test (SNHT) method, created by Alexanderson (1986), is used to identify inhomogeneity in time series dataset . For a given dataset Yi and s, where Yi is the testing variable with Y is the mean and s is the standard deviation. An examination statistic T(y) contrasts the average of the first y years with the final y years (n-y) as shown in Eq. (1) & (2) below:
Ty=yZ¯1+n-yZ¯2, y=1, 2...n(1)
Where
Z¯1=1yi=1n(yi-y¯)s and Z¯2=1n-yi=y+1n(yi-y¯)s (2)
If T is at its maximum, the test statistic is provided by the following equation and is greater than the critical value, which is dependent upon the sample size and may be found using the formula in Eq. (3) below.
To=max1ynTy(3)
2.3.2. Adjustment of Inhomogeneity
The detected heterogeneity is corrected using the quantile mapping (QM) technique. Among heterogeneity correction methods, the most widely used correction methods are those based on quantile mapping (QM) approach . The approach is given using formula as Eq. (4) below:
xo=f(xm)(4)
Where, xo is adjusted time series xm is inhomogenoues time series, and f is transformation function. Given QM approaches use the quantile-quantile relation to converge the adjusted time series distribution function to the observed one, one should note that with the Cumulative Distribution Functions (CDFs) of both observed and adjusted variables time series, their quantile relation can also be determined, as shownusing Eq. (5) below .
xo=Fo-1[Fm(xm)](5)
Where Fm(xm) is CDF of xm, and Fo-1 is inverse form of the CDF of xo, which is technically referred to as the quantile function. The identified inhomogeinity and adjusted by quantile mapping is presented in Supplementary Figures 1 and 2, respectively. The result of homogeneity test and inhomogeneity adjusted time series are presented in (Figure A1, A2).
2.4. Methods of Data Analysis
2.4.1. Extreme Indices Calculation
Several indicators are proposed as a way to explain precipitation and temperature extremes, spanning from the strength of individual event indicators to combined events. This study employs 11 precipitation and 11 temperature explained and designated by the Expert Team on Climate Change Detection and Indices (ETCCDI), and listed in Table 1, are used to detect climate change over the study area. Many scholars are used such extreme indices in Ethiopia and other countries to detect climate change . The complete and detail information and how to compute the suggested indices are available at https://www.climdex.org/learn/indices/. The computation of extreme precipitation and temperature are conducted by means of climate data tool (CDT) which is part of R programming, the CDT R- bundle is openly available at https://github.com/rijaf-iri/CDT.
2.4.2. Trend Detection
The Mann-Kendal (MK) test is used to perceive statistically significant decreasing/increasing patterns in extended temporal dataset . MK trend test is predicated on two theories, one of which is null (Ho), other is the alternative (H1) hypotheses. The Ho indicates that there is no trend, whereas H1 clarifies whether there is a notable rising or falling tendency in temporal time series dataset. Depending on a five percent threshold significant, if the p-value is less than 0.05, the alternative hypotheses is acknowledged, indicating the existence of an inclination in a dataset, additionally, if the p-value is higher than 0.05, null hypotheses would be recognized as indicating that there is no trend in a dataset. The computational steps for trend are provided by the following Eq. (6).
S=i=1n-1j=i+1nsin(Tj-Ti)(6)
Where Tj and Ti were monthly, seasonal and year values, j and i years that j>i, and there are n quantity of data points. Assuming (Tj-Ti)=, the value of sign (θ) computed as follows using Eq. (7):
sinTj-Ti =1 if Tj-Ti>00 if Tj-Ti=0-1 if Tj-Ti<0(7)
A rising trend in the dataset is shown by a positive value of S, whereas a falling trend is indicated by a negative value. The magnitude of extreme event is evaluated by a simple non-parametric procedure using Sen's inclination estimation developed by and estimated by means of Eq. (8) as follows :
Qi=xj-xij-1(8)
Where i = 1 to n-1, j = 2 to, xj and xi are data values at time j and i where (j > i), respectively. If there are n values of xj in the time series, Sen’s slope estimator will be N=n(n-2)/2. The Sen’s slope estimator is the mean slope of N values, then, the Sen’s slope is estimated using Eq. (9):
Qij= xj-xij-1 if n is odd12QN 2+QN+22 if n is even(9)
The positive value of Qij indicates an increasing trend, while the negative value of Qij shows decreasing trend, where the units of Sen’s slope (Qij) is the slope per year in temporal dataset.
2.4.3. De-trending of Crop Yield
Beyond climate, a number of factors affect crop over time, including farming style/practice and improved yield varieties, which frequently cause the yield to go upward. To isolate the variation brought through climate, the effect of these non-climatic components must be de-trended/eliminated by means of simple linear regression model. Many researchers are employing a linear regression model to eliminate/de-trend crop yield and used the resulting residuals to ascertain impact of climate variables regarding agricultural yield . The linear regression model is given as follows using Eq. (10):
Yt=α+β*Xt (10)
Where Yt represents a residual at time t, α stands for constant which is known as intercept, β is a regression coefficient obtained from the climate variables which stands for the line's gradient and is also known as the slope. Xt is an independent variable. A positive coefficient of β denotes a regression line with an upward slope when the value of β is negative, indicating a line with a downward slope. Residuals of yields (Yt) represent the effect of climatic factor .
2.4.4. Climate-Crop Yield Correlation Analysis
The linear link among two variables is measured by the Pearson correlation which is employed to assess the correlation among climatic factors, then crop yields. As stated by scholar, the correlation coefficient r ranges from minus 1 to plus 1, entire independency of the variables are represented by 0, while complete dependency among 2 variables are written as -1 or +1, respectively . When the value of r is 0.1, it is taken as small, 0.3 is taken as medium and 0.5 is taken as large . The Pearson correlation coefficient r is computed using Eq. (11) as:
r=i=1n(x-x¯)(y-y)i=1n(x-x̅)2 *i=1n(y-M̅y(11)
Whereby ·x is the average of the explanatory variables, r is the correlation coefficient, and x is the independent variables variable, whereas y is dependent variables and y¯ is average of reliant variable, respectively. Multivariate linear regression is implemented to analysis the association between climatic extremes and crop yield. Similar studies implemented multiple linear regressions to quantify the difference among the response and predictor variables that may be accounted through a multiple linear regression formula . The dependent variable y is linearly connected to the explanatory variables x,X1,X2, … Xk via the specificationsβ1, β2, …βk, subsequently the multiple linear regression equation is written as:
y= X1β1+ X2β1++ Xkβk+ ε(12)
The parametersβ1, β2, …, βk are the coefficients of regression connected to X1, X1, …, Xk correspondingly, and ε is reflected in the random error component as the variation between the fitted linear relationship and the observation. The regression component of βk is computed according to as using Eq. (13):
βs= βμδxδy(13)
Where βs is the standardized coefficient, βμ is the unstandardized coefficient estimate, δx is the standard deviation of the particular explanatory variable and δy is the standard deviation of response variable, respectively. The effectiveness of the developed model is measured by standard metrics of statistical inaccuracy such as mean absolute percentage error (MAPE), root mean square error (RMSE), and coefficient of determination (R2). The mathematical expressions of these measures are defined using Eq. (14):
R2= (yt̂ - y̅)2(yt- y¯)2(14)
0 ≤ R2 ≤ 1, where yt, yt̂ and y¯ denotes for observed values, forecasted values and mean of observed values. The adjusted coefficient of determination R̅2 is computed using Eq. (15):
R2¯=1-1-R2T-1T-K-1, 0 ≤R2¯≤ 1(15)
T is the number of observations in this case and k is the quantity of predictors. The RMSE is denoted by means of Eq. (16):
RMSE= 1n(yt- ŷt)2n(16)
where n is the quantity of observations.
The mean absolute percentage error can be defined as:
MAPE= 1nyt-yt̂yt(17)
Maize yield is taken as dependent variables whereas climate extremes presented in Table 1 are regarded as explanatory variables. To detect climate change, the time series of climate extremes is analyzed on annual basis while climate's extremes influence on crop yield is on seasonal scale of growing period (Kiremt) of maize. Climate and agricultural yield dataset are similarly investigated by means of regression and correlation analysis to found relationship between climate extremes and crop yield.
Table 1. Presents climate indicators produced from the daily precipitation and temperature value with definition. In this study, PRCP depicts the daily precipitation when PRCP ≥ 0.1 mm is considered as wet day whereas PRCP < 0.1 is considered to be dry day.

Index

Descriptive name

Clarification

Unit

TXx

Max Tmax

Maximum value of daily maximum for a monthly temperature in the growing season

°C

TNx

Max Tmin

Maximum monthly value of the daily minimum temperature in the growing season

°C

TXn

Min Tmax

Monthly minimum value of daily maximum temperature in the growing season

°C

TNn

Min Tmin

Monthly minimum value of daily minimum temperature in the growing season

°C

DTR

Diurnal temperature range Duration

Monthly mean difference between TX and TN in the growing season

°C

WSDI

Warm spell duration indicator

Annual count of days with at least 6 consecutive days when TX > 90th percentile in the growing season

Days

CSDI

Cold spell duration indicator Frequency

Annual count of days with at least 6 consecutive days when TN < 10th percentile in the growing season

Days

TN10p

Cool nights

Percentage of days when TN < 10th percentile in the growing season

Days

TX10p

Cool days

Percentage of days when TX < 10th percentile in the growing season

Days

TN90p

Warm nights

Percentage of days when TN > 90th percentile in the growing season

Days

TX90p

Warm days

Percentage of days when TX > 90th percentile in the growing season

Days

Precipitation extremes

Rx1day

Max 1-day precipitation

Maximum 1-day precipitation total in the growing season

mm

Rx5day

Max 5-day precipitation

Maximum 5-day precipitation total in the growing season

mm

R95p

Total annual precipitation from heavy rain days

Annual sum of daily precipitation > 95th percentile in the growing season

mm

R99p

Total annual precipitation from very heavy rain days

Annual sum of daily precipitation > 99th percentile in the growing season

mm

R95pTOT

Contribution from very wet days

100*R95p/PRCPTOT in the growing season

%

R99pTOT

Contribution from extremely wet days

100*R99p/PRCPTOT in the growing season

%

PRCPTOT

Annual total wet day precipitation

Sum of daily precipitation > 1.0 mm in the growing season

mm

R10 mm

Number of heavy rain days

Number of days when precipitation > 10 mm in the growing season

day

R20 mm

Number of very heavy rain days

Number of days when precipitation > 20 mm in the growing season

day

CDD

Consecutive dry days

Maximum number of consecutive dry days (when precipitation < 1.0 mm) in the growing season

days

CWD

Consecutive wet days

Maximum number of consecutive wet days (when precipitation > 1.0 mm) in the growing season

days

SDII

Simple index for the intensity of precipitation

Total annual precipitation divided by number of days with PRCP ≥ 1 in the growing season

Mm/days

3. Results
3.1. Temperature Extremes
Sen's slope for each index of temperature extremes and the MK statistical test for ten weather stations and areal average (10 gauge) and (14 digitized locations) are presented in Table 2. The analysis of TXx indicates upward pattern for entire sites studied at 5% significant scale. The value of TXx significantly increasing at Areka, Bedesa, Bilatetena, Bilate, Boditi School, Bombe and Gesuba stations. However, in contrast, patterns of the TXx is increasing by the side of Bele, Wolaita Sodo, Humbotebela and Gesuba stations but statistically not significant. The increasing trend of TXn prevailed at Wolaita Sodo, Bilate, Bele and Bedesa stations but statistically not significant while significantly increasing trend at Humbotebela and Bilatetena stations respectively (Table 2). A Warm extreme index (TX90p) is significantly rising nearly at entire weather stations, except Bele and Bedesa stations where it is decreasing but statistically not significant. Similarly, TN90p is increasing trend at many stations except Bele, Gesuba and Humbotebela stations which show decreasing trend but statistically not significant (Table 2). The length of the Warm Period indicators (WSDI) show upward pattern nearly entire meteorological locations. While CSDI prevailed decreasing trend closely at every sites, with the exception Areka and Bombe sites were showed an upward pattern (Table 2). The diurnal temperature range indicating increasing trend at Areka, Bele, Bombe, Gesuba, Humbotebela and Wolaitasodo stations while it is decreasing at Bedesa, Bilatetena, Bilate and Boditi stations (Table 2).
Table 2. The Modified Sen's Slope (S) and MK (Z) trend test statistics for temperature extreme differences 1981-2021 period. The bolded numbers with asterisks indicate gauges that has significantly increasing/decreasing trend at 5% significant level. Most temperature extremes show that temperature is significantly rising over the study area due to climate change.

Station

CSDI

DTR

TN10p

TN90p

TNn

TNx

TX10p

TX90p

TXn

TXx

WSDI

Areal

Z

-0.332*

0.002

-0.106

0.104

0.132

0.199

-0.34*

0.317*

0.127

0.243*

0.356*

S

0.001

0.0001

0.002

0.046

0.033

0.029

0.043

0.375

0.242

0.033

0.037

Areka

Z

0.10

0.09

0.18

0.29

-0.16

0.16

-0.10

0.40

-0.1

0.53*

0.32

S

0.000

0.02

0.026

0.259

-0.05

0.03

-0.08

0.269

-0.1

0.1

0.00

Bedesa

Z

-0.30

-0.16

-0.34

0.63

0.33

0.52

-0.58

0.50

0.02

0.60*

0.29

S

0.00

-0.02

-0.02

0.44

0.06

0.10

-0.3

0.417

0.00

0.12

0.00

Bele

Z

-0.30*

0.13

0.02

-0.07

0.00

-0.02

-0.40*

0.19

0.11

0.20

0.25*

S

0.000

0.03

0.000

-0.051

0.00

0.00

-0.40

0.114

0.03

0.03

0.00

Bilate tena

Z

-0.22

-0.11

-0.38*

0.45*

0.36*

0.46*

-0.56*

0.41*

0.29*

0.58*

0.39*

S

0.000

-0.01

-0.03

0.353

0.07

0.1

-0.46

0.324

0.07

0.1

0.00

Billate

Z

-0.36*

-0.23*

-0.41*

0.50*

0.38*

0.36*

-0.44*

0.43*

0.17

0.42*

0.26*

S

0.000

-0.03

-0.03

0.285

0.07

0.09

-0.33

0.345

0.03

0.07

0.00

Boditi School

Z

-0.30*

-0.21

-0.30*

0.60*

0.24*

0.57*

-0.51*

0.48*

-0.1

0.58*

0.22

S

0.000

-0.03

0.000

0.413

0.05

0.1

-0.23

0.353

-0.0

0.12

0.00

Bombe

Z

0.36*

0.37*

0.35*

0.05

-0.28*

0.01

-0.08

0.28*

-0.4*

0.42*

0.42*

S

0.000

0.074

0.38

0.034

-0.12

0.00

-0.08

0.247

-0.1

0.08

0.00

Gessub

Z

-0.17

0.08

-0.10

-0.23*

0.06

-0.01

-0.21

0.18

-0.0

0.14

0.29*

S

0.000

0.016

-0.04

-0.2

0.02

0.00

-0.17

0.133

0.00

0.03

0.00

Humbo tebela

Z

-0.23

0.16

0.03

-0.07

-0.04

-0.11

-0.46*

0.34*

0.32*

0.22

0.24

S

0.000

0.029

0.000

-0.05

-0.01

-0.02

-0.44

0.27

0.1

0.04

0.00

Wolaita sodo

Z

-0.34*

0.02

-0.06

0.09

0.99*

0.19

-0.39*

0.32*

0.18

0.22

0.34*

S

0.000

0.004

0.000

0.05

0.999

0.03

-0.40

0.245

0.05

0.03

0.00

Note: positive (+) values indicated an increasing trend while negative (-) show decreasing trend.
The TNn index, which is the daily minimum temperature of the year showed increasing nearly at 70% of meteorological stations. similarly, TNx index of the warmest night showed increasing trend at 60% of weather stations, significantly increasing at Bilatetena, Bilate, Boditi and wolaita sodo stations. Cold days (TX10p) decreasing nearly at all stations and cold nights (TN10p) are decreasing at 60% stations (Table 2).
3.2. Precipitation Extremes
Table 3 indicates statistical tests for Sen's slope and Mann-Kendall for ten meteorological stations, and areal average from fourteen digitized location and ten gauge sites. In the study area, an investigation of cumulative annual precipitations (PRCPTOT) indicated increasing trend nearly at all locations, excluding the Bilatete tena and Humbo tebela stations, which indicated decreasing trend. However, the increasing/decreasing of PRCPTOT was statistically not significant nearly at all sites including areal average, except Bele station which indicating significantly increasing trend (Table 3). SDII showed significantly downward at all weather stations. The number of days per year with daily precipitation was > 10 mm and >20 mm is significantly decreasing at 50% and 70% of meteorological stations. The annual total precipitation when daily precipitation on wet days was significantly decreasing at 80% of meteorological stations. Whereas, the decreasing of annual total precipitation of very wet day (R95pTOT) was higher at Bedesa, Bilate, Bilate tena, Gesuba, Boditi, Areka, Wolaita sodo and Humbo stations where 4.4, 4.0, 3.8, 3.5, 3.5, 3.5, 3.2 and 3.1 mm year-1. The annual total precipitation of extremely wet days (R99pTOT) was decreasing at nearly all stations but not significant except Humbo station, where it was significantly decreasing through Sen's incline magnitude of 1.23 mm year-1 (Table 3).
Table 3. Modified Sen's Slope (S) and MK (Z) trend test statistics for precipitation extreme differences 1981-2021 periods. The bolded numbers indicate gauge sites that have significantly increasing at a significant scale of 5%.

indices

Areal

Areka

Bedessa

Bele

Bilatetena

Billate

Boditi

Bombe

Gessuba

Humbo

Wolaita

PRCPTOT

Z

0.09

0.079

0.049

0.074*

-0.005

0.054

0.082

0.131

0.024

-0.041

0.110

S

1.775

1.69

1.145

1.966

-0.056

0.671

1.307

2.979

0.673

-0.514

2.032

R10mm

Z

-0.09

-0.07

-0.258*

-0.04

-0.346*

-0.3*

-0.3*

-0.041

-0.118

-0.25*

-0.145

S

-0.10

-0.07

-0.271

-0.06

-0.357

-0.32

-0.36

-0.032

-0.143

-0.265

-0.2

R20mm

Z

-0.2*

-0.3*

-0.31*

-0.16

-0.29*

-0.3*

-0.3*

-0.161

-0.25*

-0.31*

-0.26*

S

-0.07

-0.13

-0.105

-0.111

-0.097

-0.09

-0.11

-0.059

-0.111

-0.077

-0.114

R95pTOT

Z

-0.15

-0.3*

-0.39*

-0.14

-0.49*

-0.3*

-0.3*

-0.117

-0.22*

-0.34*

-0.25*

S

-2.10

-3.50

-4.443

-2.81

-3.79

-3.99

-3.50

-1.656

-3.525

-3.115

-3.247

R99pTOT

Z

-0.07

-0.12

-0.144

-0.07

-0.207

-0.21

-0.15

-0.081

0.006

-0.22*

-0.108

S

-0.33

-0.46

-0.765

-0.681

-1.208

-1.04

-0.59

-0.103

0.000

-1.231

-0.664

Rnnmm

Z

-0.04

-0.20

-0.188

-0.17

-0.24*

-0.13

-0.19

-0.180

-0.176

-0.216

-0.200

S

-0.01

-0.05

-0.765

-0.059

-0.038

0.000

-0.03

-0.043

-0.035

0.000

-0.059

Rx1day

Z

0.03

-0.12

-0.019

0.085

-0.095

-0.09

-0.03

0.003

0.053

-0.172

-0.054

S

0.031

-0.15

-0.028

0.108

-0.087

-0.07

-0.03

0.002

0.058

-0.169

-0.074

Rx5day

Z

0.04

0.033

0.021

0.027

-0.085

-0.05

-0.03

0.128

0.022

0.068

0.067

S

0.054

0.085

0.049

0.027

-0.151

-0.14

-0.06

0.235

0.048

0.102

0.14

SDII

Z

-0.3*

-0.3*

-0.32*

-0.26*

-0.30*

-0.2*

-0.3*

-0.28*

-0.33*

-0.54*

-0.32*

S

-0.02

-0.04

-0.038

-0.028

-0.042

-0.04

-0.03

-0.027

-0.032

-0.083

-0.036

CWD

Z

0.24*

0.32*

0.32*

0.23*

0.34*

0.34*

0.34*

0.23*

0.23*

0.32*

0.28*

S

0.286

0.559

0.551

0.271

0.569

0.617

0.544

0.313

0.25

0.571

0.519

CDD

Z

-0.3*

-0.4*

-0.44*

-0.32*

-0.42*

-0.4*

-0.4*

-0.36*

-0.32*

-0.46*

-0.45*

S

-0.47

-0.74

-0.714

-0.4

-0.737

-0.7

-0.73

-0.5

-0.333

-0.667

-0.75

* Significant at 5% threshold, positive (+) or negatives (-) values indicate upward/downward pattern.
The modified Mann-Kendal test for the quantity of following days that have been dry (CDD) indicated significantly decreasing at all weather stations, but the quantity of days that have consecutively been rainy (CWD) for the study area showed significantly increasing at all locations. On the other hand, the trend in the maximum precipitation for one day in the year (RX1day) and five days in the year (RX5day) showed insignificant upward/decreasing pattern during the study period of 1981-2021 (Table 3).
3.3. Trend of Growing Period Climatic Variables and Crop Yield
3.3.1. Climate Variability
Table 4 presents descriptive statistics of climatic factors that affect the growth season of maize yields. There was a variation of 15.04% in maize growing season precipitation and 12.0% in the variation of yearly precipitation, respectively. The growing season precipitation was in the range of 429.3 mm to 795.9 mm for growing period while the yearly precipitation was in the range of 1104.7 mm to 1682.8 mm, respectively. The variability of temperature showed that 6.7%, 3.51% and 3.88% variation in maximum, minimum and mean temperature, respectively (Table 4).
Figure 2 demonstrates the pattern of Maize cultivation period (June-September) precipitation, and temperature pattern. The growing period precipitation showed a positive slope value of 10.08 mm year-1 indicating a rising pattern, and R-squared quantity is accounted a 17.47% of the fluctuation in the growing season precipitation (Figure 2a). The pattern of growing season minimum was increased by +0.013°C with R-squared value of 1.42% (Figure 2b). While maximum and mean temperature showed decreasing trend, and have an inclination quantity of -0.4530 and -0.015°C, correspondingly. The R-squared values as the model's explanation showed that 5.98% and 1.6% of the fluctuation in farming season mean and maximum temperature (Figure 2c-d).
Table 4. Summary statistics of precipitation and temperature during Kiremt crop growing season.

Variables

Minimum

Maximum

Average

St. deviation

CV (%)

Tmax (in °C)

22.9

27.55

25.5

1.7

6.7

Tmin (in °C)

11.9

14.4

13.1

0.46

3.51

Mean (in °C)

18.3

21.2

19.3

0.75

3.88

PRCP (in mm)

429.3

770.2

593.4

89.28

15.04

Annual Tmin (in °C)

9.1

11.3

9.8

0.5

5.4

Annual Tmax (in °C)

18.7

20.5

19.8

0.5

2.3

Annual PRCP (in mm)

1104.7

1682.8

1319.1

158.2

12.0

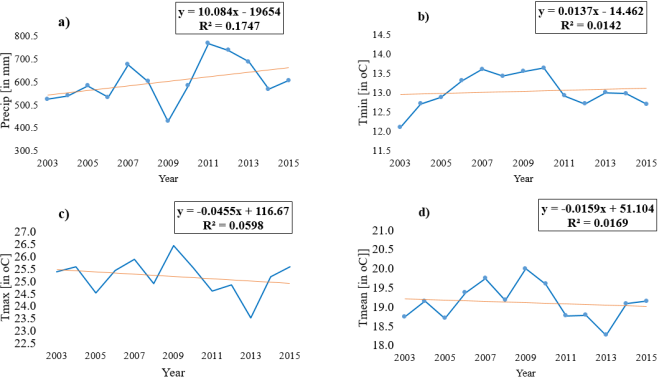
Figure 2. Trend of Maize growing period (a) precipitation in mm, (b) Tmin in °C, (c) Tmax in °C and (d) mean temperature in °C, respectively.
3.3.2. Trend of Maize Yields
According to Table 5, there was a significant upward trend was detected at 5% significant level, because the calculated p-value was less than 0.05. Additionally, the amount of maize yield was increased by 1.123 qt ha-1 annually, as demonstrated by Sen's slope magnitude estimator (Table 5).
Table 5. Maize yield trend by means of MK trend test and Sen’s slope magnitude estimator.

Yields

Kendal’s taw

p-value

Sen’s slope

alpha

Level of significant

Maize

0.538

0.010

1.123

0.05

Significant

Figure 3 shows a pattern of rising maize yield, where the linear regression formula showed a positive slope values of 0.97, and R-squared value indicated a 62.31% qt ha-1 of the fluctuations in the yield of corn (Figure 3).
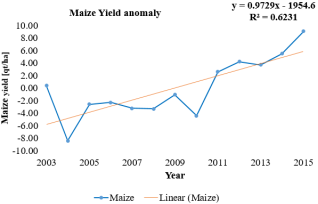
Figure 3. Trend of Maize yield anomaly for 2003-2015 period.
3.4. Regression and Correlation of Climate with Crop Yield
Figure 4 demonstrates the results of linear regression model between maize and growing season precipitation and temperature. The association among corn and development stage precipitation showed positive relationship and unfavourable relationship between development stage and minimum, maximum and mean temperature. The correlation coefficient among development stage precipitation, minimum, maximum and mean temperature were +0.352, -0.361, -0.282 and -0.384, respectively. The R-squared statistics values showed 12.4%, 13.08%, 7.95% and 14.76% qt ha-1 of land, were explained by growing season precipitation, minimum, maximum and mean temperature, respectively (Figure 4).
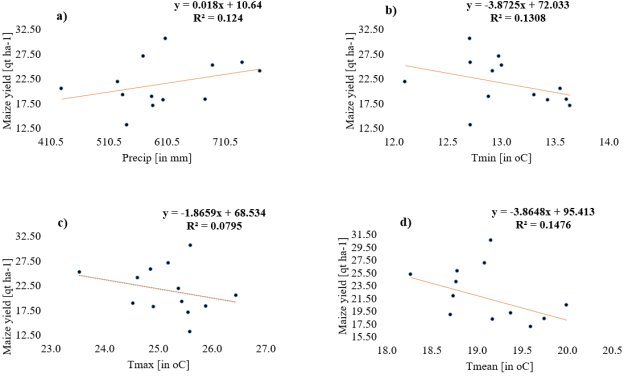
Figure 4. Relationship between Maize Yield and (a) precipitation in mm, (b) Tmin in °C, (c) Tmax in °C and (d) mean temperature in °C, respectively during 2003-2015 periods. Vertical axis represents maize yield (qt ha-1) of land and horizontal axis represents climatic variables, respectively.
The multi-variate linear regression analysis between maize yield and growing season precipitation and temperature extreme indices were presented in Table 6. The findings of the correlation between maize yield and precipitation extremes of SDII, R95pTOT and CDD were negatively correlated with a correlation coefficient of -0.762, -0.607, -0.343, correspondingly. The relationship among maize yield and CWD was positively correlated with a correlation coefficient of +0.504. The correlation coefficients between maize yield and temperature extremes of CSDI, DTR, TN10p and TXx were positively correlated and ranged from+0.177 to +0.323, respectively. The combined effect of precipitation extreme was greater than the combined effect of temperature extremes, 67.7% and 45.0% of maize yield was accounted via the collective impact of precipitation extremes and temperature extremes, respectively (Table 6).
Table 6. Results from the multi-variate regression analysis between maize yield and growing season precipitation and temperature extreme indices.

Parameters

r

MSE

RMSE

MAPE

CDD

-0.343

0.117

22.184

4.710

17.386

CWD

+0.504

0.254

18.755

4.331

14.755

R95pTOT

-0.607

0.369

15.859

3.982

14.067

SDII

-0.762

0.580

10.551

3.248

12.001

Combined effect of precipitation extremes

0.677

3.343

9.451

11.172

Warm spell duration indicator (CSDI)

+0.233

0.054

23.771

4.876

94.214

DTR

+0.201

0.041

24.113

4.910

117.542

Cold nights (TN10p)

+0.177

0.031

24.346

4.934

116.097

Max Tmax (TXx)

+0.323

0.104

22.514

4.745

89.545

Combined effect of temperature extremes

0.450

0.04

0.19

52.30

4. Discussion
Continuous warming of climate condition is triggering numerous extreme weather events, exerting significant impact on agricultural crop production. According to IPCC report, the period from 1981 to 2012 is the warmest 30-year period in the Northern Hemisphere and the global average surface temperature determined by means of a linear pattern showed a warming of 0.65 to 1.06°C . Expectations suggesting a possible increase of 1.1 to 5.8°C at the termination of 21th era, as a result, climate change is showing alterations to precipitation patterns and a rise in the occurrence of severe events . Ethiopia has frequently experienced climatic extremes and variability with rise in mean yearly temperature of around 1.3°C meanwhile 1960, with a consistent rate of 0.28°C every ten years . Computed minimum and maximum temperature averaged over central and northeastern Ethiopia indicated significantly increasing trend. Minimum temperature increased by 0.12 °C over northeast and 0.41°C over central Ethiopia . The same source indicated that the observed temperature in northwest and western part of southern Ethiopia has increased by 0.44°C every ten years. Average amount of hot night year-1 increased by 37.5% during 1960-2003 period, and the amount of hot days per year was elevated by 20%, whereas the number of cold days declined . The same author has additionally observed that the rate of temperature rise has been faster in the main crop growing season of June-September period. Average annual highest and lowest temperatures have risen by 0.047°C and 0.014°C per year, extreme temperature indices of warm temperature increased and cold temperature indices showed decreased trend, respectively .
The investigated precipitation trend showed that the observed mean precipitation is not statistically significant trend between 1960 and 2006 . Moreover, the patterns of precipitation in space and time is inconsistence and highly variable . However, the average precipitation indicated that a downward trajectory on the annual period for the entire of the country . Other scholars noted that the increasing/decreasing of precipitation depended on the rainy season. The quantified amount of precipitation in the June to September season indicated decreasing trend while the October to January season showed increasing trend, respectively .
The finding of this study showed that TX90p, TN90p, WSDI, TNn and TXx are increasing trend. while, TXx was significantly increased at Areka, Bedesa, Bilatetena, Bilate, Boditi and Bombe stations in the range of 0.42 to 0.60°C in 1981-2021 period. Similarly, TNn was significantly increased at Bilate tena, Bilate, Boditi and Wolaita stations in the range of 0.24 to 0.91°C in 1981-2021 periods, respectively (Table 2). Cold extremes such as TN10p, TX10p and CSDI demonstrated a downward trend. Precipitation indices showed downward pattern over the study area, particularly SDII and R20mm were significantly decreasing during 1981-2021. The result of this investigation agreed with earlier research that showed upwaed pattern in temperature extremes in Ethiopia, and over the study area. Moreover, a rising tendency in warm temperature extremes and a falling trend in cold temperature extremes, signifying a country's general warming and dryness . The average yearly maxima and minimum temperatures increasing, cold temperature indices decreasing while warm temperature indices showed increasing trend . Other scholar has also indicated that rising trend in the temperature extremes while declining precipitation extremes over Wolaita zone . Statistically notable upward pattern in temperature extremes of hot days and hot nights were quantified . In contrast to this finding, notable declining pattern of warm days and warm ninths while upward pattern in CDD at Wolaita Sodo station . The different result at the same weather station may be linked to the data-related concern and missing data and the existence of inhomogeneity in observed time series. Inhomogeneity of the data seriously impact climate research quality, especially in the areas of climatic pattern, inconsistency and extreme events . Moreover, the World Meteorological Organization (WMO) guidance recommends that the climatological normal of extreme temperature and precipitation should be calculated at a 30-year regular period, updating each ten years, and the latest base dated is 1991-2020 . As a result of this investigation, the temperature and precipitation extreme has been computed for 1981-2021 period and compared at a rolling of 30-year, 1991-2020 reference period.
Among the principal environmental factors that essential to the production of agriculture is optimum climatic variables during the growth and development period. Previous study showed the threshold of lowest and highest temperatures during the stages of development and growth were from 25.0°C to 33.0°C during day time, and from 17 to 23°C during night time, with the average ideal range of 20.0 to 22.0°C for the whole growing season . Moreover, the best optimum temperature for maize crop growth and development was at 25.0 to 28.0°C . According to the report, the maize yield requires 423 mm of water for maturity during growing season . The maize growing season minimum and maximum temperature of Wolaita zone at day time is from 22.9°C to 27.6°C and at night time is from 11.9 to 14.8°C, respectively. The growing season precipitation amount is in the range of 429.3 mm to 770.2 mm having an average quantity of 593.4 mm, respectively. Likewise, annual range of the maximum and minimum temperatures is 18.7°C to 20.5°C and from 9.1°C and 11.3°C, respectively. The coefficient of variation (CV) is employed to categorize the level of variability of variables, and divided into three categories: high (CV >30%), moderate (20%<CV <30%), and low (CV<20%), respectively . Across the research domain, the variability of growing season maximum temperature, minimum temperature and precipitation was 6.7%, 3.51% and 15.04% (Table 4), respectively. This is suitable for maize growth and development over the research domain. Consequently, the production of maize yield is increased at the rate of 1.123 qt ha-1 of land year-1 (Table 5). However, the growing season climate showed year to year fluctuation, precipitation and minimum temperature showed increasing tendency, while maximum and mean temperature were indicated decreasing trend (Figure 3).
According to the analysed result of correlation coefficients, there was a positive correlation between precipitation and corn, while the temperature at the minimum and highest has a negative correlation against maize yield during growing period. Therefore, precipitation was positively impacted, while minimum and maximum temperature was negatively influenced maize growth and development. Similar study conducted in Ethiopia found that growing period precipitation displayed a positive correlation while maximum temperature was adversely correlated with maize yield . Other author quantified that the rising of climatic factors were positively affected the maize yield . The explained variances (R2) quantified in this study was similar magnitude as previously reported studies . Furthermore, the determined R2 values for precipitation (25.21%), minimum temperature (1.12%), and maximum temperature (20.39%) of the variability in maize .
Climate change and anomalies are a contemporary day threats upon agrarian, dietary needs, and livelihoods for millions of people worldwide, particularly in developing nations . Negative impact of climatic factors on grain productivity can transform to dietary insecurity, worse living standards, abridged wellbeing and resulting in to famine . Climate change is expected to have a detrimental influence on cereal crop yields in many places, with maize yields decreasing via up to 60% . The multiple linear regression analysis revealed that maize yield was substantially sensitive toward extreme climate events than mean climate condition. R-squared value of maize yield attributed by extreme precipitation and extreme temperature event were 67.7% and 45.0% respectively (Table 6). sIn terms of the impact on maize crops, deficit of precipitation was associated with periods of drought and maize harvest continually decreases owing to water scarcity . On the other way, excessive precipitation can have siginificant negative impact on maize yield . The increasing of temperature extremes enhance evaporation and tranpiration resulting in drought, which inturn subsequent in water deficity and declining of agricultural production .
5. Conclusion
Extreme precipitation and temperature were investigated using observed daily climate time series over the period 1981-2021. Climate change trend of extreme precipitation and extreme temperature were tested by means of the MK trend, and Sen’s slope magnitude estimator. The association between rain-fed maize yield and climate variables were computed using correlation and multi-variate regression approach. Temperature and precipitation extreme evaluation demonstrated a considerable temperature increase and erratic decreasing trend in precipitation. For maize harvests, MK examination showed that there was a substantial growing tendency at 5% significant. In the maize growing period, there was an increasing pattern in precipitation and minimum temperature, whereas a negative trend in maximum and mean temperatures. The predictive power of climate change indicators of extreme precipitation and extreme temperature was higher than mean climate conditions. The growing season climate conditions covering precipitation, minimum, maximum and mean temperature were explained 12.4%, 13.08%, 7.95% and 14.76% of maize yield variation. While, 67.7% and 45% of maize yield variation was explained by growing season extreme precipitation and extreme temperature. Based on our study findings, the ongoing global warming coupled with local climate change by increasing temperature and decreasing precipitation, significantly impact natural rainfall cultivation in the Wolaita. In addition, detected trend results provide insights to research on the development of maize varieties that resists specific climate extremes at the local level. As recommendations, the authors suggest that investigation of a broader set of climate extremes not only for maize but also for various crops for sustainable food security needs attention by concerned bodies.
Abbreviations

AfDB

African Development Bank

CDF

Cumulative Distribution Function

CDT

Climate Data Toll

CO2

Carbon Dioxide

CSA

Central Statistical Agency

CSV

Comma-Separated Value

EMI

Ethiopian Meteorology Institute

ETCCDI

Expert Team on Climate Change Detection Indices

GHG

Green House Gas

GMAO

Global Modelling and Assimilation Office

IPCC, AR6

Intergovernmental Panel and Climate Change Assessment Report Six

MAPE

Mean Absolute Percentage Error

MK

Mann Kendal

NASA

National Aeronautics and Space Administration

netCDF

Network Common Data Form

QM

Quantile Matching

RMSE

Root Mean Square Error

SDGs

Sustainable Development Goals

SNHT

Standard Normal Homogeneity Test

UN

United Nation

WMO

World Meteorological Organization

Acknowledgments
The authors would like to thank the Ethiopian Meteorology Society and its staff financial supporting for data collection. The authors also would like to thank the Ethiopian Meteorology Institute for freely providing climate data.
Author Contributions
Tadele Badebo Badacho: Conceptualization, Data curation, Formal Analysis, Investigation, Methodology, Project administration, Resources, Software, Supervision, Validation, Visualization, Writing – original draft, Writing – review & editing
Tesfaye Dessu Geleta: Conceptualization, Data curation, Formal Analysis, Investigation, Methodology, Project administration, Resources, Software, Supervision, Validation, Visualization, Writing – original draft, Writing – review & editing
Mehuba Demissie Lema: Data curation, Formal Analysis, Methodology, Software, Supervision, Validation, Visualization
Sintayehu Abera Wondimu: Data curation, Formal Analysis, Methodology, Software, Supervision, Validation, Visualization
Birtukan Tadesse Wahima: Data curation, Formal Analysis, Methodology, Software, Supervision, Validation, Visualization
Funding
This research received no external funding.
Data Availability Statement
The relevant data used for this research is found in the article and supplementary materials. Further information’s can be obtained based on reasonable request of the corresponding author.
Conflicts of Interest
The authors declare no conflicts of interest.
Appendix
Table A1. Station names, location (latitude and longitude in degree and elevation in meter) and percentage of missing data at each station during the period of 1981 to 2021. The asterisks show stations that are recording only precipitation. Station names, location (latitude and longitude in degree and elevation in meter) and percentage of missing data at each station during the period of 1981 to 2021. The asterisks show stations that are recording only precipitation. Station names, location (latitude and longitude in degree and elevation in meter) and percentage of missing data at each station during the period of 1981 to 2021. The asterisks show stations that are recording only precipitation.

Stations name

Lat

Lon

elv

Precip (in %)

Tmax (in %)

Tmin (in %)

1

Areka

7.063

37.708

1758

36.2

**

**

2

Bedessa

6.869

37.936

1578

4.7

20.4

23.2

3

Bele

6.918

37.526

1246

27

**

**

4

Bilate tena

6.917

38.117

1499

17.5

**

**

5

Billate

6.817

38.083

891

5.3

15.2

17.2

6

Boditi

6.954

37.955

1789

5.2

5.3

6.3

7

Bombe

7.138

37.584

1540

96.1

96.9

97.1

8

Gessuba

6.724

37.558

1526

21.6

45.6

45.6

9

Humbo tebela

6.702

37.759

1643

19.5

**

**

10

Wolaita sodo

6.81

37.73

1808

1.9

7.3

8.8

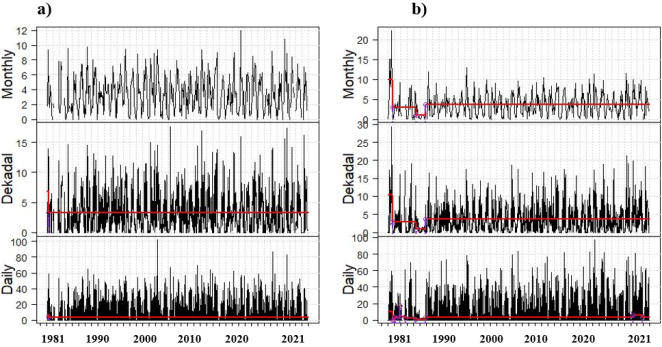
Figure A1. Temporal homogeneity test result for change in precipitation with respect to daily, dekadal and monthly time series (a) Boditi school station and (b) Wolaita sodo station. The two stations are here selected due to the amount of precipitation time series (Appendix) and here desired for graphical representation. In the Figure A1, the purple dotted line show breakpoint in time series dataset and the red lines show the trend caused by inhomogeneity in time series. Only one breakpoint identified at Boditi station at daily and dekadal time series during April 1981. Whereas more breakpoint is identified for wolaita sodo station at daily, dekadal and monthly time series, respectively. This inhomogeneity may be caused by re-locating station for a few meters from original location, change in instruments, observing practice and station environment.
Table A2. Correlation between NASA POWER reanalysis products and observation dataset at Bilate, Boditi School and Wolaita sodo stations. These stations are selected due to percentage of available data, 1.9% to 5.3% of precipitation missing, 6.3% to 17.2% of minimum temperature missing and 6.3% to 17.2% maximum temperature missing, respectively (Table A1).

Reference stations

Tmax

Tmin

precip

Bilate

0.77

0.32

0.23

Boditi school

0.75

0.36

0.26

Wolaita sodo

0.78

0.28

0.29

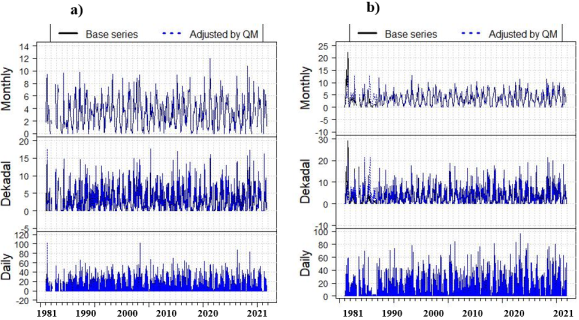
Figure A2. Inhomogeneity adjusted time series plot (a) Bodisti school station and (b) Wolaita sodo stations. The detected inhomogeneity is adjusted by QM which compares quantiles before and after the breakpoint. The black line represents base time series before adjustment and the blue line represent adjusted time series, respectively.
Table A3. Statistics of regression model between maize yield and precipitation, minimum, maximum temperature.

Single Climate conditions

r

MSE

RMSE

MAPE

Precip

+0.352

0.12

22.03

4.69

117.86

Tmin

-0.362

0.13

21.85

4.67

17.26

Tmax

-0.282

0.08

23.13

4.81

17.47

Tmean

-0.384

0.15

21.42

4.63

16.43

References
[1] N. Bellouin et al., “Radiative forcing of climate change from the Copernicus reanalysis of atmospheric composition,” Earth Syst. Sci. Data, vol. 12, no. 3, pp. 1649–1677, 2020,
[2] B. Z. Shakhashiri and J. A. Bell, “Climate change and our responsibilities as chemists,” Arab. J. Chem., vol. 7, no. 1, pp. 5–9, 2017,
[3] E. Fida and D. E. Secretary, “Sixth Assessment Report of the Intergovernmental Panel on Climate Change,” 2023.
[4] S. I. Seneviratne et al., Climate Change 2021: The Physical Science Basis. Contribution of Working Group I to the Sixth Assessment Report of the Intergovernmental Panel on Climate Change. 2021.
[5] D. N. Mubiru et al., “Climate trends, risks and coping strategies in smallholder farming systems in Uganda,” Clim. Risk Manag., vol. 22, no. October 2018, pp. 4–21, 2018,
[6] D. K. Ray, P. C. West, M. Clark, J. S. Gerber, A. V. Prishchepov, and S. Chatterjee, “Climate change has likely already affected global food production,” PLoS One, vol. 14, no. 5, pp. 1–18, 2019,
[7] T. Ballard, J. Coates, A. Swindale, and M. Deitchler, “Household Hunger Scale (HHS): Indicator Definition and Measurement Guide| Food and Nutrition Technical Assistance III Project (FANTA).” 2011.
[8] G. P. Cudjoe, P. Antwi-Agyei, and B. A. Gyampoh, “The effect of climate variability on maize production in the ejura-sekyedumase municipality, ghana,” Climate, vol. 9, no. 10, 2021,
[9] S. Neenu, A. K. Biswas, and A. Subba Rao, “Impact of Climatic Factors on Crop Production - A Review,” Agric. Rev., vol. 34, no. 2, pp. 97–106, 2013, [Online]. Available:
[10] Q. Yu, L. Li, Q. Luo, D. Eamus, C. Chen, and S. Xu, “Year patterns of climate impact on wheat yields. Int. J. Climatol, whi,” 2014.
[11] F. N. And and T. Watanabe, “Influences of rainfall on crop production and suggestions for adaptation,” Int. J. Agric. Sci., vol. 5, no. 1, pp. 2167–447, 2015.
[12] S. Mar, H. Nomura, Y. Takahashi, K. Ogata, and M. Yabe, “Impact of erratic rainfall from climate change on pulse production efficiency in Lower Myanmar,” Sustain., vol. 10, no. 2, pp. 1–16, 2018,
[13] T. Z. Geneti, “Review on the Effect of Moisture or Rain Fall on Crop Production,” Civ. Environ. Res., vol. 11, no. 2, pp. 1–7, 2019,
[14] M. Hasanuzzaman, K. Nahar, M. M. Alam, R. Roychowdhury, and M. Fujita, “Physiological, biochemical, and molecular mechanisms of heat stress tolerance in plants,” Int. J. Mol. Sci., vol. 14, no. 5, pp. 9643–9684, 2013,
[15] C. J. Andrews, “PRODUCTION_AN OVERVIEW,” vol. 67, no. October, pp. 1121–1133, 1987.
[16] WB and ADB, “Climate risk country profile - Uzbekistan,” p. 32, 2020, [Online]. Available:
[17] A. M. Gelaw and A. Ababa, “Climate-Smart Agriculture in Ethiopia,” no. January 2017, 2018.
[18] CSA, “The Federa Democratic Republic of Ethiopia, the Centeral Statistical Agency (CSA) Report on Area and Production of Majr Crops,” vol. I, 2020.
[19] T. Abate et al., “Factors that transformed maize productivity in Ethiopia,” Food Secur., vol. 7, no. 5, pp. 965–981, 2015,
[20] A. Seyoum Taffesse, P. Dorosh, and S. A. Gemessa, “Crop production in Ethiopia: Regional patterns and trends,” Food Agric. Ethiop. Prog. Policy Challenges, vol. 9780812208, pp. 53–83, 2013,
[21] B. Simane, B. F. Zaitchik, and J. D. Foltz, “Agroecosystem specific climate vulnerability analysis: application of the livelihood vulnerability index to a tropical highland region,” Mitig. Adapt. Strateg. Glob. Chang., vol. 21, pp. 39–65, 2016.
[22] A. Mekonnen, A. Tessema, Z. Ganewo, and A. Haile, “Climate change impacts on household food security and farmers adaptation strategies,” J. Agric. Food Res., vol. 6, no. August, p. 100197, 2021,
[23] D. G. C. Kirono, J. R. A. Butler, J. L. McGregor, A. Ripaldi, J. Katzfey, and K. Nguyen, “Historical and future seasonal rainfall variability in Nusa Tenggara Barat Province, Indonesia: Implications for the agriculture and water sectors,” Clim. Risk Manag., vol. 12, pp. 45–58, 2016,
[24] CSA, “The Federal Democratic Republic of Ethiopia Central Statistical Agency (CSA) Report on Area, Production and Farm Management Practice of Belg Season Crops for Private Peasant Holdings,” vol. V, p. 25, 2021.
[25] K. Georgis, “Planning national adaptation responses to climate change,” Outcome Case, 2015.
[26] T. M. Olango, B. Tesfaye, M. Catellani, and M. E. Pè, “Indigenous knowledge, use and on-farm management of enset (Ensete ventricosum (Welw.) Cheesman) diversity in Wolaita, Southern Ethiopia,” J. Ethnobiol. Ethnomed., vol. 10, no. 1, pp. 1–18, 2014.
[27] Y. Gecho, “Rural Household Livelihood Strategies: Options and Determinants in the Case of Wolaita Zone, Southern Ethiopia,” Soc. Sci., vol. 3, no. 3, p. 92, 2014,
[28] H. Hurni, “Agroecologial belts of Ethiopia: Explanatory notes on three maps at a scale of 1:1,000,000,” Res. Report, Soil Conserv. Res. program, Addis Ababa, p. 43, 1998.
[29] S. Ebnesajjad, “Production and Market Statistics,” Fluoroplastics, no. July, pp. 8–11, 2015,
[30] T. Beshah, Explaining soil and water conservation in Konso, Wolaita and Wello, Ethiopia. 2003.
[31] S. Zeverte-Rivza, A. Nipers, and I. Pilvere, “Agricultural Production and Market Modelling Approaches,” Econ. Sci. Rural Dev., no. July, p. 3, 2017,
[32] T. Zhang, P. W. Stackhouse Jr, W. Chandler, J. M. Hoell, D. Westberg, and C. H. Whitlock, “A global assessment of solar energy resources: NASA’s Prediction of Worldwide Energy Resources (POWER) project,” in AGU Fall Meeting Abstracts, 2010, pp. U23A-0017.
[33] M. M. Rienecker et al., “MERRA: NASA’s modern-era retrospective analysis for research and applications,” J. Clim., vol. 24, no. 14, pp. 3624–3648, 2011.
[34] L. Cochrane and Y. W. Bekele, “Data in Brief Average crop yield (2001 – 2017) in Ethiopia: Trends at national, regional and zonal levels,” Data Br., vol. 16, pp. 1025–1033, 2018,
[35] E. Aguilar, I. Auer, M. Brunet, T. C. Peterson, and J. Wieringa, “Coordinator of text: Enric Aguilar (Contributions by: Enric Aguilar, Inge Auer, Manola Brunet, Thomas C. Peterson, and Jon Wieringa) Edited by: Paul Llansó,” World Meteorol. Organ., no. 1186, p. 52, 2003.
[36] H. Alexandersson, “Alexandersson, Hans. ‘A homogeneity test applied to precipitation data.’ Journal of climatology 6.6 (1986): 661-675.,” J. Climatol. 1986 - Wiley Online Libr., 1986.
[37] B. Thrasher, E. P. Maurer, C. Mckellar, and P. B. Duffy, “Technical Note: Bias correcting climate model simulated daily temperature extremes with quantile mapping,” pp. 3309–3314, 2012,
[38] J. Ringard, F. Seyler, and L. Linguet, “A quantile mapping bias correction method based on hydroclimatic classification of the Guiana shield,” Sensors, vol. 17, no. 6, p. 1413, 2017.
[39] WCDP/WMO, “Joint Ccl / Clivar / Jcomm Expert Team on Climate,” Analysis, no. 64, 2007.
[40] H. B. Mann, “Non-Parametric Test Against Trend,” Econometrica, vol. 13, no. 3, pp. 245–259, 1945, [Online]. Available:
[41] P. K. Sen, “Estimates of the Regression Coefficient Based on Kendall’s Tau,” J. Am. Stat. Assoc., vol. 63, no. 324, pp. 1379–1389, 1968,
[42] V. Potopova, C. Boroneanţ, B. Boincean, and J. Soukup, “Impact of agricultural drought on main crop yields in the Republic of Moldova,” Int. J. Climatol., vol. 36, no. 4, pp. 2063–2082, 2016.
[43] Shalabh, “Multiple Linear Regression Model The linear model,” Regres. Anal., pp. 1–40, 2017.
[44] S. Boslaugh, “Pearson Correlation Coefficient,” Encycl. Epidemiol., no. April, 2012,
[45] Bangdiwala, S. I. (2018). Regression: multiple linear. International Journal of Injury Control and Safety Promotion, 25(2), 232–236.
[46] IPCC a, “Climate Change 2014 Synthesis Report Summary Chapter for Policymakers,” Ipcc, p. 31, 2014.
[47] A. Pirani, Y. Chen, E. Lonnoy, K. Leitzell, S. L. Connors, and S. Berger, “Climate Change 2021 The Physical Science Basis Working Group I Contribution to the Sixth Assessment Report of the Intergovernmental Panel on Climate Change,” 2021,
[48] F. T. Kobe, “UNDERSTANDING CLIMATE CHANGE IN ETHIOPIA: IMPACTS AND,” no. January, 2024,
[49] N. A. Plan, “Ethiopia ’ s Climate Resilient Green Economy,” no. May, 2019.
[50] C. Mcsweeney, M. New, and G. Lizcano, “UNDP Climate Change Country Profiles: Ethiopian. Available:
[51] T. M. Weldegerima, B. S. Birhanu, and T. T. Zeleke, “Trend Analysis for Temperature and Precipitation Extreme Events over the Headwater of Upper Blue Nile, Ethiopia,” vol. 14, no. 3, 2023,
[52] D. Obsi, D. Korecha, and W. Garedew, “Evidences of climate change presences in the wettest parts of southwest Ethiopia,” Heliyon, vol. 7, no. July, p. e08009, 2021,
[53] G. B. Wubaye et al., “Trends in Rainfall and Temperature Extremes in Ethiopia: Station and Agro-Ecological Zone Levels of Analysis,” Atmosphere (Basel)., vol. 14, no. 3, 2023,
[54] D. Dalle, Y. Gecho, and S. B. Bedeke, “Spatiotemporal Variability and Trends in Rainfall and Temperature in South Ethiopia: Implications for Climate Change Adaptations in Rural Communities,” Adv. Meteorol., vol. 2023, 2023,
[55] A. Mekasha and A. J. Duncan, “Trends in daily observed temperature and precipitation extremes over three Ethiopian eco-environments,” 2013,
[56] T. Dinku, “The Climate Data Tool: Enhancing Climate Services Across Africa,” no. April, 2022,
[57] WMO, WMO Guidelines on Generating a Defined Set of National Climate Monitoring Products 2017, no. 1204. 2017.
[58] R. E. Neild and J. E. Newman, Growing season characteristics and requirements in the Corn Belt. Cooperative Extension Service, Iowa State University, 1987.
[59] M. Farooq, T. Aziz, S. M. A. Basra, M. A. Cheema, and H. Rehman, “Chilling tolerance in hybrid maize induced by seed priming with salicylic acid,” J. Agron. Crop Sci., vol. 194, no. 2, pp. 161–168, 2008,
[60] G. M. and M. M. Solomon Abirdew*, “Determination of Crop Water Requirements for Maize in Abshege Woreda, Gurage Zone, Ethiopia,” no. January, pp. 8–11, 2018,
[61] A. Asfaw, B. Simane, A. Hassen, and A. Bantider, “Variability and time series trend analysis of rainfall and temperature in northcentral Ethiopia: A case study in Woleka sub-basin,” vol. 19, no. June 2017, pp. 29–41, 2018,
[62] T. B. Abdisa, G. M. Diga, and A. R. Tolessa, “Impact of climate variability on rain-fed maize and sorghum yield among smallholder farmers,” Cogent Food Agric., vol. 8, no. 1, 2022,
[63] D. K. A. Frank Baffour-Ata, Joseph Sarfo Tabi, Alfredina Sangber-Dery, Ephraim Eyram Etu-Mantey, “Effect of rainfall and temperature variability on maize yield in the Asante Akim North District, Ghana,” vol. 5, no. February, p. 100222, 2023,
[64] A. W. Degife, F. Zabel, and W. Mauser, “Climate change impacts on potential maize yields in Gambella Region, Ethiopia,” Reg. Environ. Chang., vol. 21, no. 2, 2021,
[65] C. Makate, “Effective scaling of climate smart agriculture innovations in African smallholder agriculture: A review of approaches, policy and institutional strategy needs,” Environ. Sci. Policy, vol. 96, no. August 2018, pp. 37–51, 2019,
[66] J. R. Porter et al., “Food security and food production systems,” 2014.
[67] Y. Li, K. Guan, G. D. Schnitkey, E. Delucia, and B. Peng, “Excessive rainfall leads to maize yield loss of a comparable magnitude to extreme drought in the United States,” no. October 2018, pp. 1–13, 2019,
[68] C. Simanjuntak et al., “Impact of climate extreme events and their causality on maize yield in South Africa,” Sci. Rep., pp. 1–15, 2023,
Cite This Article
  • APA Style

    Badacho, T. B., Geleta, T. D., Lema, M. D., Wondimu, S. A., Wahima, B. T. (2024). Climate Change Impact on Rain-Fed Maize Yield Cultivated with Small-Scale Landowners in Wolaita Zone, Ethiopia. International Journal of Energy and Environmental Science, 9(2), 20-37. https://doi.org/10.11648/j.ijees.20240902.11

    Copy | Download

    ACS Style

    Badacho, T. B.; Geleta, T. D.; Lema, M. D.; Wondimu, S. A.; Wahima, B. T. Climate Change Impact on Rain-Fed Maize Yield Cultivated with Small-Scale Landowners in Wolaita Zone, Ethiopia. Int. J. Energy Environ. Sci. 2024, 9(2), 20-37. doi: 10.11648/j.ijees.20240902.11

    Copy | Download

    AMA Style

    Badacho TB, Geleta TD, Lema MD, Wondimu SA, Wahima BT. Climate Change Impact on Rain-Fed Maize Yield Cultivated with Small-Scale Landowners in Wolaita Zone, Ethiopia. Int J Energy Environ Sci. 2024;9(2):20-37. doi: 10.11648/j.ijees.20240902.11

    Copy | Download

  • @article{10.11648/j.ijees.20240902.11,
      author = {Tadele Badebo Badacho and Tesfaye Dessu Geleta and Mehuba Demissie Lema and Sintayehu Abera Wondimu and Birtukan Tadesse Wahima},
      title = {Climate Change Impact on Rain-Fed Maize Yield Cultivated with Small-Scale Landowners in Wolaita Zone, Ethiopia
    },
      journal = {International Journal of Energy and Environmental Science},
      volume = {9},
      number = {2},
      pages = {20-37},
      doi = {10.11648/j.ijees.20240902.11},
      url = {https://doi.org/10.11648/j.ijees.20240902.11},
      eprint = {https://article.sciencepublishinggroup.com/pdf/10.11648.j.ijees.20240902.11},
      abstract = {Ethiopia is a country that heavily relies on rainfall-aided cultivation which is carried out by small-scale landowners, leaving it very vulnerable to climate change and fluctuation. The primary goal of this research is to investigate how climate change affects maize yield in Wolaita zone of Ethiopia. The authors were employed a linear regression method to evaluate the relationship between climate parameters and maize yield. Sen's slope magnitude estimator and the Mann-Kendal trend test were used to assess the significance of climate change. The outcome demonstrated that the temperature extreme indices of warm days and the length of warm days were considerably higher by 37.5% and 3.7% of days per year, however, cold days and cold spells were significantly decreased. Over the 1981-2021 periods, there was a significant upward pattern in TXx and TNn at an average of 0.033°C and 0.034°C. There was a considerable decline of 2.3% in the simple daily precipitation intensity index and 33% decreased in extremely heavy precipitation, respectively. The correlation analysis's findings indicated that growing period precipitation and maize outputs were positively correlated, but negatively correlated with maximum and minimum temperatures. Extreme temperature and precipitation were more explained a maize yield than average climate patterns. 12.4%, 14.76%, 13.08%, and 7.95% of maize output variability was attributed by the growing season mean climate conditions, which include precipitation, mean, minimum, and maximum temperature. The variability of maize output was explained by combined impact of precipitation and temperature extremes were 67.7% and 45.0%, respectively. Therefore, livelihood diversification and relevant policy formulation are suggested to adapt inevitable climate change by implementing irrigation and resistant varieties to improve maize yield production.
    },
     year = {2024}
    }
    

    Copy | Download

  • TY  - JOUR
    T1  - Climate Change Impact on Rain-Fed Maize Yield Cultivated with Small-Scale Landowners in Wolaita Zone, Ethiopia
    
    AU  - Tadele Badebo Badacho
    AU  - Tesfaye Dessu Geleta
    AU  - Mehuba Demissie Lema
    AU  - Sintayehu Abera Wondimu
    AU  - Birtukan Tadesse Wahima
    Y1  - 2024/07/08
    PY  - 2024
    N1  - https://doi.org/10.11648/j.ijees.20240902.11
    DO  - 10.11648/j.ijees.20240902.11
    T2  - International Journal of Energy and Environmental Science
    JF  - International Journal of Energy and Environmental Science
    JO  - International Journal of Energy and Environmental Science
    SP  - 20
    EP  - 37
    PB  - Science Publishing Group
    SN  - 2578-9546
    UR  - https://doi.org/10.11648/j.ijees.20240902.11
    AB  - Ethiopia is a country that heavily relies on rainfall-aided cultivation which is carried out by small-scale landowners, leaving it very vulnerable to climate change and fluctuation. The primary goal of this research is to investigate how climate change affects maize yield in Wolaita zone of Ethiopia. The authors were employed a linear regression method to evaluate the relationship between climate parameters and maize yield. Sen's slope magnitude estimator and the Mann-Kendal trend test were used to assess the significance of climate change. The outcome demonstrated that the temperature extreme indices of warm days and the length of warm days were considerably higher by 37.5% and 3.7% of days per year, however, cold days and cold spells were significantly decreased. Over the 1981-2021 periods, there was a significant upward pattern in TXx and TNn at an average of 0.033°C and 0.034°C. There was a considerable decline of 2.3% in the simple daily precipitation intensity index and 33% decreased in extremely heavy precipitation, respectively. The correlation analysis's findings indicated that growing period precipitation and maize outputs were positively correlated, but negatively correlated with maximum and minimum temperatures. Extreme temperature and precipitation were more explained a maize yield than average climate patterns. 12.4%, 14.76%, 13.08%, and 7.95% of maize output variability was attributed by the growing season mean climate conditions, which include precipitation, mean, minimum, and maximum temperature. The variability of maize output was explained by combined impact of precipitation and temperature extremes were 67.7% and 45.0%, respectively. Therefore, livelihood diversification and relevant policy formulation are suggested to adapt inevitable climate change by implementing irrigation and resistant varieties to improve maize yield production.
    
    VL  - 9
    IS  - 2
    ER  - 

    Copy | Download

Author Information